OPEN-SOURCE SCRIPT
RSI EMA Dot (Long Below / Short Above)
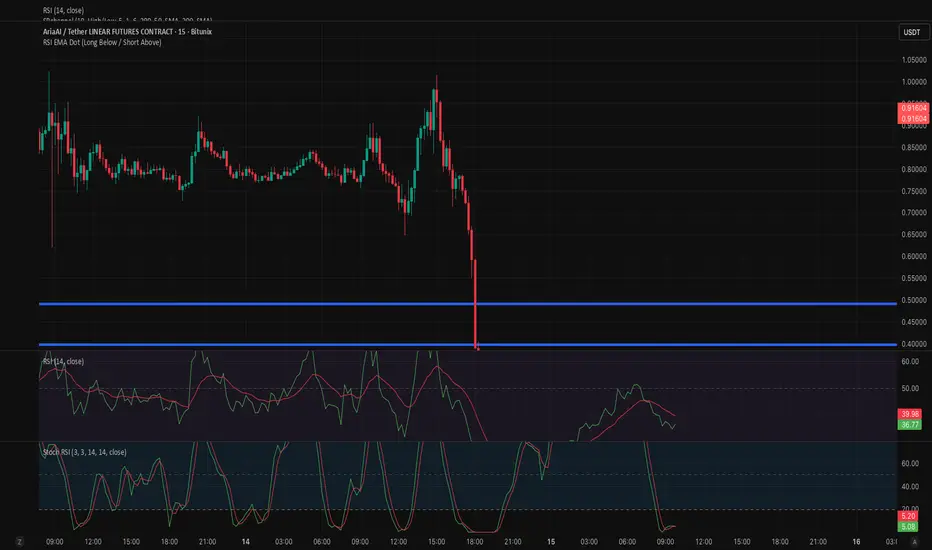
RSI EMA Cross Dot Indicator
This indicator identifies potential reversal points by combining RSI extremes with momentum shifts.
A signal is generated when the RSI (14) crosses its EMA (14) after being in an extreme zone:
Long signal (green dot below the candle):
RSI was below 20 (oversold) and then crosses above its EMA.
Short signal (red dot above the candle):
RSI was above 80 (overbought) and then crosses below its EMA.
Dots are plotted directly on the chart:
Long signals appear below the candle
Short signals appear above the candle
This helps highlight potential market reversals after extreme conditions, making it useful for identifying high-probability reaction zones.
This indicator identifies potential reversal points by combining RSI extremes with momentum shifts.
A signal is generated when the RSI (14) crosses its EMA (14) after being in an extreme zone:
Long signal (green dot below the candle):
RSI was below 20 (oversold) and then crosses above its EMA.
Short signal (red dot above the candle):
RSI was above 80 (overbought) and then crosses below its EMA.
Dots are plotted directly on the chart:
Long signals appear below the candle
Short signals appear above the candle
This helps highlight potential market reversals after extreme conditions, making it useful for identifying high-probability reaction zones.
Script de código abierto
Fiel al espíritu de TradingView, el creador de este script lo ha convertido en código abierto, para que los traders puedan revisar y verificar su funcionalidad. ¡Enhorabuena al autor! Aunque puede utilizarlo de forma gratuita, recuerde que cualquier republicación del código está sujeta a nuestras Normas internas.

Exención de responsabilidad
La información y las publicaciones no constituyen, ni deben considerarse como, asesoramiento o recomendaciones financieras, de inversión, de trading u otro tipo, proporcionadas o respaldadas por TradingView. Obtenga más información en Condiciones de uso.
Script de código abierto
Fiel al espíritu de TradingView, el creador de este script lo ha convertido en código abierto, para que los traders puedan revisar y verificar su funcionalidad. ¡Enhorabuena al autor! Aunque puede utilizarlo de forma gratuita, recuerde que cualquier republicación del código está sujeta a nuestras Normas internas.
Exención de responsabilidad
La información y las publicaciones no constituyen, ni deben considerarse como, asesoramiento o recomendaciones financieras, de inversión, de trading u otro tipo, proporcionadas o respaldadas por TradingView. Obtenga más información en Condiciones de uso.