OPEN-SOURCE SCRIPT
MGC SMA Gravity + Extreme Stretch + Joe Dirt Scanner
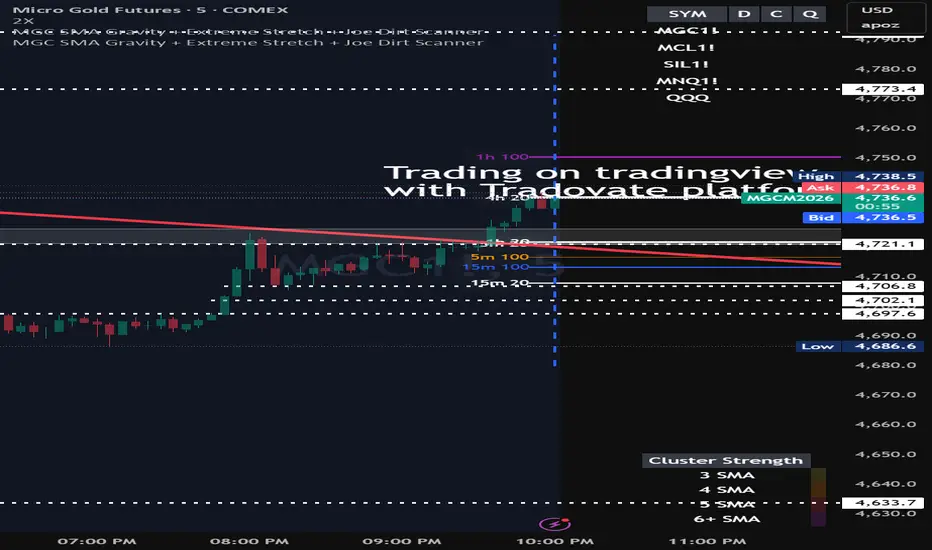
MGC SMA Gravity + Extreme Stretch + Joe Dirt Scanner is a multi-timeframe moving average confluence tool built to help traders identify support/resistance clusters, mean reversion extremes, and “gravity zones” where price often reacts.
This indicator plots a layered SMA ladder using:
5-minute 20 SMA and 100 SMA
15-minute 20 SMA and 100 SMA
1-hour 20 SMA and 100 SMA
4-hour 20 SMA
Core Features
SMA Gravity Cluster Heat Map
Detects when multiple SMAs compress within a user-defined tick distance, creating a potential “gravity zone” where price may be drawn, stall, bounce, or reverse.
Dynamic heat map shows cluster strength
Color-coded confluence zones:
Yellow = 3 SMA cluster
Orange = 4 SMA cluster
Red = 5 SMA cluster
Purple = 6+ SMA cluster
A dashed “magnet line” marks the center of the cluster as a potential mean reversion target.
Multi-Timeframe SMA Ladder
Projects higher-timeframe SMA levels directly onto the active chart using horizontal rays and labels, creating a visual map of stacked support and resistance.
Extreme Stretch Scanner (Mean Reversion Signals)
Measures price distance from the average of all tracked SMAs.
When price extends beyond a user-defined threshold:
OB = Extreme Overbought condition
OS = Extreme Oversold condition
Designed to help identify exhaustion moves where price may revert back toward the SMA mean.
Customizable Inputs
Cluster distance in ticks
Minimum SMA spacing filter
Extreme stretch threshold
Heat map on/off
Heat map legend on/off
Alerts Included
Extreme Overbought alert
Extreme Oversold alert
Intended Use
This tool is designed for:
Mean reversion traders
Futures traders (especially MGC/GC)
Confluence-based support/resistance analysis
Identifying “stretched” conditions away from equilibrium
Spotting areas where multiple moving averages act as a price magnet
This is not a standalone buy/sell system, but a decision-support tool meant to improve context, location awareness, and timing around SMA structure.
This indicator plots a layered SMA ladder using:
5-minute 20 SMA and 100 SMA
15-minute 20 SMA and 100 SMA
1-hour 20 SMA and 100 SMA
4-hour 20 SMA
Core Features
SMA Gravity Cluster Heat Map
Detects when multiple SMAs compress within a user-defined tick distance, creating a potential “gravity zone” where price may be drawn, stall, bounce, or reverse.
Dynamic heat map shows cluster strength
Color-coded confluence zones:
Yellow = 3 SMA cluster
Orange = 4 SMA cluster
Red = 5 SMA cluster
Purple = 6+ SMA cluster
A dashed “magnet line” marks the center of the cluster as a potential mean reversion target.
Multi-Timeframe SMA Ladder
Projects higher-timeframe SMA levels directly onto the active chart using horizontal rays and labels, creating a visual map of stacked support and resistance.
Extreme Stretch Scanner (Mean Reversion Signals)
Measures price distance from the average of all tracked SMAs.
When price extends beyond a user-defined threshold:
OB = Extreme Overbought condition
OS = Extreme Oversold condition
Designed to help identify exhaustion moves where price may revert back toward the SMA mean.
Customizable Inputs
Cluster distance in ticks
Minimum SMA spacing filter
Extreme stretch threshold
Heat map on/off
Heat map legend on/off
Alerts Included
Extreme Overbought alert
Extreme Oversold alert
Intended Use
This tool is designed for:
Mean reversion traders
Futures traders (especially MGC/GC)
Confluence-based support/resistance analysis
Identifying “stretched” conditions away from equilibrium
Spotting areas where multiple moving averages act as a price magnet
This is not a standalone buy/sell system, but a decision-support tool meant to improve context, location awareness, and timing around SMA structure.
Script de código abierto
Fiel al espíritu de TradingView, el creador de este script lo ha convertido en código abierto, para que los traders puedan revisar y verificar su funcionalidad. ¡Enhorabuena al autor! Aunque puede utilizarlo de forma gratuita, recuerde que cualquier republicación del código está sujeta a nuestras Normas internas.

Exención de responsabilidad
La información y las publicaciones no constituyen, ni deben considerarse como, asesoramiento o recomendaciones financieras, de inversión, de trading u otro tipo, proporcionadas o respaldadas por TradingView. Obtenga más información en Condiciones de uso.
Script de código abierto
Fiel al espíritu de TradingView, el creador de este script lo ha convertido en código abierto, para que los traders puedan revisar y verificar su funcionalidad. ¡Enhorabuena al autor! Aunque puede utilizarlo de forma gratuita, recuerde que cualquier republicación del código está sujeta a nuestras Normas internas.
Exención de responsabilidad
La información y las publicaciones no constituyen, ni deben considerarse como, asesoramiento o recomendaciones financieras, de inversión, de trading u otro tipo, proporcionadas o respaldadas por TradingView. Obtenga más información en Condiciones de uso.