UVOL / DVOL Ratio
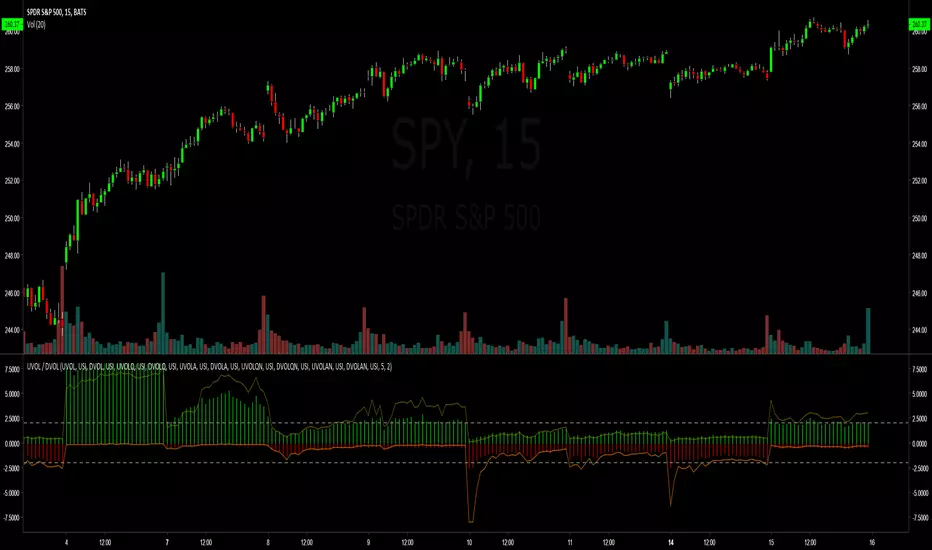
Plots the NYSE, NASDAQ, AMEX UP Volume and DOWN Volume ratios as a histogram - and adds the index UVOL / DVOL ratios as a line graph.
DVOL is represented as negative - UVOL as positive. When either is above 2 its a good predictor of the day's outcome. At least - it tells you if the bulls or bears are winning the day.
Really simple to use / edit to your needs
Enjoy
DVOL is represented as negative - UVOL as positive. When either is above 2 its a good predictor of the day's outcome. At least - it tells you if the bulls or bears are winning the day.
Really simple to use / edit to your needs
Enjoy

Exención de responsabilidad
La información y las publicaciones no constituyen, ni deben considerarse como, asesoramiento o recomendaciones financieras, de inversión, de trading u otro tipo, proporcionadas o respaldadas por TradingView. Obtenga más información en Condiciones de uso.
Exención de responsabilidad
La información y las publicaciones no constituyen, ni deben considerarse como, asesoramiento o recomendaciones financieras, de inversión, de trading u otro tipo, proporcionadas o respaldadas por TradingView. Obtenga más información en Condiciones de uso.