OPEN-SOURCE SCRIPT
Consecutive Candle Streak Analysis [LuxAlgo]
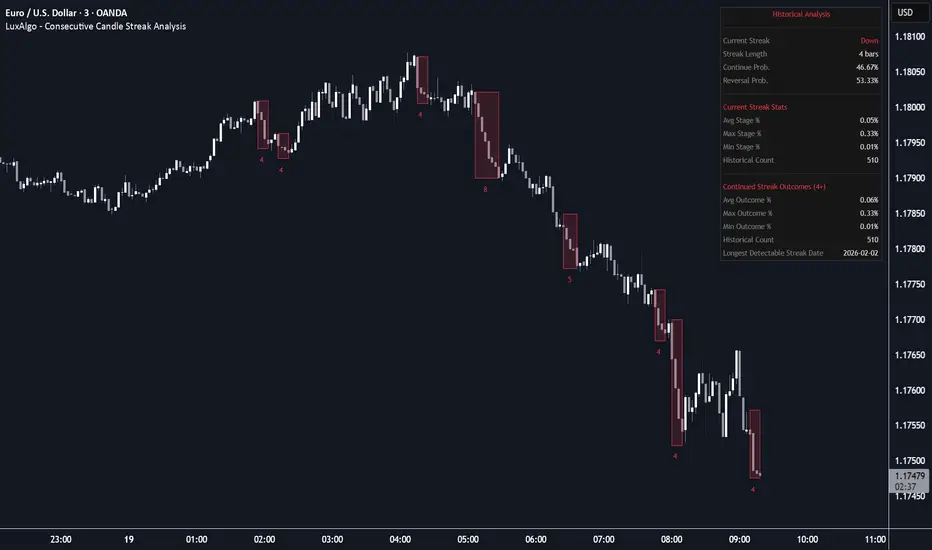
The Consecutive Candle Streak Analysis indicator provides an empirical framework for quantifying consecutive price trends by tracking streaks based on consecutive positive or negative returns. The tool benchmarks current market behavior against a comprehensive historical lookback to identify potential exhaustion points and mathematical reversal probabilities.
🔶 USAGE
This tool is optimized for high-timeframe analysis including Daily, Weekly, Monthly, and Quarterly intervals. Traders can use the dashboard to assess if a move is statistically overextended by comparing the current percentage change to the Max and Avg Stage outcomes. When a trend enters uncharted territory, the script triggers an UNPRECEDENTED alert, signaling that current price action has no historical parallel in the selected lookback.
🔹 Historical Benchmarking
The indicator automatically identifies every historical occurrence of a streak matching or exceeding the current length. Visual highlight boxes are projected over these historical matches, illustrating the absolute high and low ranges reached during those specific periods.
🔹 Statistical Analysis
The segmented dashboard provides real-time calculations for both Continuation and Reversal probabilities based on historical frequency distributions. It compares the current percentage move to historical performances at the exact same streak duration and displays the date of the longest detectable historical streak for institutional context.
🔶 DETAILS
The script processes historical bars to identify "completed streaks" where price has moved in a consistent direction (Close vs Previous Close). By storing these events in an array, the script can provide a granular comparison between the current active streak and every similar event in the past. This allows for a stage-by-stage analysis of how price typically behaves once a certain streak length is achieved.
🔶 SETTINGS
🔶 USAGE
This tool is optimized for high-timeframe analysis including Daily, Weekly, Monthly, and Quarterly intervals. Traders can use the dashboard to assess if a move is statistically overextended by comparing the current percentage change to the Max and Avg Stage outcomes. When a trend enters uncharted territory, the script triggers an UNPRECEDENTED alert, signaling that current price action has no historical parallel in the selected lookback.
🔹 Historical Benchmarking
The indicator automatically identifies every historical occurrence of a streak matching or exceeding the current length. Visual highlight boxes are projected over these historical matches, illustrating the absolute high and low ranges reached during those specific periods.
🔹 Statistical Analysis
The segmented dashboard provides real-time calculations for both Continuation and Reversal probabilities based on historical frequency distributions. It compares the current percentage move to historical performances at the exact same streak duration and displays the date of the longest detectable historical streak for institutional context.
🔶 DETAILS
The script processes historical bars to identify "completed streaks" where price has moved in a consistent direction (Close vs Previous Close). By storing these events in an array, the script can provide a granular comparison between the current active streak and every similar event in the past. This allows for a stage-by-stage analysis of how price typically behaves once a certain streak length is achieved.
🔶 SETTINGS
- Max Historical Streaks: Adjusts the depth of the historical buffer used for benchmarking calculations.
- Highlight Historical Matches: Toggles the visibility of visual highlight boxes and their respective directional length labels.
- Show 'Length & Longer' Stats: Adds an expanded dashboard section detailing the eventual outcomes of similar historical trends.
- Dashboard: Toggles the visibility of the statistical dashboard.
- Position: Determines the anchor point of the dashboard on the chart.
- Size: Adjusts the text and table scale for different screen resolutions.
Script de código abierto
Fiel al espíritu de TradingView, el creador de este script lo ha convertido en código abierto, para que los traders puedan revisar y verificar su funcionalidad. ¡Enhorabuena al autor! Aunque puede utilizarlo de forma gratuita, recuerde que cualquier republicación del código está sujeta a nuestras Normas internas.

Build your own edge with AI: luxalgo.com
All content provided by LuxAlgo is for informational & educational purposes only. Past performance does not guarantee future results.
All content provided by LuxAlgo is for informational & educational purposes only. Past performance does not guarantee future results.
Exención de responsabilidad
La información y las publicaciones no constituyen, ni deben considerarse como, asesoramiento o recomendaciones financieras, de inversión, de trading u otro tipo, proporcionadas o respaldadas por TradingView. Obtenga más información en Condiciones de uso.
Script de código abierto
Fiel al espíritu de TradingView, el creador de este script lo ha convertido en código abierto, para que los traders puedan revisar y verificar su funcionalidad. ¡Enhorabuena al autor! Aunque puede utilizarlo de forma gratuita, recuerde que cualquier republicación del código está sujeta a nuestras Normas internas.
Build your own edge with AI: luxalgo.com
All content provided by LuxAlgo is for informational & educational purposes only. Past performance does not guarantee future results.
All content provided by LuxAlgo is for informational & educational purposes only. Past performance does not guarantee future results.
Exención de responsabilidad
La información y las publicaciones no constituyen, ni deben considerarse como, asesoramiento o recomendaciones financieras, de inversión, de trading u otro tipo, proporcionadas o respaldadas por TradingView. Obtenga más información en Condiciones de uso.