OPEN-SOURCE SCRIPT
Actualizado Volume Truth Engine V1 [ViZ]
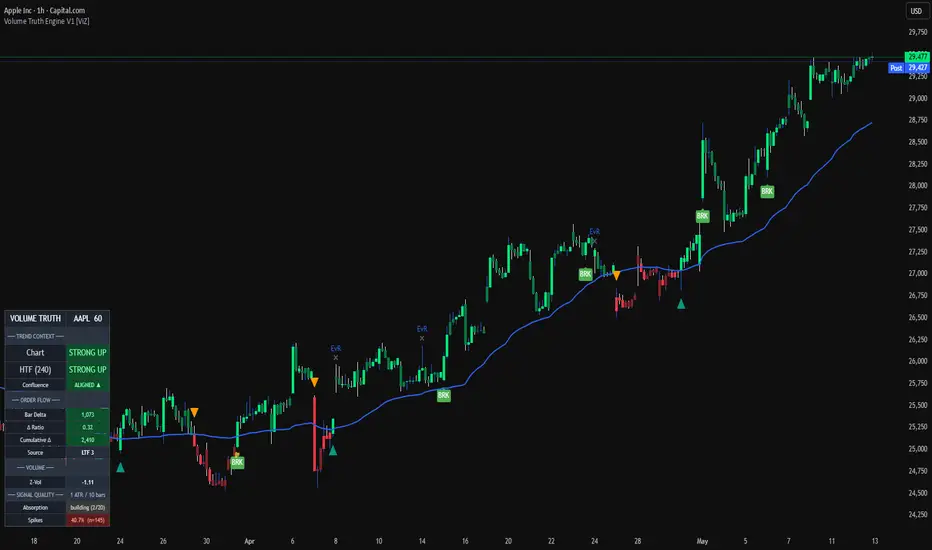
Volume Truth Engine — Publication Description
═══════════════════════════════════════
Most volume indicators tell you when volume is high.
This one tells you where it's coming from, whether it's being absorbed, and whether the higher timeframe agrees.
═══════════════════════════════════════
WHAT MAKES THIS DIFFERENT
Real directional volume Instead of treating volume as a single number per bar, the indicator pulls lower-timeframe data and splits each bar into estimated buy-side and sell-side participation. The difference is delta — and it's the foundation everything else is built on. Most TradingView volume indicators don't do this. The ones that claim to usually use candle-body proxies, which aren't the same thing.
Higher-timeframe confluence, built in Every signal is checked against the higher timeframe automatically. 15m maps to 1H, 1H to 4H, 4H to Daily, and so on. When the HTF agrees with what's happening on your chart, signals are stronger. When it doesn't, you can choose to filter those signals out, flag them with a warning, or score them lower. No more taking "perfect" entries that fight the bigger trend.
The indicator measures its own performance Most indicators imply quality. This one proves it — or admits when it doesn't. A live hit-rate tracker shows whether absorption and spike signals actually predict price movement (1 ATR within 10 bars) on your specific instrument and timeframe. If a signal type underperforms on what you trade, you'll see it. That's rare on TradingView, and it's intentional.
═══════════════════════════════════════
THE SIGNALS
Trend Flip Arrows — teal and orange triangles Real direction changes, not chop. Require ATR-distance confirmation before firing.
Absorption Diamonds — lime and red ABS markers The highest-value signal. Price at a swing extreme while delta and volume disagree with the price direction — sellers exhausted at lows, buyers exhausted at highs. Reversal-watch, not reversal-guarantee.
Effort vs. Result — yellow EvR X-marks High volume, small body. Orders being absorbed without price movement. Often precedes reversals at extremes or breakouts at compression points.
Classified Spikes — three types, not one
• BRK — with-trend breakout spike. Continuation. • CLX — against-trend climactic spike at extreme. Exhaustion. • ABS — high-volume small-body absorption spike. Institutional soak.
Confluence Scores — 0/5 to 5/5 next to absorption signals Higher score, higher conviction. A 5/5 means HTF agrees, chart agrees, volume elevated, delta confirms, and location aligns.
═══════════════════════════════════════
HOW TO USE IT
In a strong trend (chart and HTF aligned) Trust with-trend BRK spikes on pullbacks. Watch CLX spikes near extremes as exhaustion warnings. High-conviction absorption only in the trend direction.
In a range or consolidation Absorption signals at range extremes are your highest-value entries. EvR inside the range often precedes the breakout. Don't chase trend flips here — wait for the state to hold.
When chart and HTF conflict ("CONFLICT ⚠" in the panel) Reduce size or stand aside. Counter-HTF signals historically produce lower-quality outcomes.
Around news and session opens The volume math assumes normal participation. First few bars after major releases can produce signals that reflect news shock rather than order flow. Use discretion.
═══════════════════════════════════════
THE STATS PANEL
Four sections, scannable in under two seconds.
• Trend Context — chart state, HTF state, and whether they agree • Order Flow — bar delta, ratio, cumulative delta, data source • Volume — Z-Vol with spike flag • Signal Quality — live hit-rate per signal type
Cumulative delta is worth watching specifically. Rising on sideways price means hidden accumulation. Falling on rising price means hidden distribution. The chart hides this. The panel doesn't.
═══════════════════════════════════════
A NOTE ON TRANSPARENCY
Hit-rate numbers display only after 20 samples accumulate. Before that, the panel shows "building (X/20)" so you know it's tracking but not yet meaningful. The measurement criterion (1 ATR within 10 bars) is one specific definition of success — directional follow-through within a short window. It doesn't measure P&L and doesn't capture slow-developing setups. Treat it as relative quality across signal types, not as a literal edge metric.
If a signal type consistently underperforms on your instrument, that's real information. Adjust accordingly.
═══════════════════════════════════════
HONEST CAVEATS
The lower-timeframe delta is an approximation, not real tick-by-tick order flow. It's much better than candle-body proxies but it isn't institutional-grade. Volume data quality varies by exchange — forex tick volume in particular is broker-aggregated, not true volume.
This is a decision aid, not a trading system. It surfaces context. The trade decisions are still yours.
═══════════════════════════════════════
WHAT TO DO FIRST
Load it on an instrument and timeframe you know well. Don't change any settings. Watch how the signals behave on bars you already understand — the breakout from last week, the reversal that caught you off-guard. See whether the indicator agrees with your read or surfaces something you missed.
After a few sessions, the hit-rate tracker will start producing real numbers. That's when the indicator starts working for you specifically.
Or if you want just open Bar Replay in different markets within different market regimes on different timeframes.
Feedback welcome in the comments. Include instrument, timeframe, and screenshot when reporting issues.
Happy trading.
═══════════════════════════════════════
Most volume indicators tell you when volume is high.
This one tells you where it's coming from, whether it's being absorbed, and whether the higher timeframe agrees.
═══════════════════════════════════════
WHAT MAKES THIS DIFFERENT
Real directional volume Instead of treating volume as a single number per bar, the indicator pulls lower-timeframe data and splits each bar into estimated buy-side and sell-side participation. The difference is delta — and it's the foundation everything else is built on. Most TradingView volume indicators don't do this. The ones that claim to usually use candle-body proxies, which aren't the same thing.
Higher-timeframe confluence, built in Every signal is checked against the higher timeframe automatically. 15m maps to 1H, 1H to 4H, 4H to Daily, and so on. When the HTF agrees with what's happening on your chart, signals are stronger. When it doesn't, you can choose to filter those signals out, flag them with a warning, or score them lower. No more taking "perfect" entries that fight the bigger trend.
The indicator measures its own performance Most indicators imply quality. This one proves it — or admits when it doesn't. A live hit-rate tracker shows whether absorption and spike signals actually predict price movement (1 ATR within 10 bars) on your specific instrument and timeframe. If a signal type underperforms on what you trade, you'll see it. That's rare on TradingView, and it's intentional.
═══════════════════════════════════════
THE SIGNALS
Trend Flip Arrows — teal and orange triangles Real direction changes, not chop. Require ATR-distance confirmation before firing.
Absorption Diamonds — lime and red ABS markers The highest-value signal. Price at a swing extreme while delta and volume disagree with the price direction — sellers exhausted at lows, buyers exhausted at highs. Reversal-watch, not reversal-guarantee.
Effort vs. Result — yellow EvR X-marks High volume, small body. Orders being absorbed without price movement. Often precedes reversals at extremes or breakouts at compression points.
Classified Spikes — three types, not one
• BRK — with-trend breakout spike. Continuation. • CLX — against-trend climactic spike at extreme. Exhaustion. • ABS — high-volume small-body absorption spike. Institutional soak.
Confluence Scores — 0/5 to 5/5 next to absorption signals Higher score, higher conviction. A 5/5 means HTF agrees, chart agrees, volume elevated, delta confirms, and location aligns.
═══════════════════════════════════════
HOW TO USE IT
In a strong trend (chart and HTF aligned) Trust with-trend BRK spikes on pullbacks. Watch CLX spikes near extremes as exhaustion warnings. High-conviction absorption only in the trend direction.
In a range or consolidation Absorption signals at range extremes are your highest-value entries. EvR inside the range often precedes the breakout. Don't chase trend flips here — wait for the state to hold.
When chart and HTF conflict ("CONFLICT ⚠" in the panel) Reduce size or stand aside. Counter-HTF signals historically produce lower-quality outcomes.
Around news and session opens The volume math assumes normal participation. First few bars after major releases can produce signals that reflect news shock rather than order flow. Use discretion.
═══════════════════════════════════════
THE STATS PANEL
Four sections, scannable in under two seconds.
• Trend Context — chart state, HTF state, and whether they agree • Order Flow — bar delta, ratio, cumulative delta, data source • Volume — Z-Vol with spike flag • Signal Quality — live hit-rate per signal type
Cumulative delta is worth watching specifically. Rising on sideways price means hidden accumulation. Falling on rising price means hidden distribution. The chart hides this. The panel doesn't.
═══════════════════════════════════════
A NOTE ON TRANSPARENCY
Hit-rate numbers display only after 20 samples accumulate. Before that, the panel shows "building (X/20)" so you know it's tracking but not yet meaningful. The measurement criterion (1 ATR within 10 bars) is one specific definition of success — directional follow-through within a short window. It doesn't measure P&L and doesn't capture slow-developing setups. Treat it as relative quality across signal types, not as a literal edge metric.
If a signal type consistently underperforms on your instrument, that's real information. Adjust accordingly.
═══════════════════════════════════════
HONEST CAVEATS
The lower-timeframe delta is an approximation, not real tick-by-tick order flow. It's much better than candle-body proxies but it isn't institutional-grade. Volume data quality varies by exchange — forex tick volume in particular is broker-aggregated, not true volume.
This is a decision aid, not a trading system. It surfaces context. The trade decisions are still yours.
═══════════════════════════════════════
WHAT TO DO FIRST
Load it on an instrument and timeframe you know well. Don't change any settings. Watch how the signals behave on bars you already understand — the breakout from last week, the reversal that caught you off-guard. See whether the indicator agrees with your read or surfaces something you missed.
After a few sessions, the hit-rate tracker will start producing real numbers. That's when the indicator starts working for you specifically.
Or if you want just open Bar Replay in different markets within different market regimes on different timeframes.
Feedback welcome in the comments. Include instrument, timeframe, and screenshot when reporting issues.
Happy trading.
Notas de prensa
Patch Update — Alerts CleanupCleaned up the alert messaging across the board for better readability.
The auto-firing alerts (used for webhooks and notifications) have been rewritten in clean, readable text format instead of compact JSON. Each alert now shows the signal type, symbol, timeframe, price, confluence score, Z-Vol, and Delta on separate lines for easy scanning.
No functional changes to signal logic — this is purely a messaging and readability update.
Script de código abierto
Fiel al espíritu de TradingView, el creador de este script lo ha convertido en código abierto, para que los traders puedan revisar y verificar su funcionalidad. ¡Enhorabuena al autor! Aunque puede utilizarlo de forma gratuita, recuerde que cualquier republicación del código está sujeta a nuestras Normas internas.

Exención de responsabilidad
La información y las publicaciones no constituyen, ni deben considerarse como, asesoramiento o recomendaciones financieras, de inversión, de trading u otro tipo, proporcionadas o respaldadas por TradingView. Obtenga más información en Condiciones de uso.
Script de código abierto
Fiel al espíritu de TradingView, el creador de este script lo ha convertido en código abierto, para que los traders puedan revisar y verificar su funcionalidad. ¡Enhorabuena al autor! Aunque puede utilizarlo de forma gratuita, recuerde que cualquier republicación del código está sujeta a nuestras Normas internas.
Exención de responsabilidad
La información y las publicaciones no constituyen, ni deben considerarse como, asesoramiento o recomendaciones financieras, de inversión, de trading u otro tipo, proporcionadas o respaldadas por TradingView. Obtenga más información en Condiciones de uso.