DrFX God Mode X - Structure and Confluence Dashboard
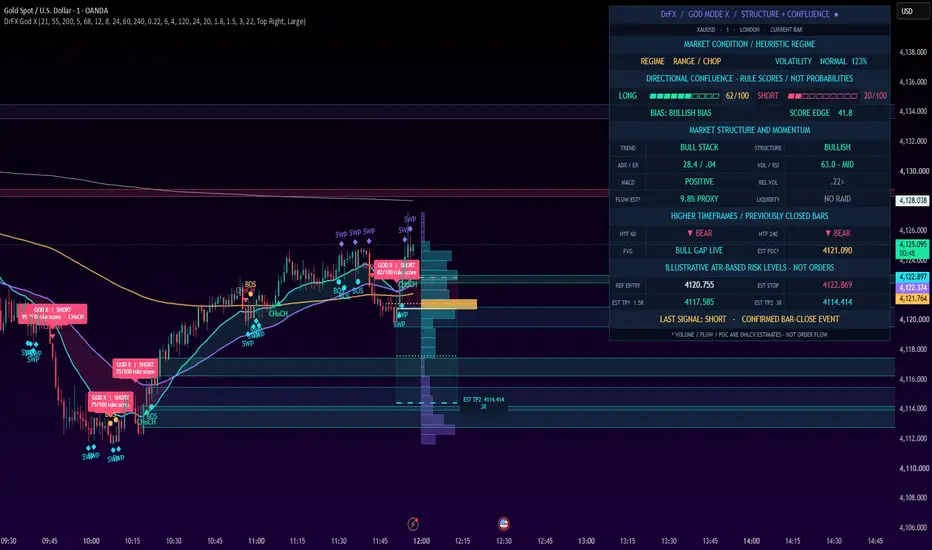
DrFX God Mode X - Structure and Confluence Dashboard
OVERVIEW
DrFX God Mode X is an overlay indicator combining trend context, confirmed market structure, directional momentum, higher-timeframe filters, volume-based estimates, and visual risk-reference levels in one chart interface.
The indicator provides separate bullish and bearish rule-agreement scores from 0 to 100. These scores summarize weighted technical conditions and do not represent probabilities of success or historical win rates.
SIGNAL GENERATION
Signals are based on qualifying EMA crosses, confirmed structure breaks, or fair value gaps, together with trend alignment and configurable confluence thresholds. Signals and alerts are confirmed at candle close. Live dashboard readings can change before the candle closes.
MARKET STRUCTURE AND PRICE ZONES
The indicator identifies confirmed swing breaks, BOS and CHoCH events, swing-level sweeps, three-candle fair value gaps, and simplified supply and demand zones. Pivot confirmation introduces delay. Liquidity and supply/demand labels describe price patterns and do not verify actual institutional orders or executions.
VOLUME ANALYSIS
The optional volume distribution approximates volume concentration by allocating reported candle volume across its high-low range. The estimated point of control and value area are not exchange-native volume-at-price measurements. Directional volume flow is an OHLCV-derived estimate, not actual bid/ask delta.
HIGHER-TIMEFRAME FILTERS
Two configurable filters use previously completed higher-timeframe candles. A filter is inactive when its selected timeframe is not greater than the chart timeframe.
RISK REFERENCES
The indicator may draw a reference entry at the confirmed signal candle close, an ATR-based stop, and configurable reward-to-risk targets. These are hypothetical analytical levels, not executable orders, guaranteed fills, or trading performance results.
VISUAL DASHBOARD
The dashboard summarizes market regime, bullish and bearish confluence, trend, momentum, structure, relative volume, higher-timeframe direction, and visual risk levels. Its dynamic visual elements update only when Pine Script executes on chart updates; independent continuous animation is not supported.
HOW TO USE
Add the indicator to a candlestick chart. Adjust the higher-timeframe inputs to intervals above the chart timeframe. Review scores together with structure, momentum, volatility, and volume context. Configure alerts for confirmed signals if desired. All visual modules can be adjusted through indicator settings.
LIMITATIONS
This is a rule-based indicator, not an automated trading strategy. No verified profitability, historical win rate, or future performance claim is provided. Pivot confirmation introduces delay, live dashboard values may fluctuate, and estimated volume calculations depend on data availability and quality. Independent testing and risk assessment are required.
ACKNOWLEDGMENT AND SOURCE
This implementation was developed with reference to technical study scripts, several of which contain copyright notices identifying raptoralgo under the Mozilla Public License 2.0. These notices are acknowledged. The source implementation is intended for open-source publication subject to verification of all applicable reuse rights.
Trading involves financial risk. The indicator is intended for research and technical chart analysis.
OVERVIEW
DrFX God Mode X is an overlay indicator combining trend context, confirmed market structure, directional momentum, higher-timeframe filters, volume-based estimates, and visual risk-reference levels in one chart interface.
The indicator provides separate bullish and bearish rule-agreement scores from 0 to 100. These scores summarize weighted technical conditions and do not represent probabilities of success or historical win rates.
SIGNAL GENERATION
Signals are based on qualifying EMA crosses, confirmed structure breaks, or fair value gaps, together with trend alignment and configurable confluence thresholds. Signals and alerts are confirmed at candle close. Live dashboard readings can change before the candle closes.
MARKET STRUCTURE AND PRICE ZONES
The indicator identifies confirmed swing breaks, BOS and CHoCH events, swing-level sweeps, three-candle fair value gaps, and simplified supply and demand zones. Pivot confirmation introduces delay. Liquidity and supply/demand labels describe price patterns and do not verify actual institutional orders or executions.
VOLUME ANALYSIS
The optional volume distribution approximates volume concentration by allocating reported candle volume across its high-low range. The estimated point of control and value area are not exchange-native volume-at-price measurements. Directional volume flow is an OHLCV-derived estimate, not actual bid/ask delta.
HIGHER-TIMEFRAME FILTERS
Two configurable filters use previously completed higher-timeframe candles. A filter is inactive when its selected timeframe is not greater than the chart timeframe.
RISK REFERENCES
The indicator may draw a reference entry at the confirmed signal candle close, an ATR-based stop, and configurable reward-to-risk targets. These are hypothetical analytical levels, not executable orders, guaranteed fills, or trading performance results.
VISUAL DASHBOARD
The dashboard summarizes market regime, bullish and bearish confluence, trend, momentum, structure, relative volume, higher-timeframe direction, and visual risk levels. Its dynamic visual elements update only when Pine Script executes on chart updates; independent continuous animation is not supported.
HOW TO USE
Add the indicator to a candlestick chart. Adjust the higher-timeframe inputs to intervals above the chart timeframe. Review scores together with structure, momentum, volatility, and volume context. Configure alerts for confirmed signals if desired. All visual modules can be adjusted through indicator settings.
LIMITATIONS
This is a rule-based indicator, not an automated trading strategy. No verified profitability, historical win rate, or future performance claim is provided. Pivot confirmation introduces delay, live dashboard values may fluctuate, and estimated volume calculations depend on data availability and quality. Independent testing and risk assessment are required.
ACKNOWLEDGMENT AND SOURCE
This implementation was developed with reference to technical study scripts, several of which contain copyright notices identifying raptoralgo under the Mozilla Public License 2.0. These notices are acknowledged. The source implementation is intended for open-source publication subject to verification of all applicable reuse rights.
Trading involves financial risk. The indicator is intended for research and technical chart analysis.

Exención de responsabilidad
La información y las publicaciones no constituyen, ni deben considerarse como, asesoramiento o recomendaciones financieras, de inversión, de trading u otro tipo, proporcionadas o respaldadas por TradingView. Obtenga más información en Condiciones de uso.
Exención de responsabilidad
La información y las publicaciones no constituyen, ni deben considerarse como, asesoramiento o recomendaciones financieras, de inversión, de trading u otro tipo, proporcionadas o respaldadas por TradingView. Obtenga más información en Condiciones de uso.