Range Boundary Retirement Audit
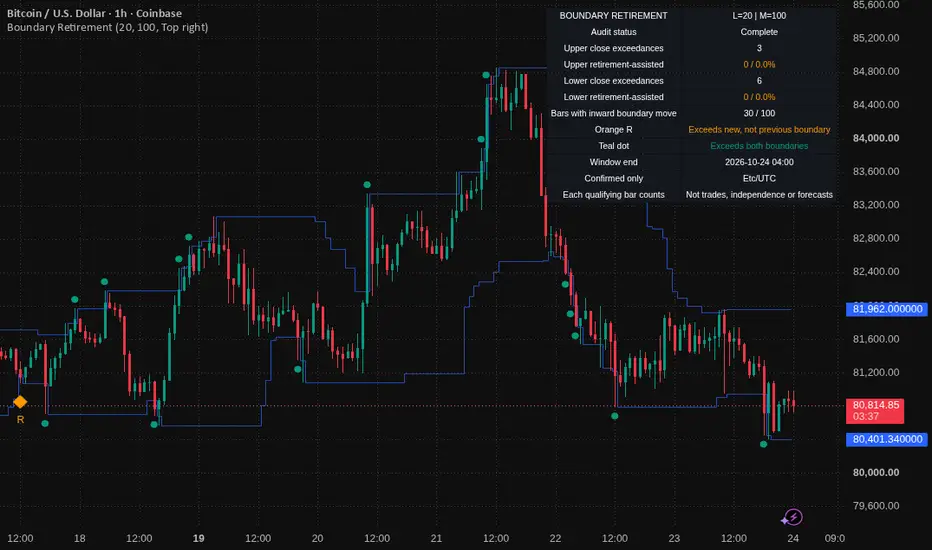
A close can exceed a rolling range after an old extreme drops out of the lookback. That close really did move beyond the current threshold, but it may still be inside the threshold that existed one bar earlier. This indicator makes that distinction visible instead of treating all range exceedances as equivalent.
WHAT IT MEASURES
For a test bar t and lookback L, the upper boundary is the highest high of bars t-L through t-1; the lower boundary is the lowest low of those same prior bars. The test bar's own high and low are excluded. The previous boundaries use the preceding window, t-L-1 through t-2.
An upper exceedance requires the confirmed close to be strictly above the current upper boundary. It is labeled retirement-assisted when that close is not above the previous upper boundary. The lower test is symmetric: the confirmed close is strictly below the current lower boundary but not below the previous lower boundary. Equality with the current boundary is not an exceedance; equality with the previous boundary belongs to the retirement-assisted category.
For example, suppose the previous upper boundary was 110, the refreshed upper boundary is 105 because the old high retired, and the test bar closes at 107. The current threshold is exceeded, but the previous threshold is not. This receives an orange R. A close at 111 clears both thresholds and receives a teal dot. Neither classification says whether the next price move will continue or reverse.
HOW TO READ THE CHART
- Blue steps: the prior-L upper and lower boundaries.
- Orange R diamonds: confirmed closes exceeding the refreshed boundary but not the previous boundary.
- Small teal dots: confirmed closes exceeding both boundaries.
- The table counts upper/lower exceedances separately over M completed test bars and shows retirement-assisted counts and shares. Each share uses its same-direction exceedance count as the denominator, not all M bars. When there are no such exceedances, the share is undefined, shown as n/a.
- "Bars with inward boundary move" counts bars where either the upper boundary moved down or the lower boundary moved up. The total range can still widen if the other boundary moves outward more.
Every qualifying close counts, including consecutive qualifying bars. These are not trades, distinct episodes or statistically independent observations. L controls the range horizon; M controls only the summary window. The default settings are L=20 and M=100. Both can be changed from 1 to 500. The display toggles affect presentation, not the underlying diagnostic values available in the Data Window and chart-data export.
METHODOLOGY AND CONTRIBUTION
Rolling highest/lowest boundaries follow the established Donchian channel construction; this script does not claim to invent them. Its contribution is the paired-window retirement test, directional attribution counts and exportable diagnostics around those boundaries, implemented as a self-contained educational audit rather than another breakout entry system. It complements an outcome study by explaining how the threshold changed before asking what happened afterward.
The exported net-retirement amounts are max(previous upper - current upper, 0) and max(current lower - previous lower, 0). Net-expansion amounts use the reverse differences. These are price-unit boundary changes, not volume, buying/selling pressure, gross constituent turnover or economic causality. Tied extrema that remain in the window prevent a boundary contraction.
CONFIRMATION AND LIMITATIONS
Only confirmed bars produce plots, markers and table updates. The forming bar is excluded. There are no future references, negative offsets or higher-timeframe requests. At least L+2 consecutive valid OHLC bars are required for a classified observation, and the table needs a complete M-observation window; it does not silently shorten a window or skip malformed/missing bars. The table's window end is the last audited bar's close time in the exchange time zone. Its last confirmed result remains displayed while the next bar forms.
Use standard time-based candles or bars. Synthetic, tick and range charts are rejected. L counts available chart bars, not elapsed clock time: overnight gaps and weekends are not inserted as missing bars. Feed corrections, adjusted price history, changed sessions and changed inputs can change historical results. This is a descriptive indicator, not a strategy, probability estimate, profitability claim or recommendation to trade. "Retirement-assisted" does not mean price was unchanged, the breakout was false, or the move is less likely to succeed. The current boundary includes the preceding bar's high/low, so an unchanged preceding close cannot by itself create a strict exceedance.
TESTING
Compiled and exercised in TradingView Pine v6 on AAPL daily and Coinbase BTCUSD 1-minute and 1-hour standard candles. Exported diagnostics were checked against an independent OHLC reference, including L/M=1/1 and 500/500 as well as 20/100. Confirmed BTC minute outputs were compared across a new bar and a reload; the shared completed-bar values were unchanged, and the forming bar remained excluded. The Heikin-Ashi rejection was also exercised. Separate mathematical tests covered ties, flat and negative prices, missing/malformed OHLC, and window boundaries. These are correctness checks, not evidence of a trading edge.
WHAT IT MEASURES
For a test bar t and lookback L, the upper boundary is the highest high of bars t-L through t-1; the lower boundary is the lowest low of those same prior bars. The test bar's own high and low are excluded. The previous boundaries use the preceding window, t-L-1 through t-2.
An upper exceedance requires the confirmed close to be strictly above the current upper boundary. It is labeled retirement-assisted when that close is not above the previous upper boundary. The lower test is symmetric: the confirmed close is strictly below the current lower boundary but not below the previous lower boundary. Equality with the current boundary is not an exceedance; equality with the previous boundary belongs to the retirement-assisted category.
For example, suppose the previous upper boundary was 110, the refreshed upper boundary is 105 because the old high retired, and the test bar closes at 107. The current threshold is exceeded, but the previous threshold is not. This receives an orange R. A close at 111 clears both thresholds and receives a teal dot. Neither classification says whether the next price move will continue or reverse.
HOW TO READ THE CHART
- Blue steps: the prior-L upper and lower boundaries.
- Orange R diamonds: confirmed closes exceeding the refreshed boundary but not the previous boundary.
- Small teal dots: confirmed closes exceeding both boundaries.
- The table counts upper/lower exceedances separately over M completed test bars and shows retirement-assisted counts and shares. Each share uses its same-direction exceedance count as the denominator, not all M bars. When there are no such exceedances, the share is undefined, shown as n/a.
- "Bars with inward boundary move" counts bars where either the upper boundary moved down or the lower boundary moved up. The total range can still widen if the other boundary moves outward more.
Every qualifying close counts, including consecutive qualifying bars. These are not trades, distinct episodes or statistically independent observations. L controls the range horizon; M controls only the summary window. The default settings are L=20 and M=100. Both can be changed from 1 to 500. The display toggles affect presentation, not the underlying diagnostic values available in the Data Window and chart-data export.
METHODOLOGY AND CONTRIBUTION
Rolling highest/lowest boundaries follow the established Donchian channel construction; this script does not claim to invent them. Its contribution is the paired-window retirement test, directional attribution counts and exportable diagnostics around those boundaries, implemented as a self-contained educational audit rather than another breakout entry system. It complements an outcome study by explaining how the threshold changed before asking what happened afterward.
The exported net-retirement amounts are max(previous upper - current upper, 0) and max(current lower - previous lower, 0). Net-expansion amounts use the reverse differences. These are price-unit boundary changes, not volume, buying/selling pressure, gross constituent turnover or economic causality. Tied extrema that remain in the window prevent a boundary contraction.
CONFIRMATION AND LIMITATIONS
Only confirmed bars produce plots, markers and table updates. The forming bar is excluded. There are no future references, negative offsets or higher-timeframe requests. At least L+2 consecutive valid OHLC bars are required for a classified observation, and the table needs a complete M-observation window; it does not silently shorten a window or skip malformed/missing bars. The table's window end is the last audited bar's close time in the exchange time zone. Its last confirmed result remains displayed while the next bar forms.
Use standard time-based candles or bars. Synthetic, tick and range charts are rejected. L counts available chart bars, not elapsed clock time: overnight gaps and weekends are not inserted as missing bars. Feed corrections, adjusted price history, changed sessions and changed inputs can change historical results. This is a descriptive indicator, not a strategy, probability estimate, profitability claim or recommendation to trade. "Retirement-assisted" does not mean price was unchanged, the breakout was false, or the move is less likely to succeed. The current boundary includes the preceding bar's high/low, so an unchanged preceding close cannot by itself create a strict exceedance.
TESTING
Compiled and exercised in TradingView Pine v6 on AAPL daily and Coinbase BTCUSD 1-minute and 1-hour standard candles. Exported diagnostics were checked against an independent OHLC reference, including L/M=1/1 and 500/500 as well as 20/100. Confirmed BTC minute outputs were compared across a new bar and a reload; the shared completed-bar values were unchanged, and the forming bar remained excluded. The Heikin-Ashi rejection was also exercised. Separate mathematical tests covered ties, flat and negative prices, missing/malformed OHLC, and window boundaries. These are correctness checks, not evidence of a trading edge.

Exención de responsabilidad
La información y las publicaciones no constituyen, ni deben considerarse como, asesoramiento o recomendaciones financieras, de inversión, de trading u otro tipo, proporcionadas o respaldadas por TradingView. Obtenga más información en Condiciones de uso.
Exención de responsabilidad
La información y las publicaciones no constituyen, ni deben considerarse como, asesoramiento o recomendaciones financieras, de inversión, de trading u otro tipo, proporcionadas o respaldadas por TradingView. Obtenga más información en Condiciones de uso.