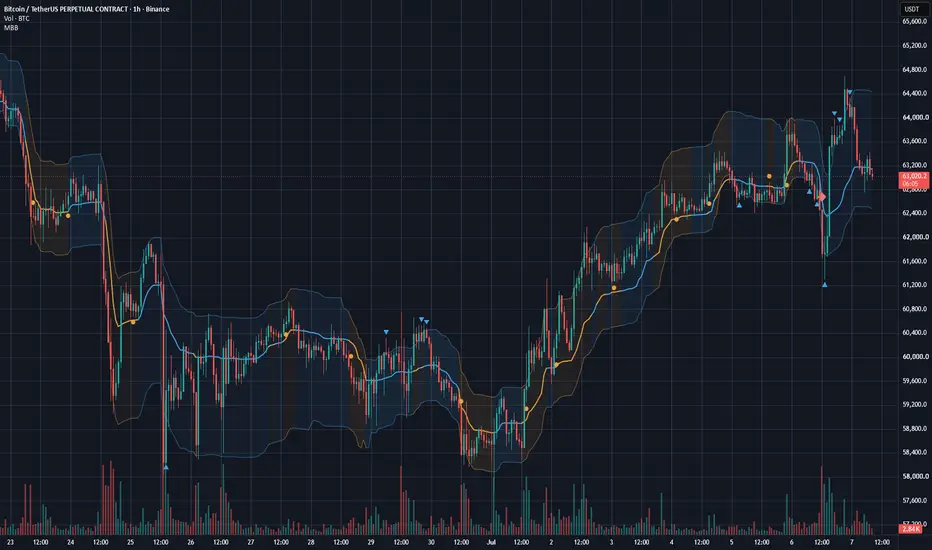
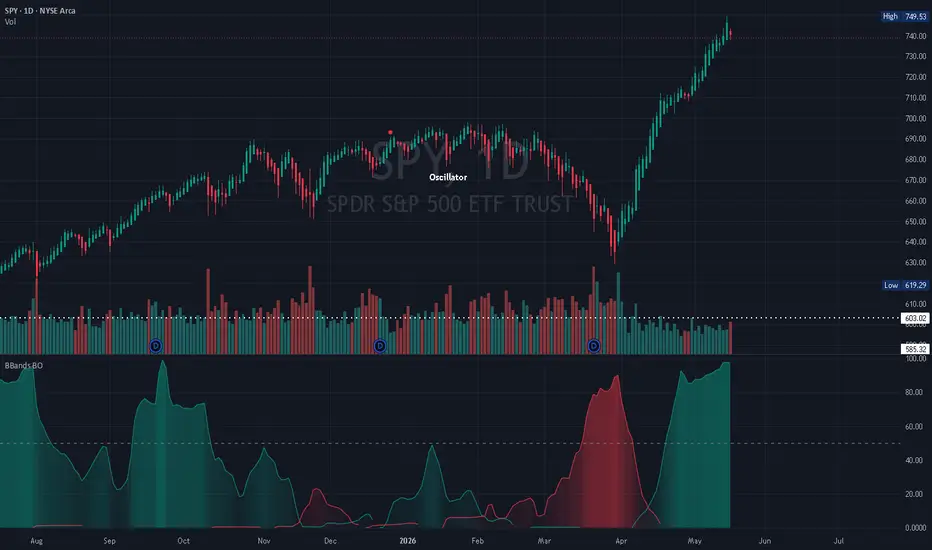
SMI + Bollinger Bands## SMI + Bollinger Bands
SMI + Bollinger Bands is an overlay indicator that projects the Stochastic Momentum Index directly into the price space defined by Bollinger Bands.
Traditional SMI indicators are displayed in a separate oscillator pane. This script instead transforms the SMI value into a price-relative flow line, allowing momentum, volatility, and price structure to be viewed together on the main chart.
### Core concept
The indicator calculates two related systems:
1. A standard Bollinger Band structure based on a configurable moving average and standard deviation.
2. A double-smoothed Stochastic Momentum Index calculated from the relationship between the closing price and its recent high-low range.
The SMI is then normalized using the selected SMI Threshold and projected around the Bollinger basis:
* An SMI value equal to the positive threshold aligns with the primary upper Bollinger Band.
* An SMI value equal to the negative threshold aligns with the primary lower Bollinger Band.
* Values between the thresholds appear inside the primary Bollinger range.
* Momentum exceeding the threshold can extend beyond the primary bands and into the optional extended-band zones.
This projection makes it possible to compare momentum behavior directly with current price and volatility rather than interpreting an oscillator in a separate pane.
### Plotted elements
**Bollinger basis**
The center line of the Bollinger structure. The moving-average type can be selected from SMA, EMA, SMMA/RMA, WMA, or VWMA.
**Primary Bollinger Bands**
The upper and lower volatility boundaries calculated from the selected standard-deviation multiplier.
**Extended Bollinger Bands**
Optional outer volatility zones using a separately configurable standard-deviation multiplier. These areas can help visualize unusually extended price or momentum conditions.
**SMI Flow**
The yellow line represents the projected Stochastic Momentum Index. Its position shows where momentum currently sits relative to the Bollinger structure.
**SMI Flow-Base**
The white line is an EMA-smoothed version of the projected SMI Flow. It provides a slower reference line that can be used to observe momentum direction, compression, expansion, and crossings.
### Inputs
**Bollinger Band settings**
* Length: Lookback period used for the Bollinger basis and standard deviation.
* Basis MA Type: Moving-average calculation used for the basis.
* Source: Price source used for the Bollinger calculations.
* StdDev: Multiplier used for the primary Bollinger Bands.
* Extended StdDev: Multiplier used for the optional outer bands.
* Use Extended Bands: Enables or disables the extended volatility zones.
**SMI settings**
* %K Length: Lookback period used to determine the recent high-low momentum range.
* %D Length: Double-EMA smoothing applied during the SMI calculation.
* EMA Length: Smoothing applied to the projected SMI Flow-Base line.
* SMI Threshold: Defines which positive and negative SMI values align with the primary upper and lower Bollinger Bands.
### General interpretation
The indicator is intended as a visual analysis framework rather than a standalone entry system.
Traders may use it to study:
* Momentum changes relative to volatility.
* SMI Flow and Flow-Base crossings.
* Momentum expansion beyond the primary bands.
* Momentum rejection from extended zones.
* Divergence between price movement and projected momentum.
* Compression around the Bollinger basis.
* Confluence with trend, structure, volume, support, resistance, or other analysis.
A movement outside a band does not automatically indicate a reversal. Strong trends can remain extended, and crossings can occur repeatedly during sideways or volatile conditions. Market context and risk management remain necessary.
### Calculation behavior
This script does not use future data, lookahead calculations, or higher-timeframe requests. Values on the active candle may continue changing as the candle’s high, low, and close update. Historical values are finalized after their respective candles close.
### Disclaimer
This indicator is provided for research, education, and chart analysis. It does not provide guaranteed trade signals, financial advice, or predictions of future market performance. Users are responsible for independently evaluating all trading decisions and managing their own risk.
Indicador

Buy/Sell Signals [WynTrader]Buy/Sell Signals
Hello dear Friend
Here is my Buy/Sell Signals indicator that may help you easily run a Buy/Sell backtest Strategy, seeing, at a glance, performance results.
█ OVERVIEW
This indicator identifies trend changes and generates Buy/Sell signals as accurately as possible. Its strength lies in the results Table, which lets you evaluate signal performance directly on the chart — compared to a simple Buy & Hold strategy — without running a full backtest.
█ CONCEPTS
This Buy/Sell Signals , compared to other tools that detect trend shifts, is simple, easy to use, and demonstrates its efficiency on its own, at a glance.
The Table results allow you to quickly evaluate signal performance, both on their own and compared to a Buy & Hold strategy. The Table calculations are fully s ynchronized with the visible chart (WYSIWYG – What You See Is What You Get). You can also scroll the chart across different date ranges to see how a stock or product performs under various market conditions.
You can adjust the variables to suit your goals. The design is simple, with clear parameters and instant readability of Buy/Sell Signals on the chart and in the Table results, without complex interpretation needed.
A Table shows the effectiveness of the signals on the current visible chart, providing immediate, realistic feedback performance. The Buy & Hold strategy results are also included for comparison with the Buy/Sell swing strategy. The Buy & Hold results start from the first Buy signal to ensure a fair comparison. Changing the parameters instantly updates the Table, giving a quick, immediate performance check.
█ FILTERS (Buy/Sell parameters)
This indicator generates Buy/Sell signals using optional and adjustable filters:
- Bollinger Bands Lookback Trend Filter
- High-Low vs Candle Range Threshold %
- Distance from Fast and Slow MAs Threshold %
Results are displayed in a Table on the chart, based on the currently visible start and end dates.
█ TABLE RESULTS (Buy/Sell signals performance)
The Results Calculation presented in the Table is based on the Current Chart Visible Range . The Table shows the:
- Calculation Results of the Buy and Sell Signals activated on the chart
- Number of Trades (Signals)
- Winning Points
- Win Rate %
The Buy & Hold calculation starts at the first Buy encountered.
█ CAUTION
The Graal Indicator, even with AI, doesn't exist yet — maybe one day, but not now — depending on the chart product, volatility, probabilities, and unpredictable market behaviour. Don't rely on this tool to make trade decision, it's only a tool to, maybe, help assess a change of trend.
Seeing Buy/Sell signals on a chart is appealing, but assessing their performance in a Table makes it even more convincing — and without running a full backtest, you get a clear overview of performance immediately.
█ WYNTRADER
My name is WynTrader. I cumulate 24 years of experience. In 2001, I took an intensive technical analysis course taught by an exceptional friend, Cyril, who taught me everything I know.
After testing thousands of TradingView indicators over these 24 years, I've found none to be 100% accurate all the time. This Buy/Sell Signals indicator may outperform some others but is still not perfect. So, just be aware, and don't be fooled by this tool.
Enjoy!
WynTrader Indicador

Modern Bollinger Bands [GBB]Modern Bollinger Bands
I rebuilt Bollinger Bands. Not because the original is bad, John Bollinger's work has held up for forty years, but because the defaults everyone uses were designed for daily stock charts in the 1980s and we're putting them on crypto perps at 3am.
WHAT'S WRONG WITH THE CLASSIC
Five things, in my view.
The window is always 20 bars. Doesn't matter if the market is in a fast news week or a dead summer range, you get the same 20.
The bands assume returns follow a bell curve. Asset returns have fat tails, so price pokes outside a two sigma band far more often than the theory says it should.
A band touch has no meaning on its own. In a range, fading the touch works okay. In a trend, price walks down the band and runs over every single fade. The classic gives you nothing to tell those two situations apart, and that's the flaw that costs people real money.
The SMA basis is slow. Equal weight on every bar means the middle line describes the market as it was roughly ten bars ago.
And band width isn't comparable to anything. What counts as narrow on one chart means nothing on another, so squeeze thresholds end up being eyeballed.
WHAT I CHANGED
The length adapts. An Ehlers homodyne discriminator measures the dominant cycle in price and the window becomes half of it, between 10 and 50 bars. When there's no measurable cycle because the market is trending too hard, the length freezes at the last good value instead of guessing.
The basis is a KAMA instead of SMA. It speeds up when price is actually going somewhere and almost stops updating in chop.
The bands are percentile bands, not sigma bands. 97.5th and 2.5th percentile of the real deviations around the basis, nearest rank, over a longer window. Your market's actual tails, not a textbook bell curve.
I added a regime filter: Kaufman efficiency ratio, percentile ranked against the last 252 bars, with 70/55 hysteresis so it doesn't flip flop on the boundary. Blue bands are RANGE, orange bands are TREND, and the signals respect the color.
And the squeeze is a score from 0 to 100. Percentile rank of band width against the last year of bars. A score of 8 reads the same on every symbol and every timeframe.
THE SIGNALS
Three types, that only trigger on candle close, so there is nothing repainted.
Singal1: Blue triangles. The classic fade, but only where it belongs. Price closes outside a band, the next bar closes back inside, and the regime is RANGE. In TREND this signal simply doesn't exist.
Singal2: Orange circles. Trend pullback. Price dips into a zone around the basis, then closes back in the trend direction. TREND only and with the trend only. One thing about the chart markers: in a long trend this setup can fire on several nearby bars, so the chart draws the first circle of a cluster and skips the repeats for a few bars, so the chart does not get too cluttered.
Signal3: Diamonds. Squeeze release after at least 5 bars of squeeze, then the squeeze ends and price closes outside a band on that same bar. Important: While this is the most intuitive setup of the three and it's the one my testing supports least. Release events showed the same forward 20 bar volatility as typical bars from the same hours. Volume confirmation didn't help either, I tested that separately. The diamonds mark a real event, compression ended and price left the bands, but whether that's worth anything is a question my data answered with no. I included the signal and alert for it anyway, because I know many of you will want it.
SETTINGS
Everything above is a toggle. The groups match the settings dialog, so here's what each one actually does and when you'd touch it.
Adaptive length: Length mode switches between Adaptive and Fixed. Adaptive is the point of this indicator. Fixed with the default of 20 exists for two reasons: reproducing the classic, and for people who want to trust their own number. The fixed length input only matters in Fixed mode.
Basis / bands: Basis picks KAMA or SMA for the middle line, bands picks Robust (percentile) or Stdev (classic sigma). Set Fixed 20 plus SMA plus Stdev and you have exact 1980s Bollinger Bands, that combination is deliberately supported. The stdev multiplier (2.0) only applies in Stdev mode. The robust percentiles (97.5 and 2.5) set where the bands sit in the deviation distribution, pull them toward 95/5 if you want more touches and more signals, push them out if you want only the extremes. The robust window multiplier and floor control how much history the percentile estimate uses, 4 times the adaptive length with a floor of 80 bars by default. Shorter windows react faster to volatility shifts but the tail estimates get noisy, I would leave these alone unless you know why you're changing them. KAMA fast and slow (2 and 30) are the standard Kaufman speeds, the basis moves between a 2 period and a 30 period EMA depending on how efficient the move is.
Regime / squeeze: KER length (20) is the window for the efficiency ratio itself. The percentile rank window (252) is what "recent history" means for both the regime and the squeeze score, about one year of daily bars, about ten days on 1h. TREND enter (70) and TREND exit (55) are the hysteresis levels: the market has to rank above the 70th percentile in efficiency to be called TREND and drop back below the 55th to be called RANGE again. Widen the gap and the regime switches less often but later, narrow it and you get earlier calls with more flip flops. These defaults sat on a flat plateau in sensitivity testing, meaning nearby values gave nearly identical results, so there's no magic in 70/55, but there's also nothing to gain from tuning them. Squeeze threshold (20) defines squeeze as band width below the 20th percentile, and min bars in squeeze (5) stops one bar dips from counting as compression.
Signals: One input, the S2 touch fraction (0.25). It sets how close to the basis a pullback has to come, measured as a fraction of the band halfwidth. Smaller means stricter pullbacks and fewer S2 signals.
Display: Clean display preset strips everything down to the three lines, no fill, no markers, no panel. The info panel (regime, KER percentile, adaptive length with its frozen flag, squeeze score, last signal) is off by default, turn it on when you want to see what the indicator is "thinking". Signal markers and the squeeze heat on the band fill can be switched off separately. The S2 marker debounce (5) is the cosmetic cluster filter from the signals section, set it to 0 if you want every circle drawn.
Parity: You can ignore this group for trading. It pins the computation start to a fixed timestamp so every value on the chart can be reproduced bar for bar against a Python reference implementation. It's how the validation was done and it stays in so anyone can check my work.
ALERTS
Six per signal alerts plus the combined JSON one with symbol, timeframe, signal, regime, squeeze score and band levels. Once per confirmed bar close, built for webhook bots.
No indicator prints money, this one included. It tells you regime, structure and volatility state, with the evidence behind each part published, nulls and all. Trade safe. Indicador

Indicador

Reversion Setup - Bollinger Bands + RSI Live Dashboard📊 REVERSION SETUP — Bollinger Bands + Live RSI Dashboard
A focused mean-reversion tool combining Bollinger Bands with a real-time
RSI dashboard — built to spot potential reversal zones without cluttering
your chart or burning extra indicator slots.
✅ Bollinger Bands — fully configurable (period, deviation, source, color)
✅ Live RSI Dashboard — current RSI value, overbought/oversold levels,
and real-time alert status, shown in a clean table instead of a
separate pane
🎯 WHY THIS COMBO
Bollinger Bands highlight when price stretches to a statistical extreme,
while the RSI dashboard confirms whether momentum actually backs up that
move. When price tags a band AND RSI flags overbought/oversold at the
same time, that's your reversion signal — two confirmations, one chart.
🔧 FULLY CONFIGURABLE
— Adjust Bollinger period, deviation, source, and color
— Set your own RSI period and overbought/oversold levels
— Adjust dashboard text size
💡 HOW IT WORKS
The RSI dashboard updates live as new candles form, showing:
— Current RSI value
— Upper/Lower band levels
— Alert status (Overbought ↑ / Oversold ↓ / Neutral →)
🔗 PAIRS WELL WITH
Check out my Trend Setup (EMA 50/100/200 + RSI Dashboard) for the
trend-following counterpart to this mean-reversion tool.
💬 Suggestions for the next setup? Drop a comment below — more tools
coming based on community feedback.
If this helped your charts, a like goes a long way 🙏 Indicador

RSI Pattern Matcher & Forward ProjectionRSI Pattern Matcher & Forward Projection is an advanced RSI-based analysis tool
that combines historical pattern matching, statistical forward projection,
Bollinger Bands, and an EMA overlay — all applied directly on the RSI panel.
Instead of using RSI as a simple overbought/oversold indicator, this script
treats the RSI as a pattern signal. It scans hundreds of historical bars to find
past moments where RSI behavior and price direction closely matched the current
market structure, then statistically projects what RSI is most likely to do next.
### How It Works
The indicator builds a fingerprint of the current market using the last N bars
(Pattern Length), capturing:
- RSI value for each bar in the window
- Price direction per bar (rising, falling, or flat)
It then scans the full lookback window and marks a historical bar as a match when:
- Each RSI value falls within the defined tolerance (e.g. ±4 points per bar)
- At least 60% of the price direction steps align with the current pattern
Once matches are collected, the script averages what happened to RSI over the
following bars after each match. This averaged path is rendered as a step-by-step
dashed projection line extending to the right of the last bar.
Bollinger Bands (length 14, multiplier 2.0) and EMA 12 are computed on the RSI
itself — not on price. Both indicators are also extended forward by the same
projection length using linear slope extrapolation, giving a complete forward
context for the RSI forecast.
### What It Displays
RSI Line — main aqua line (standard RSI)
RSI EMA 12 — orange line tracking the short-term RSI average; crossovers
signal early momentum shifts
Bollinger Bands on RSI:
• Yellow middle band (SMA 14)
• Red upper band (overbought pressure zone)
• Green lower band (oversold pressure zone)
• Gray fill between bands
Forward Projection (dashed lines extending beyond last bar):
• RSI forecast path — averaged from historical analogs, color-coded by zone
• BB Upper extension — red dashed
• BB Lower extension — green dashed
• BB Basis extension — yellow dashed
• EMA 12 extension — orange dashed
Live RSI Label — current RSI value displayed next to the last bar,
color-coded in real time (red ≥ 70, green ≤ 30, aqua otherwise)
Forecast Label — projected RSI value shown at the end of the forward window
Info Table (top right):
• Matches found vs maximum
• Dominant directional bias (Up / Down / Flat)
• Direction distribution percentages
• Average, best-case, and worst-case price change across all matches
• Estimated RSI value N bars ahead
• Confidence score based on match count
### Confidence Score
≥ 10 matches → 90%
≥ 7 matches → 75%
≥ 5 matches → 60%
≥ 3 matches → 40%
< 3 matches → 20%
A warning is displayed on the table when fewer than 3 matches are found.
In this case, increase RSI Tolerance or Lookback to find more historical analogs.
### Inputs
RSI Period — RSI calculation length (default: 14)
RSI Source — price input for RSI (default: close)
Pattern Length — bars used to build the current pattern fingerprint (2–20, default: 3)
Projection Length — bars ahead to project all forward lines (1–20, default: 3)
RSI Tolerance — max RSI difference per bar allowed when matching (±0.5–10, default: ±4.0)
Lookback — historical bars to scan for matches (50–999, default: 500)
Max Matches — maximum historical matches to average (3–20, default: 10)
### How To Use
1. Add the indicator to any chart — it plots on a separate RSI panel
2. Check the info table for match count; if below 3, raise RSI Tolerance or Lookback
3. Read the dominant direction and confidence score for a quick bias assessment
4. Follow the dashed projection line to see where RSI is historically likely to go
5. Use the extended BB bands to anticipate whether RSI may reach overbought or
oversold territory within the projection window
6. Watch the EMA extension — if the projected RSI crosses above or below the
extended EMA, it can signal a momentum shift ahead
7. Compare the forecast RSI label against the 70 and 30 levels for reversal context
8. Use best-case and worst-case % change figures to frame risk/reward expectations
9. Higher timeframes (1H, 4H, Daily) generally produce cleaner RSI patterns
and more meaningful matches
### Best Used For
- Anticipating RSI direction before price confirms
- Identifying overbought/oversold exhaustion using historical analogs
- Spotting early momentum shifts via RSI EMA crossovers
- Using BB band position to contextualize RSI extremes
- Filtering trade entries with forward projection confluence
- Multi-layer RSI analysis combining pattern matching, bands, and trend
### Originality
This script combines four independent analytical layers into a single RSI panel:
a historical analog pattern matcher, a statistical forward projection engine,
Bollinger Bands applied to RSI (not price), and a linear slope extrapolation
system for all forward indicators. The specific combination — simultaneous RSI
and price direction fingerprinting, 60% direction alignment threshold, per-bar
averaged projection, and slope-based BB/EMA extension — represents the author's
own approach to making RSI forecasting both visual and statistically grounded.
### Disclaimer
This indicator is for educational and analytical purposes only. Pattern matching
based on historical RSI behavior does not guarantee future results. Past analogs
may not repeat. Always apply proper risk management and combine this tool with
additional analysis before making any trading decisions.
Short Description:
Scans historical RSI and price direction patterns to project the most likely RSI
path forward. Includes Bollinger Bands and EMA on RSI, full forward extension of
all indicators, directional bias stats, and a confidence score. Indicador

Indicador

Estrategia

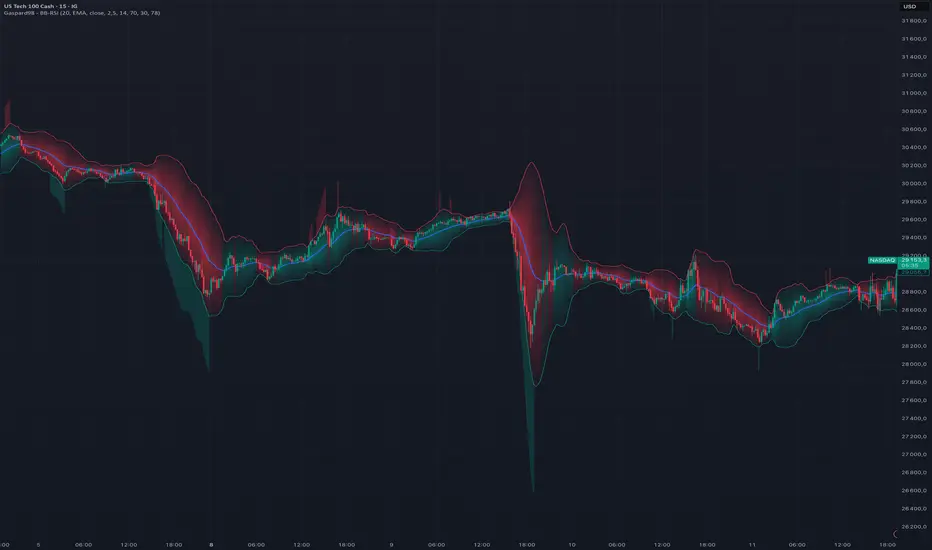
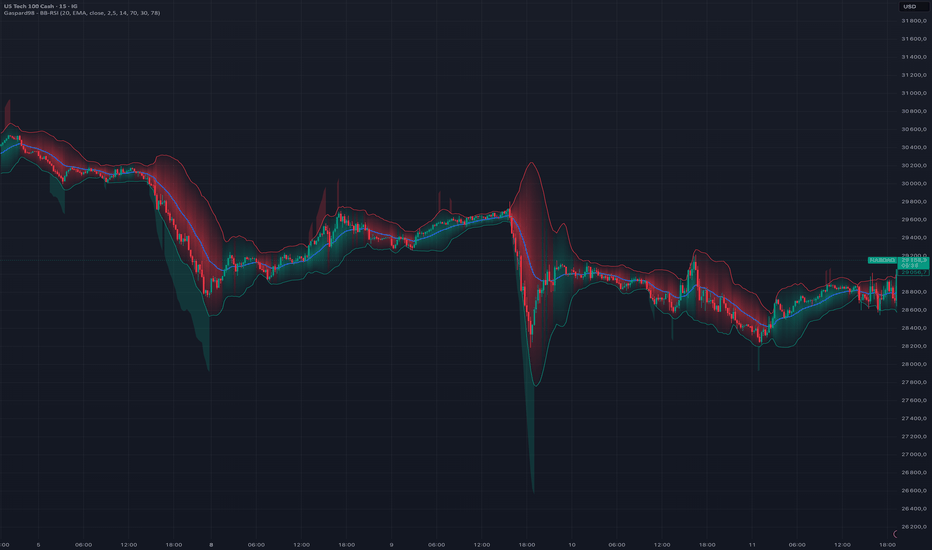
Gaspard98 - Bollinger Bands - RSI# Gaspard98 — Bollinger Bands · RSI
**Bollinger Bands reimagined: a dynamic trend background painted inside the bands, and overbought/oversold RSI readings projected directly outside them.**
---
## Overview
This indicator takes the classic Bollinger Bands and adds two layers of visual reading designed to help you decide faster, without leaving the price chart:
1. **A dynamic trend background** painted *only inside* the bands (between the upper band, the basis, and the lower band). Its color shows the bias (bullish / bearish) and its **intensity changes in real time** with the strength of the move.
2. **Overbought / oversold (RSI) zones** projected *above and below* the bands, lighting up only when the RSI crosses its thresholds. This lets you combine volatility (Bollinger) and momentum (RSI) at a single glance, without a separate oscillator at the bottom of the screen.
The goal: keep the readability of a clean chart while making the context (trend + momentum extremes) immediately obvious.
---
## The concept
Bollinger Bands measure volatility around a moving average, but on their own they say nothing about either **directional bias** or **momentum state**. This tool fills both gaps directly on the overlay:
- **Trend** — price above the basis = bullish context; below = bearish context. The background turns this bias into color.
- **Strength** — the further price moves from the basis relative to current volatility, the denser the background — a sign that a push is either fading or accelerating.
- **Momentum extremes** — the RSI flags overbought/oversold zones. Instead of a separate panel, the information is brought back onto the price, exactly where it matters.
---
## How it works
### 1. Bollinger Bands
Basis = a moving average (SMA, EMA, SMMA/RMA, WMA or VWMA, your choice). The upper and lower bands sit at `± StdDev × standard deviation` from the basis. Standard settings: length 20, multiplier 2.0.
### 2. Dynamic trend background
The background is gradient-based: dense color at the basis, fading progressively toward each band, creating a "trend core" effect rather than a flat fill.
- **Green** when price is above the basis (bullish bias).
- **Red** when price is below it (bearish bias).
- In **dynamic intensity** mode, the background density is derived from `|price − basis| / standard deviation`. In practice: a trend that pushes hard produces a vivid background, a market reverting to its mean produces a more subdued one.
### 3. RSI OB/OS zones (outside the bands)
An RSI computed in the background triggers two colored zones projected outside the bands:
- **Red zone above the upper band** when the RSI reaches the **overbought** threshold.
- **Green zone below the lower band** when the RSI reaches the **oversold** threshold.
These zones only appear on the bars where the condition is met, making them a punctual marker rather than a permanent fill.
---
## Inputs
**Bollinger**
- *Length* — moving-average period (default 20).
- *Basis MA Type* — moving-average type: SMA, EMA, SMMA (RMA), WMA, VWMA.
- *Source* — calculation source (default: close).
- *StdDev* — standard-deviation multiplier for band width (default 2.0).
**Trend**
- *Color inside the bands* — toggles the background on/off.
- *Dynamic intensity* — modulates density by strength; off = constant fill.
- *Bullish / Bearish* — customizable colors.
**RSI**
- *OB/OS zones outside bands* — toggles the zones on/off.
- *RSI Length* — RSI period (default 14).
- *Overbought (OB)* — upper threshold (default 70).
- *Oversold (OS)* — lower threshold (default 30).
- *Zone transparency* — opacity of the projections.
---
## How to use it
- **Read the context first.** A dense green background = bullish push underway; a background that pales as price returns toward the basis = loss of momentum / mean reversion.
- **Spot the extremes.** A red zone above the upper band (RSI overbought) while price tags that band signals possible exhaustion; the mirror logic applies to the green oversold zone.
- **Combine both signals.** The most telling context appears when background and RSI zone line up: for example, a bullish background that intensifies *without* triggering overbought suggests a healthy trend; a bullish background *with* clear overbought at the upper band calls for more caution.
Adapt the RSI thresholds and the multiplier to your instrument and timeframe. The defaults suit indices and CFDs on intraday timeframes but deserve tuning to the volatility of the underlying.
---
## Originality
Most Bollinger derivatives simply color the space between the bands or add crossover signals. Here, two specific ideas:
- The background is **bounded inside the bands** and **gradient-mapped around the basis**, with intensity indexed to volatility — not a binary solid fill, but a continuous reading of strength.
- The RSI zones are **projected outside the bands** rather than shown in a separate panel, fusing momentum and volatility onto a single reading plane.
---
## Disclaimer
This indicator is a market-reading and visualization tool. It does not constitute investment advice or a buy/sell recommendation. Past performance is not indicative of future results. You remain solely responsible for your decisions and your risk management.
---
*Published by Gaspard98. Feedback and suggestions welcome in the comments.* Indicador
BB Squeeze BreakoutBB Squeeze Breakout
Precision Breakout is a volatility compression and breakout indicator based on Bollinger Bands, Keltner Channels, momentum filters, volume confirmation, and ATR-based risk levels.
The goal of this tool is to help traders read when price is compressing, when volatility starts expanding again, and whether a breakout has enough confirmation to be considered stronger or weaker.
This indicator is not a trading system by itself. It is made to support chart reading and should be used together with market structure, support and resistance, liquidity zones, session context, and personal risk management.
────────────────────────────
MAIN IDEA
────────────────────────────
Markets often move through two phases:
1. Compression
Price contracts, Bollinger Bands become tighter, and the market prepares for a possible expansion.
2. Expansion
Price breaks outside the bands, volatility increases, and a directional move can start.
This script tracks those phases with:
- Bollinger Bands
- Keltner Channels
- Squeeze detection
- Bollinger Bandwidth
- %B position
- Candle quality
- RSI momentum
- Volume expansion
- OBV confirmation
- MFI confirmation
- A/D confirmation
- ADX trend strength
- MACD confirmation
- EMA trend filter
- ATR-based SL and TP levels
- A dashboard for quick reading
────────────────────────────
HOW THE SIGNALS WORK
────────────────────────────
A bullish breakout appears when price closes above the upper Bollinger Band for the required number of confirmation bars.
A bearish breakout appears when price closes below the lower Bollinger Band for the required number of confirmation bars.
The script then checks additional conditions such as candle body quality, momentum, volume, OBV slope, MACD behavior, ATR expansion, Bollinger Bandwidth expansion, and post-squeeze context.
The final signal depends on the confluence score and the selected filters.
A strong signal means that the breakout structure is present and the required confirmations are aligned.
A weak signal means that price broke outside the Bollinger Band, but the score or one of the active filters was not strong enough.
────────────────────────────
MINI TUTORIAL FOR BEGINNERS
────────────────────────────
1. Add the indicator to the chart.
2. Start with the default settings.
3. Look for a squeeze phase, where Bollinger Bands compress inside the Keltner Channel.
4. Wait for a squeeze release or a confirmed breakout outside the Bollinger Bands.
5. Check the dashboard:
- Squeeze: shows if compression is active.
- Post-SQ: shows if the market recently left a squeeze.
- BandWidth: shows if volatility is low or expanding.
- %B: shows where price is inside or outside the bands.
- SNIPER: shows the current confluence score.
- Signal: shows BUY, SELL, WEAK BUY, WEAK SELL, or WAIT.
6. If a signal appears, check if it agrees with the trend, support/resistance, and market structure.
7. Use the ATR-based Entry, SL, TP1, TP2, and TP3 levels as visual planning references.
8. Do not take a signal blindly. Always check the context before making a decision.
────────────────────────────
EXAMPLE CASES
────────────────────────────
Example 1: Bullish post-squeeze breakout
Price has been moving sideways, the Bollinger Bands are tight, and the squeeze is active. Then price closes above the upper Bollinger Band with a strong candle, rising volume, improving RSI, and expanding bandwidth. The dashboard shows a bullish score above the minimum threshold. A BUY label can appear, and the ATR risk levels show Entry, SL, TP1, TP2, and TP3.
Example 2: Bearish breakdown
Price loses support and closes below the lower Bollinger Band. RSI moves below 50, OBV weakens, MACD confirms downside pressure, and the candle closes near the low of its range. If the score and active filters agree, a SELL label can appear.
Example 3: Weak breakout
Price closes outside the Bollinger Band, but the candle is small, volume is not expanding, or momentum is weak. In this case, the script can show a WEAK signal instead of a confirmed one. This means the structure exists, but confirmation is not strong enough.
Example 4: Head fake
Price briefly breaks outside a band, then moves back inside the Bollinger structure. The script can mark this as a possible head fake. This helps identify failed breakouts, especially in choppy or low-volume markets.
Example 5: Band walk
During strong trends, price can continue moving along the upper or lower Bollinger Band. The script marks these band walk conditions to show possible trend continuation behavior.
────────────────────────────
INPUTS EXPLAINED
────────────────────────────
BOLLINGER BANDS
BB Length
Controls the moving average period used for the Bollinger Band basis. The default value is 20, which is the classic Bollinger setting.
BB StdDev
Controls the standard deviation multiplier used to build the upper and lower bands. The default value is 2.0, which is the common standard setting.
Neon Glow
Adds a visual glow effect around the Bollinger Bands.
Heat Zone
Colors the area between the Bollinger Bands depending on price position inside the band range.
────────────────────────────
KELTNER / SQUEEZE
Keltner Length
Controls the length used for the Keltner Channel calculation.
Keltner Mult
Controls the ATR multiplier used to build the Keltner Channel.
Show Keltner
Shows or hides the Keltner Channel on the chart.
Post-Squeeze Window
Defines how many bars after a squeeze release are still considered part of the post-squeeze phase.
Squeeze Ready Lookback
Looks back over a selected number of bars to detect when Bollinger Bandwidth is near a low-compression zone.
Show Squeeze Dots
Shows dots during squeeze conditions and squeeze release events.
────────────────────────────
BREAKOUT SIGNALS
Confirmation Bars
Defines how many consecutive closes outside the Bollinger Band are required before confirming a breakout.
Show BUY/SELL Labels
Shows or hides the main BUY and SELL labels.
Show Arrows
Shows or hides the arrow markers on the chart.
Show Tiny Info Labels
Shows or hides smaller labels such as weak signals and head fake warnings.
Head Fake Lookback
Controls how many bars are checked to detect a failed breakout after price moved outside a band.
Band Walk Bars
Controls how many bars are required to detect a band walk condition.
────────────────────────────
SNIPER ENGINE
Min Confluence Score
Sets the minimum score required for a confirmed signal. A higher value gives fewer signals but requires stronger confirmation.
Min Body/Range Ratio
Defines how large the candle body must be compared to the full candle range. This helps filter weak candles and dojis.
Close Must Be In Top/Bot %
For bullish candles, the close should be near the top of the range. For bearish candles, the close should be near the bottom of the range.
ATR Expansion Factor
Checks if current ATR is expanding compared to its average. This helps confirm volatility expansion.
Require Momentum Acceleration
Uses momentum behavior, mainly RSI acceleration, as part of the confirmation logic.
Require Volume Expansion
Uses volume expansion as part of the breakout quality reading.
Require BB Width Expansion
Checks if Bollinger Bandwidth is expanding during the breakout.
Anti-Wick Rejection Filter
Helps reject breakouts when the previous candle shows a strong wick against the breakout direction.
────────────────────────────
FILTERS
Use RSI Filter
Activates or disables RSI confirmation.
RSI Length
Controls the RSI calculation period.
Use OBV Filter
Activates or disables OBV confirmation.
Use Volume Spike Filter
Activates or disables volume spike confirmation.
Volume MA Length
Controls the moving average length used to compare current volume.
Volume Min x MA
Defines how much current volume must exceed the volume average.
Use MFI Filter
Activates or disables Money Flow Index confirmation.
MFI Length
Controls the MFI calculation period.
Use A/D Filter
Activates or disables Accumulation/Distribution confirmation.
Use ADX Filter
Activates or disables ADX trend strength confirmation.
ADX Length
Controls the ADX calculation period.
ADX Min
Defines the minimum ADX value required when the ADX filter is active.
Use MACD Filter
Activates or disables MACD confirmation.
Use EMA Trend Filter
Activates or disables EMA trend confirmation.
EMA Fast
Controls the fast EMA length.
EMA Slow
Controls the slow EMA length.
────────────────────────────
RISK MANAGEMENT
Show SL / TP
Shows or hides Entry, Stop Loss, and Take Profit levels.
Show SL/TP Zones
Shows or hides the colored risk and target zones.
Show SL/TP Labels
Shows or hides the Entry, SL, TP1, TP2, and TP3 labels.
SL ATR x
Controls the ATR multiplier used to calculate the Stop Loss distance.
TP1 ATR x
Controls the ATR multiplier used to calculate the first Take Profit level.
TP2 ATR x
Controls the ATR multiplier used to calculate the second Take Profit level.
TP3 ATR x
Controls the ATR multiplier used to calculate the third Take Profit level.
Enable TP3
Shows or hides the third Take Profit level.
RM Label Offset Bars
Moves the risk management labels slightly to the right of the current price area. The labels and zones update automatically as new candles appear.
────────────────────────────
DASHBOARD
Show Dashboard
Shows or hides the dashboard panel.
Position
Moves the dashboard to the selected chart corner.
High Contrast Panel
Makes the dashboard easier to read with stronger background contrast.
────────────────────────────
VISUAL ELEMENTS
────────────────────────────
The indicator can display:
- Bollinger Bands
- Bollinger glow effect
- Heat zone between bands
- Keltner Channels
- Squeeze dots
- Squeeze release dots
- BUY and SELL labels
- Weak breakout labels
- Head fake labels
- Band walk markers
- ATR-based Entry, SL, TP1, TP2, TP3 levels
- Colored risk and target zones
- A dashboard with market state information
────────────────────────────
IMPORTANT NOTES
────────────────────────────
This script is an indicator, not a strategy.
It does not place trades.
It does not guarantee profitable results.
It does not predict the future.
Signals can fail in ranging, low-liquidity, high-spread, or news-driven market conditions.
Users should test the indicator on their own symbols, timeframes, and trading style before using it in live market decisions.
Risk management remains the responsibility of the user. Indicador

Adaptive Dynamic BB Clouds [PRO] - Auto MA & Double SqueezeWelcome to the Adaptive Dynamic BB Clouds. Traditional Bollinger Bands use a static standard deviation multiplier (usually 2.0) and a fixed moving average (SMA). However, market conditions are constantly shifting between ranging, trending, and highly volatile states.
This indicator introduces an Adaptive Algorithmic Engine that dynamically adjusts both the Basis Line (Moving Average) and the Band Width based on real-time Volume, Trend Strength (ADX), and Momentum (RSI).
🌟 Core Features:
1. Auto-Adaptive Basis Line (Smart MA)
Instead of locking you into one moving average, the script reads the market and automatically selects the best MA:
VWMA (Volume Weighted): Activates automatically when there is a significant volume surge (Relative Volume > 1.3) to track institutional money flow.
EMA (Exponential): Activates when a strong trend is detected (ADX > 25) to reduce lag and stick closer to the price.
SMA (Simple): Defaults to this during flat, ranging, or low-volume markets to avoid false signals and whipsaws.
2. Multi-Factor Dynamic Bands
The width of the bands is no longer static. The script calculates a real-time weight and magnitude based on:
Trend (ADX): Expands bands during strong trends.
Volume (RelVol): Expands bands during high volume breakouts.
Momentum (RSI): Expands bands when approaching overbought/oversold extremes.
If the market is dead, the bands contract tightly, filtering out market noise.
3. MTF Clean Clouds (Macro vs. Micro)
The script automatically detects a logical Lower Timeframe (LTF) based on your current chart. It plots the Macro (Current TF) bands as thick lines and the Micro (LTF) bands as thin lines. The space between them is filled with a clean gradient cloud. This visually represents the "Tension Zone" or dynamic Support/Resistance.
4. Double Squeeze & Squeeze Background
Squeeze Background: When the bands contract inside the Keltner Channels, the chart background turns gray, indicating a volatility compression (Accumulation phase).
Double Squeeze (Purple Diamond 💎): A rare confluence signal. When both the Macro TF and Micro TF enter a squeeze at the exact same time, a purple diamond appears. This indicates an extremely high probability of an imminent, explosive volatility expansion.
5. Real-Time Dashboard
A sleek, customizable panel on the chart displays real-time metrics for ADX, Relative Volume, and the current "Squeeze %" strength, so you always know what is driving the indicator.
⚙️ How to Use:
Accumulation: Look for gray backgrounds (Squeeze) and high Squeeze %. Do not trade breakouts yet; wait for the energy to build up.
Breakout: When the background color disappears and bands expand, trade in the direction of the breakout.
Confluence: A purple diamond 💎 followed by a volume surge (shown in green on the dashboard) is a strong signal for a major move.
Note: 100% Repaint-Free. Built securely with lookahead_off and na() fallbacks.
(Disclaimer: This script is for educational purposes only and does not guarantee financial returns. Always use proper risk management.)
Indicador

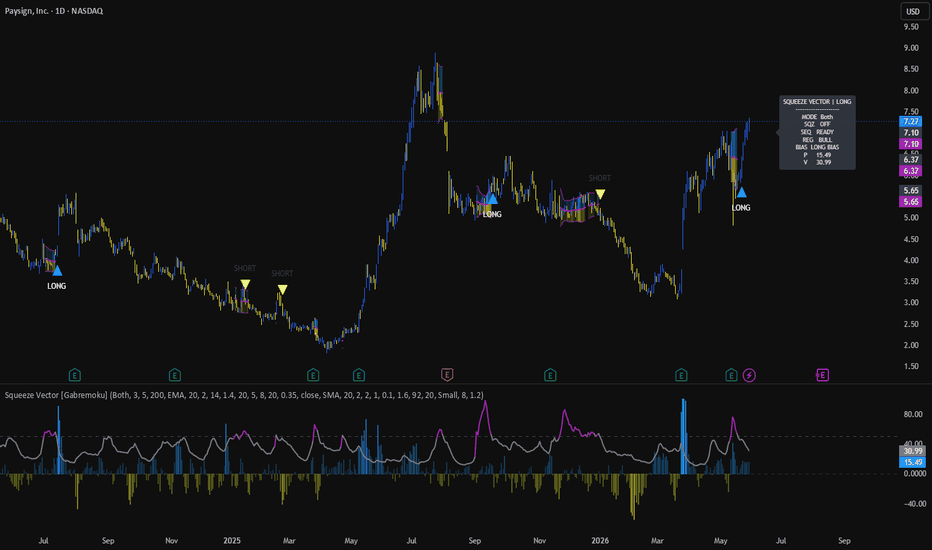
Squeeze Vector [Gabremoku]Squeeze Vector is a squeeze-based volatility breakout tool that combines Bollinger/Keltner compression detection, directional pressure flow, and a first-expansion state machine to help traders identify high-probability post-squeeze breakout setups.
The core idea is simple: compression precedes expansion. When Bollinger Bands shrink inside Keltner Channels, the market is coiling — and when that squeeze releases, the first directional signal can carry strong momentum. This script gives that process a structured visual and logical framework.
Core Concept — Squeeze → Release → Direction
A BB/KC squeeze occurs when Bollinger Bands, which reflect price volatility through standard deviation, contract inside Keltner Channels, which reflect typical range through ATR. This gap between the two envelopes is used as a proxy for volatility compression.
When BB width becomes smaller than KC width, the script identifies a Squeeze state. When it releases, the script enters an Armed state and opens a short post-squeeze window during which it looks for the first valid directional expansion.
Importantly, the squeeze release alone does not confirm direction. That is why the script adds multiple expansion confirmation filters before triggering a signal.
What it shows
Squeeze Vector Oscillator — a single line that rises as BB/KC compression increases. When it crosses above 50, the squeeze is active. The oscillator turns purple during squeeze states for fast visual identification.
Pressure Flow Histogram — a volume-weighted directional pressure value that reads where price closed within the candle range and weights it by volume relative to its moving average. Positive values indicate bullish pressure, negative values indicate bearish pressure.
Bollinger Overlay on Price — during squeeze states, the script renders Bollinger Bands directly on the main chart with gradient fills, making it easy to see where price is relative to the compressed structure.
LONG / SHORT signals — primary directional signals are placed on the main chart after a post-squeeze expansion bar meets all required conditions. Optional lighter repeat markers can be shown for follow-through confirmation.
Dashboard with live checklist — the on-chart dashboard shows the current state, regime, pressure, vector value, and a 6-point checklist for both long and short setups, with filled/empty circles to show how many conditions are currently met.
Signal Logic
The signal engine works as a state machine with three phases:
Squeeze — BB/KC compression is active. No signal is generated. The dashboard shows SQUEEZE.
Armed — the squeeze just released. The script opens a short expansion window and waits for directional confirmation. The dashboard shows ARMED.
Expansion signal — within the expansion window, if a valid directional bar forms with sufficient pressure, body size, and break condition, a LONG or SHORT label is placed on the main chart.
Signal direction is confirmed by checking:
Basis side: price above or below the BB basis
Pressure: smoothed directional pressure above threshold
Strong pressure: optional stronger filter
Body quality: minimum body-to-candle-range ratio
Break condition: higher high or lower low
Regime: optional EMA 200 trend filter
When both long and short conditions are simultaneously valid, the stronger pressure side wins. If pressure is equal, raw pressure bias decides.
States and Dashboard
The dashboard tracks the full machine at a glance:
Row Content
SQZ Squeeze ON / OFF
SEQ ARMED or READY
REG Trend regime (BULL / BEAR / OFF)
BIAS Current directional pressure bias
P Pressure Flow value
V Vector Oscillator value
Checklist 6-point LONG and SHORT condition matrix
The checklist can be set to appear only during Squeeze or Armed states to reduce visual noise when no setup is forming.
Features
✅ Bollinger/Keltner squeeze detection via ratio oscillator
✅ Volume-weighted directional pressure flow
✅ Post-squeeze first expansion state machine
✅ Armed → signal transition logic
✅ 6-point entry checklist for both long and short
✅ EMA 200 regime filter
✅ Bollinger overlay with gradient fill during squeeze
✅ LONG / SHORT signal labels on main chart
✅ Optional follow-through repeat markers
✅ Repeat window filter to suppress signal clustering
✅ Strategy mode: Long, Short, or Both
✅ Fully configurable dashboard with size and offset settings
✅ Alert conditions for BUY, SELL, and squeeze activation
How to use
A practical workflow:
Watch for the Vector Oscillator to cross above 50 and turn purple — that is the squeeze state.
When it releases below 50, the dashboard switches to ARMED.
In the expansion window, check the checklist: more filled circles on one side indicate stronger directional alignment.
A LONG or SHORT label confirms a valid first expansion signal.
Use the Pressure Flow histogram to gauge how strong and consistent the directional push is.
The squeeze release alone is not a signal. Direction is only confirmed when the expansion bar quality, pressure, and structure checks all align.
Notes
Like all squeeze-based tools, Squeeze Vector is most effective when used alongside price structure context. Squeezes release into strong moves, but not every release produces a sustained trend — volume, higher timeframe context, and support/resistance levels can all affect follow-through quality.
Author: Gabremoku
Pine Script v6 Indicador
Bollinger Band [scoopup]Overview
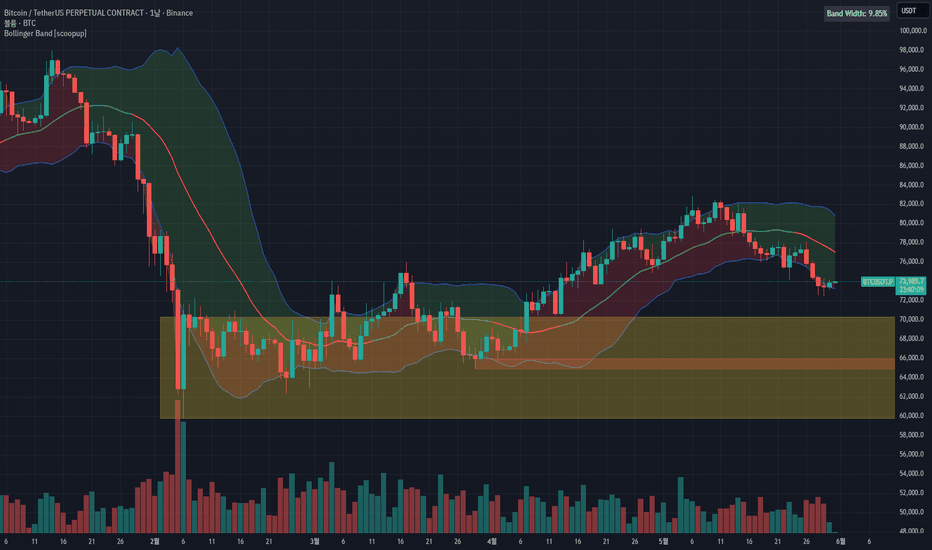
A Bollinger Bands–based indicator that shows trend direction (up/down) through the basis line color, displays band width (volatility) as a percentage, and marks the most recent meaningful lows (demand zones) on the weekly and daily timeframes as boxes. It lets you view statistical volatility and the real low zones where buying previously stepped in — all on a single chart.
Default settings are Length 21 and StdDev 1.618, based on the Fibonacci number (21) and the golden ratio (1.618).
Components
1. Bollinger Bands (Upper / Basis / Lower)
Defaults: Length 21, StdDev 1.618
Upper band, basis (middle), and lower band. The bands widen and narrow with volatility.
2. Basis Line Trend Color (Daily-based)
The color of the middle basis line indicates trend direction.
Logic: over a set lookback, it compares the cumulative size of the "close-to-lower" area (red) versus the "upper-to-close" area (green).
Red area dominant → uptrend → basis line GREEN
Green area dominant → downtrend → basis line RED
The longer the close stays near the lower band (larger red area), the more it is read as base-building before a move higher.
This color is always calculated from Daily data, regardless of the chart timeframe. Whether you view it on the 15m, 1h, or 4h chart, the daily trend color stays consistent.
3. Fill
Upper band ↔ close: semi-transparent green
Close ↔ lower band: semi-transparent red
Lets you quickly read where the close sits within the bands.
4. Band Width (%)
Formula: (Upper − Lower) / Basis × 100
Displays the current band width in a corner table as Band Width: X.XX%.
Lower = volatility contraction (squeeze) → often precedes a large move; higher = volatility expansion.
The Data Window also shows band width % and band width (price difference), including on historical bars.
5. Recent Lows
Weekly recent low = yellow box / Daily recent low = red box
Shows only the most recent pivot (swing) low that sits below the current close. (Lows above the close are skipped; if the latest low is above the close, the prior low is used instead.)
Box height spans the low ↔ the close at that point, and extends to the right to show a still-valid support/demand zone.
How to Read It
Basis green + close near the lower band → watch for a potential bounce after base-building.
Basis red + close near the upper band → watch for overextension/pullback risk.
Band Width % contracting (squeeze) → watch for an upcoming volatility expansion.
Recent low boxes (yellow/red) act as first support candidates on a pullback. A close below the box signals support failure.
Key Settings
Bollinger Bands: Source, Length (default 21), StdDev (default 1.618), Band Color / Width / Style
Basis Line: Show Basis, Basis Width, Ratio Length, Up / Down Color
Fill: Show Fill, Upper / Lower Fill Transparency
Band Width: Show Band Width %, Table Position, Text Size
Recent Lows: weekly/daily toggles, Pivot Length, Box Color
Tips
This is a supporting tool for reading trend direction + volatility + support zones together, not a standalone trade signal.
Reliability increases when the daily trend color and a recent low box line up in the same area.
Adjust StdDev and Ratio Length to fit each instrument's volatility.
Disclaimer
This indicator is for reference only and does not guarantee trading profits. All trading decisions and responsibility rest solely with the user. Indicador
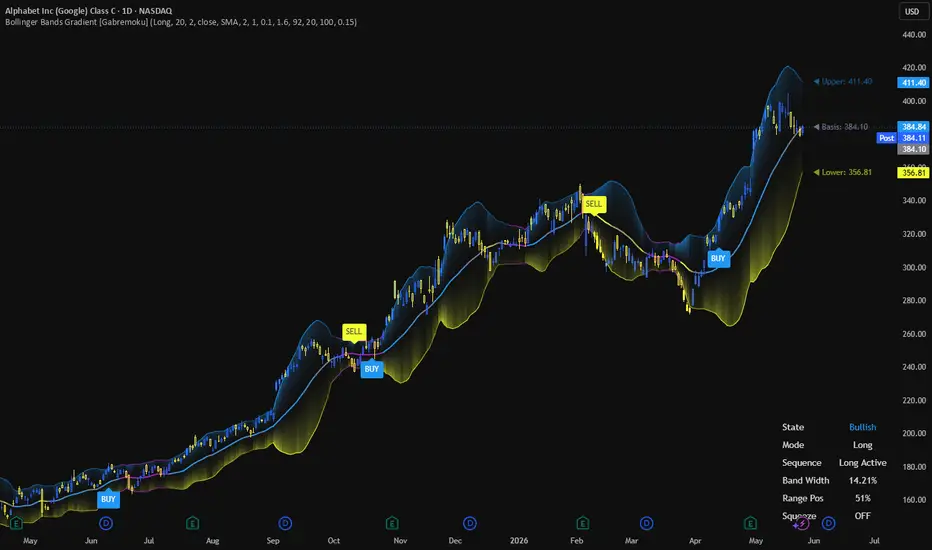
Bollinger Bands Gradient [Gabremoku]Bollinger Bands Gradient is an enhanced Bollinger Band overlay designed to turn classic volatility bands into a richer visual and signal-based trading framework.
The indicator keeps the core structure of Bollinger Bands — Upper Band, Basis, and Lower Band — but adds a dynamic gradient fill, squeeze detection, state-based bar coloring, strategy-side signal logic, and an optional dashboard for fast chart interpretation. Bollinger Bands are widely used to read volatility compression, expansion, and breakout behavior, especially when traders want more context than a standard three-line display can offer.
This script is built for traders who want Bollinger Bands to feel more alive: clearer transitions, better volatility awareness, and cleaner breakout mapping directly on price.
What it shows
🌈 Dynamic Gradient Fill — the area between Upper/Basis and Basis/Lower is filled with adaptive color intensity that changes according to price distance from the basis.
🗜️ Squeeze Detection — the script monitors Bollinger Band compression and flags low-volatility states when band width contracts relative to its recent range. Bollinger squeezes are commonly used to identify volatility contraction before a possible breakout.
🎨 State-Based Coloring — basis line, bands, bars, and optional background can all shift visually depending on whether the market is bullish, bearish, neutral, or in squeeze mode.
📍 Breakout Signals — optional labels for:
BUY / SELL in Long mode
SHORT / CLOSE in Short mode
🪧 Dashboard — a compact panel showing current state, strategy mode, sequence status, band width, range position, and squeeze condition.
🏷️ Last Value Labels — optional live labels for Upper, Basis, and Lower band values.
Core logic
This script combines volatility structure and signal sequence control.
At the core, Bollinger Bands define the dynamic range around a moving average using standard deviation, which helps visualize whether price is relatively stretched or compressed versus its recent behavior. Narrow bands usually reflect low volatility, while wide bands reflect expansion.
On top of that, this version introduces:
a basis color gradient tied to price position inside the band structure,
a fill intensity model tied to distance from the basis,
and a state machine that prevents repeated entry signals in the same sequence.
That makes the indicator more structured than a plain breakout marker, especially for traders who want cleaner signal flow.
Signal logic
The indicator supports two operating modes:
Long Mode
BUY = breakout above the Upper Band
SELL = breakdown below the Lower Band
Short Mode
SHORT = breakdown below the Lower Band
CLOSE = breakout above the Upper Band
This logic reflects one of the most common ways traders use Bollinger Bands: watching for volatility compression, then responding to expansion outside the bands. At the same time, Bollinger-based strategies can also be used for mean reversion, which is why breakout signals generally work best when confirmed by price structure, momentum, or volume.
Features
✅ Classic Bollinger Bands with selectable basis type
✅ Dynamic gradient fill above and below the basis
✅ Adaptive basis coloring based on price position
✅ Squeeze detection using band-width normalization
✅ Optional squeeze background highlighting
✅ Optional bar coloring by state
✅ Strategy-side selector: Long or Short
✅ Breakout signal state machine
✅ BUY / SELL / SHORT / CLOSE labels
✅ On-chart dashboard
✅ Optional last-value labels
✅ Fully customizable colors and style inputs
How to use
A practical reading flow is:
Watch for band contraction and squeeze conditions.
Treat that as a volatility compression phase.
Monitor for price expansion outside the bands.
Use the selected strategy mode to interpret the resulting signal sequence.
In practice:
tight bands + squeeze on = market compression
break above upper band = bullish expansion candidate
break below lower band = bearish expansion candidate
That said, Bollinger breakouts can fail in choppy environments, so many traders confirm them with momentum, volume, or higher timeframe structure rather than using them in isolation.
Notes
This indicator is designed as an enhanced Bollinger workflow tool, not as a complete trading system with full risk management. Bollinger Bands can support both breakout and mean-reversion approaches, so the best interpretation depends on market regime and confirmation methods.
Author: Gabremoku
Pine Script v6 Indicador

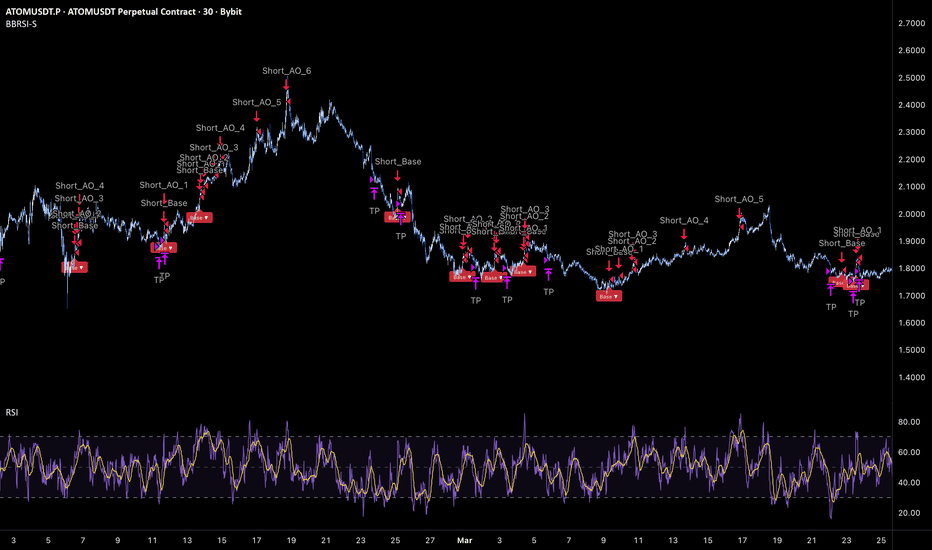
BB-RSI - Short IndicatorBB-RSI — Short Indicator
🔷 What it does:
This is a signal-only indicator that mirrors a fade-the-strength short DCA workflow. It tracks one virtual short position at a time, opened only when TWO independent overbought conditions align on a lower timeframe, then scales the position with up to nine safety orders as price ladders higher against entry. The indicator computes a running average entry, total deployed capital, and open PnL from the live fill ledger and renders all of it on the chart. Every event emits a webhook-ready JSON payload tailored for a DCA Bot.
- Dual confirmation entry: Bollinger Bands %B(20, 2.0) crossing up 1.00 AND RSI(7) crossing up 65, both on 30m.
- Wide deviation ladder: 0.72% to first safety order, 1.55× step multiplier — last AO at ~63% above base entry.
- Soft compounding: each safety order is sized 1.03× the previous one.
- Fixed exit: TP at 2.11% below the running average entry. No trailing, no Stop Loss.
- Eleven discrete events per cycle (entry + 9 AO fills + TP) — each one fires its own webhook payload.
🔷 Who is it for:
- Swing traders running a DCA Bot on crypto perpetuals that frequently overshoot resistance.
- Bot operators who want a chart-driven signal source that emits per-event JSON ready for a DCA Bot.
- Traders who want to monitor an evolving short position — base entry, owned AO levels, deployed capital, open PnL — directly on the chart without the strategy-tester overhead.
- Risk-conscious operators building a high-confidence, low-drawdown defensive short into a diversified portfolio.
🔷 How does it work:
Bollinger Bands %B Filter: A 30-minute Bollinger Bands(20, 2.0) is sampled via request.security and converted to %B = (close − lower) / (upper − lower). The BB gate fires when %B crosses up the configured level (default 1.00 — price exiting the upper band) at host-bar close.
RSI Filter: A 30-minute RSI(7) is sampled in parallel. The RSI gate fires when RSI crosses up the configured level (default 65 — entering overbought) at host-bar close.
Entry: When both gates align at the same host-bar close, the indicator marks a virtual short entry, captures the base entry price, seeds the cost-basis ledger, and fires the entry webhook payload.
Safety Order Ladder: After base entry, the indicator monitors close price upward against the position. When close reaches base entry × (1 + cumulative deviation), the k-th safety order is marked filled, cost-basis is updated, and the AO webhook payload is fired. Cumulative deviation grows by the step multiplier (default 1.55): 0.72%, 1.84%, 3.57%, 6.25%, 10.40%, 16.48%, 25.90%, 40.51%, 63.14%. AO USDT size grows by 1.03× per fill — soft compounding rather than aggressive martingale.
Honest Virtual Bookkeeping: Total cost and total qty are updated incrementally on every event, so the avg entry, deployed capital, and open PnL displayed in the status table reflect the actual broker-equivalent position state — no shortcut from base entry, no synthetic averaging.
Exit: A fixed Take Profit at 2.11% below the running average entry. When close reaches the TP target, the close webhook payload fires and the virtual position resets.
🔷 Why it's unique:
- Dual-Filter Confirmation: Two independent signals on the same lower timeframe must align. %B captures volatility expansion beyond statistical bounds; RSI captures momentum overheating. Together they filter out the either-or noise that triggers single-condition strategies.
- Soft Compounding Ladder: The 1.03× size multiplier is much gentler than typical martingale (1.5–2.0×). It scales position size with adverse drift but doesn't blow up capital deployment if all safety orders fill.
- Fill-by-Fill Avg Entry: The orange avg-entry line is derived from running totals updated on every event — what you see is what the broker-equivalent position would actually have.
- Per-Event Webhook Ledger: Eleven distinct events per cycle, each with its own JSON alert payload. The indicator drives a DCA Bot end-to-end through a single TradingView alert.
🔷 Considerations Before Using the Indicator:
Market & Timeframe: Designed for liquid crypto perpetuals on 30m–1h ranges. Default thresholds are calibrated for ATOMUSDT.P 30m. Strongly trending markets will fill the entire 9-AO ladder and hold the short while price grinds higher — the dual filter limits exposure to confirmed overbought conditions, but a regime shift to a strong trend requires manual oversight.
Cross Detection Granularity: Entries and AO fills are evaluated on bar close. A bar that spikes through a level and returns within the same bar may be missed by design — this matches realistic polling behavior and avoids over-signaling on intra-bar wicks.
Live vs Historical State: The virtual position state is rebuilt from chart history each time the indicator is recompiled. If the indicator is added mid-deployment or the live bot diverges from the signal stream (manual interventions, partial fills), the indicator state may not match the live bot. Toggle the indicator off and on to reset.
Funding Rates (Perpetuals): The indicator does not account for perpetual funding rates. Sustained positive funding (longs pay shorts) improves live performance; sustained negative funding degrades it. Review the historical funding pattern before live deployment.
No Stop Loss: There is no exit signal on adverse moves beyond the 9-AO ladder. Risk is structurally capped on the bot side by the bounded position-size ladder. If a hard exchange-side stop is required, configure it on the bot directly.
Backtesting Note: This is an indicator, not a strategy. There is no built-in P&L tester. For performance metrics over a 2.5-year sample (~267 closed trades, 79.78% win rate, 1.53% max drawdown, profit factor 6.23), use the companion strategy version on identical parameters.
🔷 How to Use It:
🔸 Add the indicator to a 30m chart on the perpetual pair you want to trade.
🔸 Review the BB filter (timeframe / period / deviation / level) and the RSI filter (timeframe / length / level). Defaults are calibrated for ATOMUSDT.P 30m — recalibrate per asset before deploying.
🔸 Set the AO ladder parameters (count, first AO size, step, multipliers) and the Take Profit percentage to match your bot's configuration.
🔸 In the DCA Bot Webhook group, paste the Bot ID, Email Token, and Pair (QUOTE_BASE format, e.g., USDT_ATOM).
🔸 Create an alert on the indicator with "Any alert() function call". Paste the DCA Bot's webhook URL into the alert's Webhook field. The indicator will emit JSON payloads for short entry, each safety order, and TP exit — formatted for direct DCA Bot consumption.
🔷 INDICATOR SETTINGS
Base Order Size (USDT): Virtual order size for the avg-entry computation. Real sizing happens on the bot.
First AO Size (USDT): Virtual size of the first safety order; subsequent AOs scale by the Size Multiplier.
Order Size Multiplier: Factor that grows each subsequent safety order's USDT size.
Averaging Orders per Trade: Maximum number of safety orders per deal (default 9).
Deviation to First AO (%): Distance from base entry at which AO1 becomes eligible.
Deviation Step Multiplier: Ladder factor that widens each subsequent deviation step.
BB Timeframe / Period / Deviation / Level: Lower-timeframe Bollinger Bands %B filter on the host symbol.
RSI Timeframe / Length / Level: Lower-timeframe RSI filter on the host symbol.
Take Profit (%): Fixed distance below the running average entry where the virtual short closes.
DCA Bot Webhook: Bot ID, Email Token, and Pair fields injected into every alert payload.
Visualization: Toggle DCA Ladder, Avg Entry / TP plot lines, fill labels, signal triangles, status table.
Brand Watermark: Configurable text, position, size, and transparency.
👨🏻💻💭 We hope this tool helps enhance your trading. Your feedback is invaluable, so feel free to share any suggestions for improvements or new features you'd like to see implemented.
__
The information and publications within the 3Commas TradingView account are not meant to be and do not constitute financial, investment, trading, or other types of advice or recommendations supplied or endorsed by 3Commas and any of the parties acting on behalf of 3Commas, including its employees, contractors, ambassadors, etc. Indicador

BB-RSI Overbought DCA - Short StrategyBB-RSI Overbought DCA — Short Strategy
🔷 What it does:
This is a short-only DCA strategy that fades overbought thrusts confirmed by two independent volatility-and-momentum filters on a lower timeframe. A short entry opens only when Bollinger Bands %B crosses up the upper band AND RSI crosses up an overbought threshold at the same lower-timeframe close — the dual confirmation requires both volatility-expansion and momentum-overheat to align. Nine safety orders form a wide deviation ladder for adverse upward price action. Exit is a fixed percentage Take Profit below the running average entry. No trailing, no Stop Loss.
- Single base order with up to nine safety orders, sized at a 1.03× progression for soft compounding.
- Dual-filter entry: BB %B(20, 2.0) crossing up 1.00 AND RSI(7) crossing up 65, both on 30m.
- Wide deviation ladder: 0.72% to first safety order, 1.55× step multiplier — last safety order at ~63% above base entry.
- Take Profit: 2.11% below average entry. No trailing.
- Every entry, safety order, and exit emits a webhook-ready JSON alert payload for direct DCA Bot consumption.
🔷 Who is it for:
- Swing traders looking for high-win-rate short exposure on crypto perpetuals that frequently overshoot resistance.
- Bot operators who want a mechanical fade engine with dual confirmation and bounded position size.
- Risk-conscious operators — at default settings the maximum deployed capital is ~8.93% of equity, and the realized maximum drawdown over a 2.5-year sample stayed at 1.53%.
- Traders building a low-correlation portfolio: a defensive short with very low DD and an exceptional profit factor pairs well with directional long strategies.
🔷 How does it work:
Bollinger Bands %B Filter: A 30-minute Bollinger Bands(20, 2.0) is sampled via request.security and converted to %B = (close − lower) / (upper − lower). When %B crosses up the configured level (default 1.00 — price exiting the upper band), the BB gate is satisfied. The 30-minute timeframe is sampled with lookahead disabled to avoid repaint.
RSI Filter: A 30-minute RSI(7) is sampled in parallel. When RSI crosses up the configured level (default 65 — entering overbought), the RSI gate is satisfied. Both gates must be satisfied at the same host-bar close to arm a base entry.
Entry: When both filters cross up on the same host bar, a short position opens at the base order size. The base order is configurable as Market (default) or Limit at the bar's close.
Safety Order Ladder: After the base fill, the strategy monitors price deviation upward against the position. The k-th safety order fires when close ≥ base entry × (1 + cumulative deviation), where cumulative deviation grows by the step multiplier (default 1.55). At default settings: 0.72%, 1.84%, 3.57%, 6.25%, 10.40%, 16.48%, 25.90%, 40.51%, 63.14%. Each safety order's size grows by the size multiplier (default 1.03) — soft compounding rather than aggressive martingale.
Exit: A fixed Take Profit at 2.11% below the running average entry. The position closes the moment close ≤ TP target. No trailing, no Stop Loss.
🔷 Why it's unique:
- Dual-Filter Confirmation: Two independent signals on the same lower timeframe must align. %B captures volatility expansion (price extension beyond statistical bounds); RSI captures momentum exhaustion. Together they filter out either-or noise that would trigger single-condition strategies.
- Soft Compounding Ladder: The 1.03× size multiplier is much gentler than typical martingale (1.5–2.0×). It still scales position size with adverse drift but doesn't blow up capital deployment if all safety orders fill.
- Bounded Position Cap: With 9 safety orders at 1.03× progression, the maximum deployed capital is exactly base + 80 × 10.159 = 893 USDT per trade ≈ 8.93% of default equity. Inside the conventional 5–10% per-trade band, no surprises.
- DCA Bot Integration: Every event (base, AO 1–9, exit) emits a fully-formed JSON alert payload. Connect one alert to a DCA Bot's webhook URL and the strategy drives the bot end-to-end.
🔷 Considerations Before Using the Strategy:
Market & Timeframe: Defaults are calibrated for BYBIT:ATOMUSDT perpetual on 30m. The dual-filter combination is portable to other liquid crypto perpetuals that mean-revert from overbought stretches, but filter thresholds (BB level, RSI level) should be reviewed before redeployment.
Strong Uptrends: Like any fade-the-strength setup, this strategy is positioned for ranges and rotations, not breakouts. In sustained uptrends the strategy may fill the entire 9-AO ladder and hold the short while price grinds higher. The dual filter limits exposure to confirmed overbought conditions, which historically have higher mean-reversion expectancy, but a regime shift to a strong trend requires manual oversight.
Performance Profile: This is a high-confidence, low-volatility, low-return defensive short. Over the 2.5-year backtest the strategy returned +3.95% with a 1.53% maximum drawdown — annualized return is modest, but the return-to-DD ratio of ~2.6 and profit factor of 6.23 reflect very tight risk control. Size accordingly: this is a portfolio contributor, not a standalone alpha source.
Funding Rates (Perpetuals): Backtests do not account for perpetual funding rates. Sustained positive funding on ATOMUSDT.P (longs pay shorts) would improve live performance; sustained negative funding (shorts pay longs) would degrade it. Review the historical funding pattern before live deployment.
Commission Calibration: The default commission (0.4%) is set high as a conservative assumption. The actual Bybit perpetual taker fee is approximately 0.06%, so live performance with realistic Bybit fees should be meaningfully better than the published numbers. Update the commission input to match your fee tier for accurate forward expectations.
No Stop Loss Justification: There is no exit on adverse moves beyond the 9-AO ladder. Per-trade risk is structurally capped by the bounded position-size ladder — at defaults that is 893 USDT max deployed = 8.93% of equity, inside the conventional 5–10% per-trade band. If a hard stop is required at the exchange level, layer it on the bot side.
🔷 STRATEGY PROPERTIES
Symbol: BYBIT:ATOMUSDT.P (Perpetual)
Timeframe: 30M
Test Period: Mar 1, 2025 — Apr 1, 2026 (~1.1 years).
Initial Capital: 10,000 USDT.
Order Size per Trade: 0.8% of Capital base + 9 safety orders at 1.03× progression.
Max Capital Deployed: ~893 USDT per trade (~8.93% of equity).
Commission: 0.4% per trade (conservative — Bybit perpetual taker is ~0.06%).
Slippage: 3 ticks.
Margin for Short Positions: 100%.
Indicator Settings: Default Configuration.
Base Order: 80 USDT, Market by default (Limit toggle available).
Take Profit: 2.11% below average entry (no trailing).
Stop Loss: None — bounded position size is the structural risk cap.
BB %B Filter: 30m BB(20, 2.0), Crossing Up 1.00.
RSI Filter: 30m RSI(7), Crossing Up 65.
Averaging Orders: 9, Deviation 0.72%, Deviation Step 1.55×, Size Multiplier 1.03×.
Strategy: Short Only.
🔷 STRATEGY RESULTS
⚠️ Remember, past results do not guarantee future performance.
Net Profit: +395.18 USDT (+3.95%)
Max Equity Drawdown: 154.46 USDT (1.53%)
Total Closed Trades: 267
Percent Profitable: 79.78% (213 / 267)
Profit Factor: 6.23
🔷 How to Use It:
🔸 Adjust Settings: Open the strategy inputs and review the Base Order Size, BB filter (period / deviation / level), RSI filter (length / level), the 9-AO ladder, and the Take Profit percentage. Defaults are calibrated for ATOMUSDT.P 30m — recalibrate per asset before deploying.
🔸 Results Review: Run a full-period backtest and confirm Max Drawdown stays inside your personal risk band. Validate that the closed-trade count is statistically meaningful (≥ 100 is a reasonable floor). Update commission to match your exchange's actual fees.
🔸 Create alerts to trigger the DCA Bot: Add one alert on the strategy using "Any alert() function call". Paste the DCA Bot's webhook URL into the alert's Webhook field, and fill the Bot ID, Email Token, and Pair inputs on the script. The strategy will emit JSON payloads for short entry, each safety order, and exit — formatted for direct DCA Bot consumption.
🔷 INDICATOR SETTINGS
Base Order Size (USDT): USDT amount opened on the short entry.
Use LIMIT for Base: Toggle between Market (default) and Limit at bar close.
Averaging Orders per Trade: Maximum number of safety orders per deal (default 9).
First AO Size (USDT): USDT size of the first safety order; subsequent AOs scale by the Size Multiplier.
Deviation to First AO (%): Distance from base entry at which AO1 becomes eligible.
Deviation Step Multiplier: Ladder factor that widens each subsequent deviation step.
Order Size Multiplier: Factor that grows each subsequent safety order's USDT size.
BB Timeframe / Period / Deviation / Level: 30-minute Bollinger Bands %B filter on the host symbol.
RSI Timeframe / Length / Level: 30-minute RSI filter on the host symbol.
Take Profit (%): Fixed distance from average entry where the short closes for profit.
DCA Bot Webhook: Bot ID, Email Token, and Pair fields injected into every alert payload.
Visualization: Toggle DCA Ladder, fill labels, status table.
Brand Watermark: Configurable text, position, size, and transparency.
👨🏻💻💭 We hope this tool helps enhance your trading. Your feedback is invaluable, so feel free to share any suggestions for improvements or new features you'd like to see implemented.
__
The information and publications within the 3Commas TradingView account are not meant to be and do not constitute financial, investment, trading, or other types of advice or recommendations supplied or endorsed by 3Commas and any of the parties acting on behalf of 3Commas, including its employees, contractors, ambassadors, etc. Estrategia
HiddenRidder - 2xBB Timelocked + MAs## HiddenRidder - 2xBB Timelocked + MAs##
⚠️ Disclaimer
This indicator is shared for educational purposes only. It is a technical analysis tool and does not guarantee specific win rates or financial success. Always practice strict risk management.
------------------------------
## 🔍 Overview
HiddenRidder - 2xBB Timelocked + MAs is a multi-timeframe trend architecture overlay. It projects macro volatility zones and institutional trend states directly onto lower execution timeframes.
This setup is highly optimized for 0DTE options, futures trading, and swing trades .
Unlike standard Bollinger Bands that track a single period, this script tracks two separate Higher Timeframe (HTF) bands simultaneously: a Fast Bollinger (Length 3) and a Slow Bollinger (Length 9). This allows you to monitor short-term momentum shifts and long-term structural trends from a single chart without switching timeframes.
------------------------------
## 🛠️ Core Features & Logic
* Timelocked Dual Bollinger Bands: Calculates two separate Bollinger Bands locked to a higher timeframe (e.g., Daily) using a 2x Standard Deviation multiplier.
* Fast Bollinger (Length 3): Captures immediate HTF price expansions.
* Slow Bollinger (Length 9): Establishes the macro structural boundaries.
* Dynamic Trend Basis Line: The central slow basis line changes color dynamically. It turns Green when the price trades above it and Red when the price trades below it.
* Hyper-Extension Breakout Clouds: When enabled (Fill Outside BB), the chart floods with color when the price breaks outside the slow 2SD bands.
* Bright Green Cloud: Triggers when the close price breaks above the upper outer band.
* Bright Red Cloud: Triggers when the close price breaks below the lower outer band.
------------------------------
## ⏱️ Timeframe Setup Guide
* Indicator Input Setting: Keep the Bollinger Band lock Timeframe set to Daily (D).
* Execution Chart: Open your main trading chart on the 5-Minute (5M) timeframe.
* The Interface: The wide macro bands will stretch across your fast 5M candles, acting as major institutional support and resistance maps.
------------------------------
## 🚦 The Baseline Filter ( The Golden Rule )
To stay on the right side of the institutional trend on a fast 5M chart, use the center line color as your directional filter:
* If the center line is Green , focus only on Long setups.
* If the center line is Red , focus only on Short setups.
------------------------------
## 🎯 Trade Setups & Strategy Execution##
Strategy 1 : The Mean Reversion (The Snap-Back)
Best for choppy, sideways, or range-bound macro markets.
* Long Setup:
1. The 5M price drops and touches or pierces the Slow Bollinger Lower Band (Length 9).
2. Wait for a 5M bullish reversal candle (e.g., a hammer, bullish engulfing, or long lower wick).
3. Entry: Open of the next candle.
4. Take Profit (TP): The dynamic central basis line.
5. Stop Loss (SL): Just below the recent 5M swing low.
* Short Setup:
1. The 5M price rallies and touches or pierces the Slow Bollinger Upper Band (Length 9).
2. Wait for a 5M bearish reversal candle (e.g., a shooting star, bearish engulfing, or long upper wick).
3. Entry: Open of the next candle.
4. Take Profit (TP): The dynamic central basis line.
5. Stop Loss (SL): Just above the recent 5M swing high.
## Strategy 2 : The Hyper-Extension Breakout (Riding the Cloud)
Best for aggressive, heavy-volume momentum days.
* Long Setup:
1. A 5M candle closes completely above the Slow Bollinger Upper Band.
2. The Bright Green Breakout Cloud floods your screen.
3. Entry: Enter long immediately on the close of that breakout candle.
4. Take Profit (TP): Trail using 5M swing highs, or exit when a 5M candle closes back inside the Fast Bollinger Upper Band (Length 3).
5. Stop Loss (SL): Below the Fast Bollinger Upper Band line.
* Short Setup:
1. A 5M candle closes completely below the Slow Bollinger Lower Band.
2. The Bright Red Breakout Cloud floods your screen.
3. Entry: Enter short immediately on the close of that breakout candle.
4. Take Profit (TP): Trail using 5M swing lows, or exit when a 5M candle closes back inside the Fast Bollinger Lower Band (Length 3).
5. Stop Loss (SL): Above the Fast Bollinger Lower Band line.
------------------------------
## ⚙️ Input Settings Summary
* Bollinger Band lock Timeframe: Select your target higher timeframe (Default: D).
* Length Short: Sets the period for the Fast Bollinger band (Default: 3).
* Length Long: Sets the period for the Slow Bollinger band (Default: 9).
* Fill Outside BB: Turn this on to display the green/red hyper-extension breakout clouds.
=====================
🎁 Bonus Feature : High-tier institutional EMA Ribbon (20/50/200) with custom trend-cloud formatting. It is currently set to invisible by default , keeping the chart clean while hiding a pro-level momentum engine just for my loyal fans. Indicador
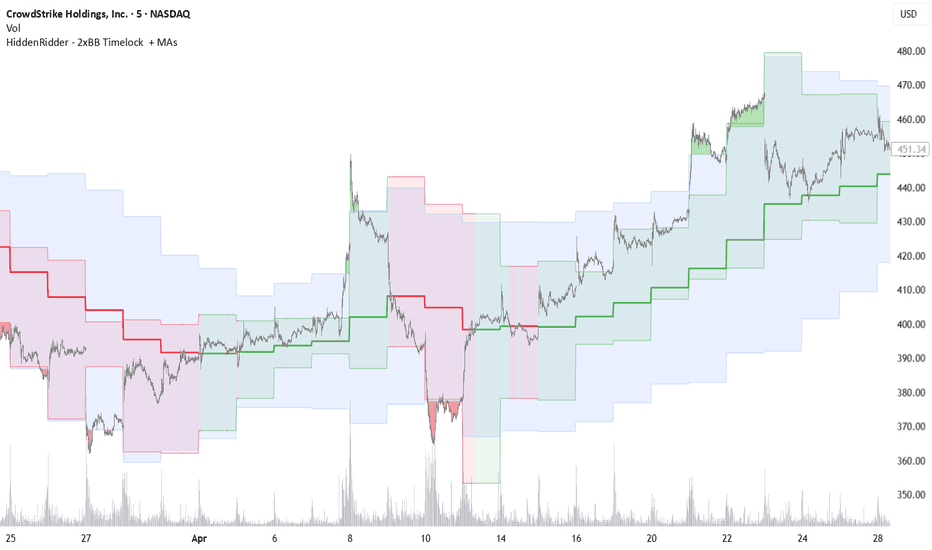
SW Hybrid Bollinger Bands## Overview
Welcome to the **SW Hybrid Bollinger Bands**, a modern take on the classic Bollinger Bands volatility indicator.
Unlike traditional Bollinger Bands that strictly use the closing price and a single Simple Moving Average (SMA), this script dynamically calculates standard deviation bands based on both the **High** and **Low** price points of candles. Furthermore, it incorporates both **EMA (Exponential Moving Average)** and **WMA (Weighted Moving Average)** to provide a smoother, more responsive volatility channel.
---
## How It Works
The indicator splits the volatility channels into two distinct zones:
* **Green Channels (High-Based):** Calculated using the candle's *High* price, integrated with EMA and WMA. These act as ultimate dynamic resistance zones and momentum gauges for upside moves.
* **Purple Channels (Low-Based):** Calculated using the candle's *Low* price, integrated with EMA and WMA. These serve as dynamic support zones and exhaustion areas during downward trends.
* **Center Line (White):** A standard 20-period SMA to keep you anchored to the baseline trend.
By blending EMA (which reacts faster to recent price action) and WMA (which emphasizes linear weight), the fills between these lines create unique **"Liquidity/Volatility Belts"** rather than single strict lines.
---
## How to Trade with It
1. **Trend Riding:** During strong uptrends, the price tends to float between the 20 SMA and the upper Green Channels. In strong downtrends, it stays between the 20 SMA and the lower Purple Channels.
2. **Reversals & Exhaustion:** When the price penetrates deep into the outer green or purple filled zones, it often signals an overextended market, hinting at a potential mean-reversion back to the white 20 SMA.
3. **Volatility Squeezes:** When the green and purple bands compress tightly towards each other, expect a massive explosive breakout soon.
---
## Release Notes
* **Open Source:** Free for the community! Feel free to favorite, share, and modify.
* **Version:** Pine Script v6 optimized.
* **Clean Visuals:** Red color elements updated to sleek **Purple** for better chart readability and modern aesthetic.
*Disclaimer: This script is for educational and informational purposes only. Past performance does not guarantee future results.* Indicador

Tetrad Elektro Community v1.0Tetrad Elektro Community is an open-source educational strategy built around Bollinger Band exhaustion, RSI confirmation, and optional bearish divergence logic.
The strategy is designed to identify stretched market conditions where price may be overextended relative to its recent range. Long setups look for price pressing into the lower Bollinger Band with oversold RSI confirmation. Short setups look for upper-band exhaustion, elevated RSI, or bearish divergence where price makes a new high but RSI or MACD fails to confirm.
Suggested use:
This strategy is best studied on the 30-minute or 45-minute chart. It was designed primarily for crypto markets and may work across several liquid crypto assets such as BTC, ETH, SOL, and DOGE. It may also be worth researching on high-liquidity stocks or ETFs, but users should always test each asset individually before relying on any result.
Suggested mode selection:
- Use Long Only in bullish environments.
- Use Short Only in bearish environments.
- Use Long & Short in ranging or two-sided environments.
The strategy includes:
- Bollinger Band mean-reversion logic
- Main RSI and fast RSI filters
- Optional bearish divergence using RSI/MACD confirmation failure
- Optional stop loss
- Optional time stop
- Optional flat-first execution behavior
- Clean chart visuals with optional labels and signal markers
This public community version is intentionally simplified. It does not include Tetrad’s private MLTT/RORO risk engine, execution controller, portfolio allocator, live-routing infrastructure, optimized production parameters, or machine-learning overlays.
This is not financial advice. Backtests are hypothetical and may differ from live execution. Always test on your own market, timeframe, exchange, fee assumptions, and risk model before using any strategy. Estrategia

Indicador

Momentum Matrix [LIVE]### Introduction
Welcome to Momentum Matrix , a multi-dimensional momentum and volatility confluence engine. This indicator combines Linear Geometry (Moving Average Slope) with Derivative Volatility Breakouts (Bollinger Bands applied to a custom MACD line) to create a rigorous, two-step verification system designed to identify high-probability trend expansions while filtering out low-volume market noise and chop.
### How It Works
1. **The Core Trend (MA Angle):** The script normalizes a moving average using an Average True Range (ATR) calculation to determine its precise geometric angle. It flags the trend as bullish or bearish only when the moving average breaks past a user-defined threshold (e.g., 6°), turning flat ranges grey (**No Trade Zone**).
2. **The Volatility Trigger (MACD BB):** A custom MACD line is tracked natively against standard deviation Bollinger Bands. When momentum expands, the MACD line punches outside the bands.
3. **The Confluence Signal:** When **both** systems simultaneously turn bright green or bright red, the script prints a distinct **Confluence Dot** on the zero line, signaling an institutional momentum breakout.
---
### Key Use Cases
*🚀 **Squeeze Play & Volatility Breakout Entries***
Entering the trade on the first Confluence Dot catches the absolute beginning of a macro trend expansion.
*📈 **High-Probability Trend Following***
As long as the lines and histograms stay locked in solid green or red, it proves that the velocity of the move is being actively sustained by volume.
*⚠️ **False Breakout Filter (Staying Out of Chop)***
Many traders lose money by buying a breakout on the price chart, only for it to immediately reverse. This indicator acts as a gatekeeper. If price makes a sudden spike upward, the MACD might briefly flash green. However, if the broader Moving Average Angle remains flat and stuck in the "No Trade Zone," the indicator refuses to print a buy dot, preventing FOMO entries.
*⏱️ **Scalping with the Live Delta Dashboard***
If an asset is moving up but the live angle change starts decaying (e.g., dropping from +2.5° down to +0.2°), it signals a hidden momentum loss—alerting you to take profits before the price action actually stalls out.
---
### Key Features
* **Adaptive MA Selection:** Swap between EMA, SMA, HMA, LSMA, ALMA, and McGinley.
* **Built-in Volatility Filter:** Bollinger Bands track the MACD line directly to confirm momentum expansion.
* **Live Statistics Table:** View current trend angles and live changes on every tick.
* **Strict Non-Repainting Signals:** Confluence triggers confirm at the close of the bar to ensure historical data accuracy.
---
### Credits & Acknowledgments
This script is a customized confluence engine built upon the excellent open-source work of two brilliant developers in the TradingView community. Special thanks to:
* ** @Mango2Juice ** for the foundational logic behind the *Angle of Moving Averages* script.
* ** @Algokid ** for the original concept and design of the *AK MACD BB indicator*.
This version modernizes the calculations into Pine Script v5 , introduces a dynamic real-time tracking dashboard, and establishes a strict non-repainting mathematical handshake between both metrics. Indicador

Bollinger Bands Breakout Oscillator
A Bollinger-style volatility oscillator that measures bullish and bearish breakout pressure when price expands beyond the upper or lower band.
Bollinger Breakout Pressure Oscillator is a momentum and volatility-based oscillator designed to measure bullish and bearish pressure outside a Bollinger-style volatility envelope.
The indicator uses an EMA as the central baseline and calculates upper and lower bands using standard deviation. Instead of simply showing whether price is above or below the bands, it measures how much price has expanded beyond the upper or lower band over a selected lookback period.
Bullish pressure is calculated when price pushes above the upper band.
Bearish pressure is calculated when price pushes below the lower band.
The result is displayed as two separate oscillator readings:
- Bullish Breakout Pressure
- Bearish Breakout Pressure
A higher bullish reading suggests stronger upside expansion beyond the upper volatility band.
A higher bearish reading suggests stronger downside expansion beyond the lower volatility band.
The midline at 50 can be used as a reference zone to evaluate whether breakout pressure is becoming more significant.
This tool can help traders identify:
- Volatility expansion
- Bullish breakout pressure
- Bearish breakout pressure
- Momentum continuation
- Exhaustion after strong moves
- Directional imbalance outside the bands
Best used with price action, volume, VWAP, support and resistance, session structure, or trend filters. This indicator is not designed to predict reversals or guarantee breakout continuation. It should be used as a pressure-reading tool, not as a standalone trading system.
How it works:
The indicator builds a volatility envelope using an EMA baseline and standard deviation bands. It then compares price against the upper and lower bands over the selected lookback period.
When price moves above the upper band, bullish breakout pressure increases.
When price moves below the lower band, bearish breakout pressure increases.
The oscillator normalizes this pressure into a percentage-style reading, making it easier to compare breakout strength across different market conditions.
Inputs:
Length:
Controls the lookback period used for the EMA, standard deviation, and pressure calculation.
Multiplier:
Controls the width of the volatility bands. Higher values create wider bands and require stronger movement to register breakout pressure.
Source:
Defines the price source used in the calculation.
Bullish Color:
Sets the color for bullish breakout pressure.
Bearish Color:
Sets the color for bearish breakout pressure.
Limitations:
- Strong readings may appear after a move is already extended.
- Low readings do not always mean the market is inactive.
- The oscillator does not provide automatic entries, exits, stop loss, or take profit levels.
- Breakout pressure can fail during fake breakouts or sharp reversals.
- It should be combined with market structure, volume, or trend context. Indicador
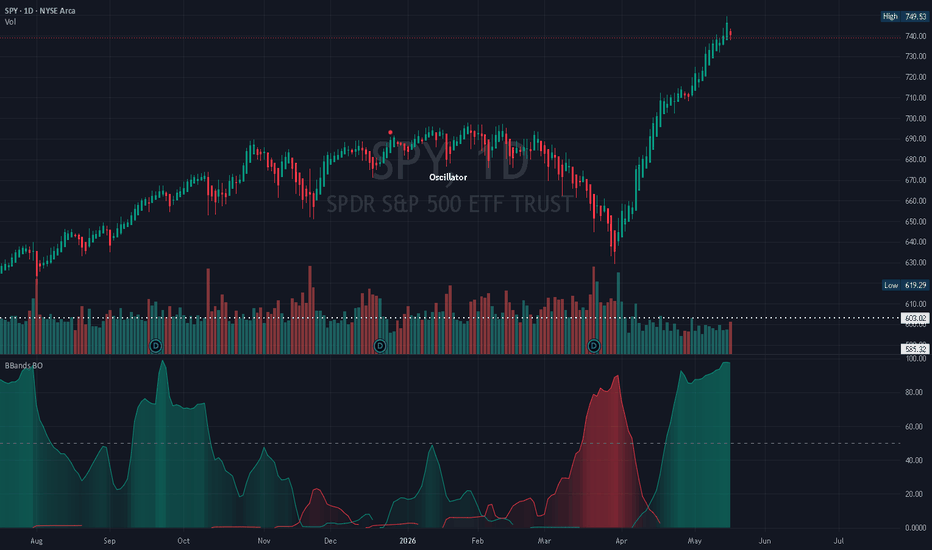
Squeeze Bollinger Bands Tracker [MarkitTick]💡 This institutional-grade analysis suite provides a sophisticated volatility-tracking environment designed to identify market compression phases and high-conviction breakouts. By integrating Bollinger Band standard deviation logic with Z-Score normalization and a non-linear sigmoid volatility engine, the script transforms raw price action into a multi-dimensional heatmap. This approach allows traders to distinguish between low-volatility "coiling" phases and institutional-driven momentum expansions, providing a clear visual representation of market energy.
● ✨ Originality and Utility
The Squeeze Bollinger Bands Tracker distinguishes itself through the implementation of a proprietary "Signal Engine" and a non-linear volatility grading system. Unlike standard Bollinger Band indicators that merely plot static lines, this tool actively monitors the rate of change in channel width relative to its own historical standard deviation.
• Dynamic Volatility Normalization
Most indicators rely on linear calculations that fail to account for the exponential nature of market expansion. This script utilizes a Z-Score calculation to determine how extreme a volatility move is compared to its history, then maps that value through a sigmoid function. This creates a "Heatmap" effect on the candles that reflects institutional participation levels rather than simple price movement.
• Institutional Breakout Grading
The utility is further enhanced by an automated grading system (Grades A, B, and C). By cross-referencing price spread (the distance between open and close) with actual volume metrics during a breakout, the script provides an objective measure of signal quality, helping traders filter out "fakeouts" that lack volume support.
● 🔬 Methodology and Concepts
The logic flow is divided into three core analytical pillars: Compression Detection, Momentum Normalization, and Signal Verification.
• Compression Detection (The Squeeze)
The script calculates the percentage-based width of the Bollinger Bands. When the current width falls below its SMA-based average, the market is classified as being in a "Squeeze" state. This signifies a period where market energy is being stored, often preceding a significant directional expansion.
• Sigmoid-Mapped Z-Score Volatility
To provide the neon heatmap coloring, the script calculates the Z-Score of the channel width. This tells us how many standard deviations the current volatility is from the mean. This Z-Score is then processed through a Sigmoid Function: 100 / (1 + exp(-Z-Score)). This mathematical transformation squashes the infinite Z-Score range into a 0–100 scale, creating a smooth gradient for the "True Institutional Heatmap."
• Breakout Validation Engine
Signals are not generated simply on a price cross. The Signal Engine (a custom User-Defined Type) calculates real-time Entry, Stop Loss (based on the previous basis line), and Take Profit levels. During the moment of crossover, the "calcGrade" method evaluates if the current bar's spread and volume are at least 150% of their historical averages to assign a Grade A "Institutional" breakout.
● 🎨 Visual Guide
The visual interface is designed with a high-contrast "3D Neon" aesthetic to ensure critical data points are immediately recognizable during fast-moving market conditions.
• The 3D Neon Channels
Upper Core & Glow: The upper Bollinger Band is rendered in Cyan (#00FFFF). It features three layers: a 2-pixel core for precision and two wider "Glow" layers with varying transparency (60% and 85%) to create a neon effect.
Lower Core & Glow: The lower band is rendered in Magenta (#FF00FF), following the same three-layer glow architecture to signify the support boundary.
Basis Core: The central moving average is rendered in Yellow (#FFFF00), acting as the dynamic mean and the primary stop-loss anchor.
• True Institutional Heatmap Candles
The candle colors are not fixed; they represent a gradient based on the Sigmoid Volatility score.
Bullish State: Transitions from a deep "Cold" Forest Green (#004D40) during low-volatility rises to a "Hot" Neon Green (#00FF00) during high-momentum surges.
Bearish State: Transitions from a deep "Cold" Purple (#4A148C) during low-volatility drops to a "Hot" Neon Red (#FF0000) during aggressive sell-offs.
Neutral State: Gray (#808080) candles appear when no definitive trend state is identified by the Signal Engine.
• Analytical Dashboard and Labels
Buy/Sell Labels: When a breakout occurs, a Cyan or Magenta label appears. It displays the signal Grade (A, B, or C) and the calculated E (Entry), TP (Take Profit), and SL (Stop Loss) values.
Institutional Analytics Dashboard: Located in the top-right, this table provides real-time data on Trend Maturity (in bars), Volatility State (Squeeze vs. Expanding), and the percentage proximity to the upper and lower breakout levels.
● 🔍 Deconstruction of the Underlying Scientific and Academic Framework
The indicator is built upon the foundation of Statistical Process Control and Information Theory. By treating price movement as a signal-to-noise problem, the script uses the following frameworks:
• Standard Deviation and Gaussian Distribution
The core of the Bollinger Band calculation relies on the assumption that price spends approximately 95% of its time within two standard deviations of the mean. The "Squeeze" logic identifies periods where the distribution is abnormally tight, suggesting an imminent return to the mean or a "Fat Tail" event (a breakout).
• Z-Score Normalization
In statistics, the Z-Score is used to compare observations from different data sets or time periods. By applying Z-Score logic to the width of the bands, the indicator removes the "unit" of price and focuses purely on the intensity of the volatility, allowing for a standardized comparison across different assets (e.g., Bitcoin vs. Apple).
• Non-Linear Sigmoid Mapping
The use of the Sigmoid function (common in Neural Network activation) serves to eliminate outliers in volatility data. This ensures that the candle heatmap provides meaningful color variations even during extreme "Black Swan" events, preventing the visual output from becoming saturated or unreadable.
● 📖 How to Use
Traders should focus on the transition between market states as displayed by the Analytics Dashboard and the Heatmap.
• Step 1: Identify the Squeeze
Monitor the "Volatility State" in the dashboard. When it displays "⚠️ SQUEEZE" in Neon Orange, the market is coiling. This is the preparation phase where no trades should be taken.
• Step 2: Evaluate the Breakout Grade
Wait for a "BUY" or "SELL" label to appear. Priority should be given to "Grade A" signals, as these indicate that both price spread and volume have significantly exceeded their 20-period averages, confirming institutional intent.
• Step 3: Execution and Risk Management
Upon a valid signal, the script provides an automated trade plan. The Stop Loss is set at the Basis (Yellow) line from the previous bar to allow for minor breathing room, while the Take Profit is projected at a 1:1 ratio relative to the width of the band at the time of entry.
● ⚙️ Inputs and Settings
The script provides granular control over the analytical engine and the visual experience.
• Channel Settings
Channel Length: Controls the SMA window for the Bollinger Bands (Default: 20).
Standard Deviation Multiplier: Adjusts the width of the neon boundaries (Default: 2.0).
• Analytics Settings
Squeeze/Z-Score Length: Determines the lookback period used to define what constitutes "average" volatility (Default: 50).
Quality SMA Length: Defines the window for the Grade A/B/C volume and spread verification (Default: 20).
• Color and Heatmap Settings
Users can fully customize the Neon Upper/Lower colors, the Dashboard background transparency, and the specific "Cold" and "Hot" thresholds for the candle gradient engine to match their preferred dark or light chart theme.
⚠️ Disclaimer
All provided scripts and indicators are strictly for educational exploration and must not be interpreted as financial advice or a recommendation to execute trades. I expressly disclaim all liability for any financial losses or damages that may result, directly or indirectly, from the reliance on or application of these tools. Market participation carries inherent risk where past performance never guarantees future returns, leaving all investment decisions and due diligence solely at your own discretion. Indicador