Gold Macro Dashboard [invincible3]Gold Macro Indicator Dashboard
A professional macro-driven gold dashboard designed to evaluate the broader gold market regime using automatically sourced TradingView data. The indicator combines real yields, dollar strength, rate expectations, risk-off demand, gold breadth, and confirmation ratios into a single 0–100 Gold Macro Score.
The model uses a fixed daily macro timeframe, so dashboard readings stay consistent across intraday, daily, and weekly charts.
Main Features
Fixed Daily macro scoring
0–100 Gold Macro Score oscillator
Macro Regime classification
Macro Strength score
Real Yield driver
DXY / US Dollar driver
Gold liquidity proxy
US 2Y rate outlook
VIX risk-off signal
Cross-currency gold breadth
Gold/Silver ratio
Gold/S&P 500 ratio
Copper/Gold ratio
US 10Y–2Y yield spread
Crypto-style clean dashboard layout
Dark/light theme adaptive colors
No manual macro inputs
Score Interpretation
80–100: Strong Bull
60–80: Bullish
40–60: Neutral
20–40: Bearish
0–20: Strong Bear
How It Works
The composite score is weighted as follows:
Real Yield 10Y: 30%
US Dollar DXY: 25%
Gold liquidity proxy: 15%
US 2Y rate outlook: 10%
Risk-Off VIX: 10%
Gold breadth: 10%
Gold breadth checks whether gold is trending higher across major currencies, including XAUUSD, XAUEUR, XAUJPY, XAUGBP, and XAUCNH.
Use Case
This indicator is designed for traders and investors who want a macro-level view of gold’s trend quality. It can help identify whether gold strength is supported by broad macro conditions or only short-term price movement.
Disclaimer
This is an educational macro model only. It is not financial advice and should not be used as a standalone buy or sell signal. Always combine it with your own risk management, technical analysis, and market research. Indicador

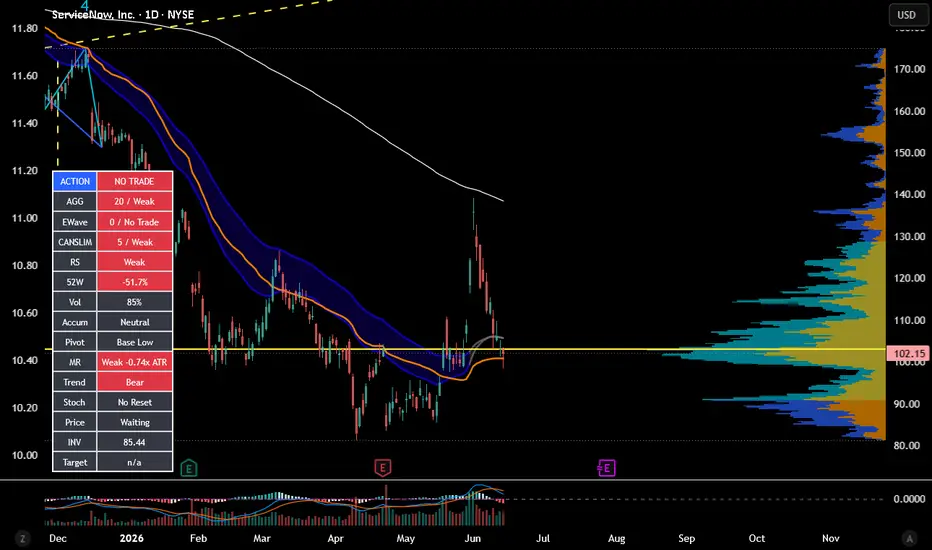
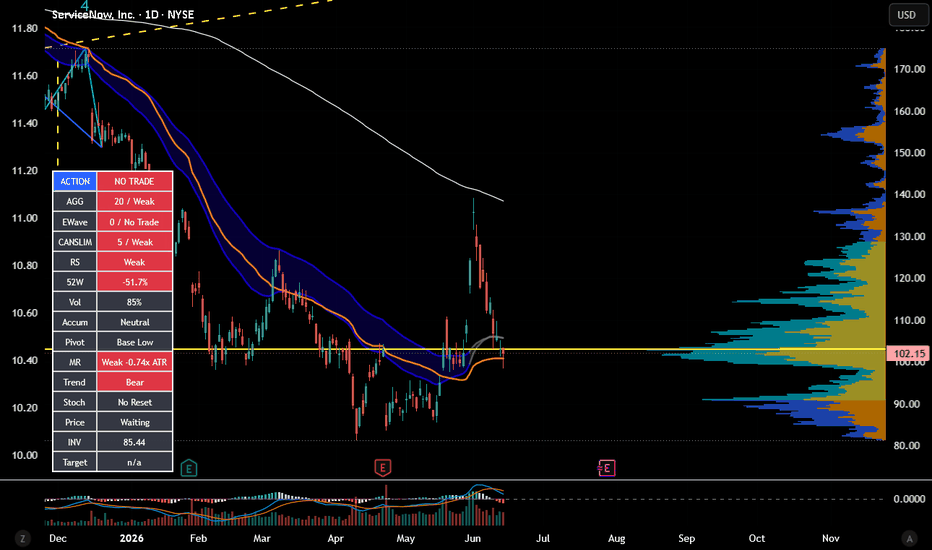
SteveFi Trade CockpitThe dashboard has 15 rows:
| Row | Purpose |
| ----------- | ---------------------------------------------------- |
| **ACTION** | Final decision output |
| **AGG** | Weighted overall score using all 13 major attributes |
| **EWave** | Elliott/Wolfe/Stoch/RSI-style timing score |
| **CANSLIM** | CANSLIM-style technical quality score |
| **RS** | Relative strength vs QQQ |
| **52W** | Distance from 52-week high |
| **Vol** | Current volume vs average volume |
| **Accum** | Accumulation vs distribution pressure |
| **Pivot** | Whether price is near a breakout/pivot area |
| **MR** | Mean reversion / extension risk |
| **Trend** | Overall trend structure |
| **Stoch** | Momentum reset/exhaustion |
| **Price** | Price action confirmation |
| **INV** | Invalidation level |
| **Target** | Potential upside target |
The color coding is:
| Color | Meaning |
| ------------- | ---------------------------------------------- |
| **Green** | Positive / bullish |
| **Orange** | Watch / caution / constructive but not perfect |
| **Dark gray** | Neutral / waiting |
| **Red** | Negative / risk / failure |
---
# 1. ACTION
This is the **main output**.
Possible values:
| ACTION | Meaning |
| ------------------ | --------------------------------------------------------------------------------- |
| **BUY TRIGGER** | Aggregate score is strong, price confirms, not invalidated, and not too stretched |
| **BUY WATCH** | Setup is building, but not fully confirmed |
| **TRIM / CAUTION** | Momentum may be rolling over or price is stretched |
| **WAIT** | Some positives exist, but not enough for action |
| **NO TRADE** | Weak overall setup |
| **INV** | Invalidation level broke. Setup failed. |
The action row is based mostly on **AGG**, not just EWave.
Current logic:
```text
BUY TRIGGER =
AGG >= 80
AND Price is Confirmed
AND not invalidated
AND MR is not Stretched
```
If you turn on:
```text
Require CANSLIM Filter for BUY TRIGGER
```
Then BUY TRIGGER also requires a minimum CANSLIM-quality pass.
That is the stricter version.
---
# 2. AGG
**AGG** is the most important score now.
It is the weighted aggregate score based on all major dashboard factors. This is the “whole chart quality” score.
Current weighting:
| Attribute | Weight |
| ----------- | -----: |
| **CANSLIM** | 21% |
| **RS** | 13% |
| **Price** | 12% |
| **Trend** | 10% |
| **Pivot** | 10% |
| **52W** | 8% |
| **EWave** | 8% |
| **Vol** | 6% |
| **MR** | 5% |
| **Accum** | 3% |
| **Stoch** | 2% |
| **INV** | 1% |
| **Target** | 1% |
This weighting intentionally makes the dashboard **less wave-heavy**.
The thinking is:
> Great stocks with strong RS and confirmed price action matter more than a possible wave count.
AGG grades:
| AGG Score | Grade | Meaning |
| -----------: | ----- | ---------------------------------- |
| **85+** | A+ | Excellent |
| **80–84** | A | Strong / trigger zone if confirmed |
| **70–79** | B | Good watchlist setup |
| **60–69** | C | Developing but not there yet |
| **50–59** | D | Weak / wait |
| **Under 50** | Weak | No trade |
How I’d use it:
| AGG | Interpretation |
| -----------: | ------------------------------------------------- |
| **80+** | Potential action zone |
| **70–79** | Watch closely |
| **60–69** | Setup forming, still early |
| **Under 60** | Probably ignore unless you have a separate thesis |
---
# 3. EWave
**EWave** is the Elliott/Wolfe-style timing score.
It uses:
| EWave Component | Points |
| --------------------------------------------- | -----: |
| Bullish trend context | 20 |
| Fib pullback / possible Wave 2 or Wave 4 zone | 20 |
| RSI bullish divergence | 20 |
| Stoch reset | 15 |
| Wolfe-like structure | 10 |
| Price action confirmation | 10 |
Maximum is **95**.
Dashboard examples:
| EWave | Meaning |
| ----------------------- | ------------------------ |
| **75+ / A** | Strong wave/timing setup |
| **60–74 / B Watch** | Setup is building |
| **40–59 / C Early** | Early or incomplete |
| **Under 40 / No Trade** | Weak timing setup |
Important: **EWave is only 8% of AGG now.**
That means it helps with timing, but it does not dominate the decision.
Best interpretation:
> EWave tells you whether the pullback/structure/timing looks constructive.
It does **not** mean “this is definitely Wave 3.”
---
# 4. CANSLIM
**CANSLIM** is a technical approximation of CANSLIM-style stock quality.
It does not use IBD’s proprietary EPS, sales, or fund ownership data. TradingView cannot reliably recreate that from Pine.
Instead, it uses technical leadership proxies:
| CANSLIM Component | Points |
| ---------------------------- | -----: |
| RS vs benchmark | 20 |
| RS line near/new high | 15 |
| Distance from 52-week high | 15 |
| Volume vs average | 15 |
| Accumulation vs distribution | 15 |
| Pivot/base status | 20 |
Maximum is **100**.
Grades:
| CANSLIM Score | Grade | Meaning |
| ------------: | ----- | -------------------------------------- |
| **80+** | A | Strong CANSLIM-style technical profile |
| **65–79** | B | Good |
| **50–64** | C | Mixed |
| **Under 50** | Weak | Not acting like a leader |
This is now the **largest weight in AGG** at **21%**.
That’s intentional.
The dashboard is saying:
> Stock quality and leadership come first. Timing comes second.
---
# 5. RS
**RS** means relative strength versus the benchmark, currently defaulted to **QQQ**.
It compares the stock’s performance to QQQ over the selected lookback period.
Possible values:
| RS | Meaning |
| ---------- | ------------------------------------------------------------------------- |
| **Strong** | Stock is outperforming QQQ and its RS line is above its RS moving average |
| **OK** | Stock is outperforming QQQ, but not as strongly |
| **Weak** | Stock is underperforming QQQ |
Why this matters:
CANSLIM-style trading wants **leaders**, not laggards.
A stock with **RS Strong** is showing better demand than the market.
Best read:
| RS | Interpretation |
| ------------------ | ------------------------ |
| **Strong / green** | Good leader behavior |
| **OK / orange** | Acceptable but not elite |
| **Weak / red** | Caution |
---
# 6. 52W
**52W** shows how far the stock is from its 52-week high.
Example:
```text
-6.1%
```
Means the stock is 6.1% below its 52-week high.
Interpretation:
| 52W Distance | Meaning |
| ---------------: | ----------------- |
| **0% to -5%** | Very strong |
| **-5% to -15%** | Good / acceptable |
| **-15% to -25%** | Caution |
| **Below -25%** | Weak / damaged |
Why it matters:
CANSLIM usually prefers stocks near highs, not stocks buried far below highs.
A stock near highs is often showing institutional demand.
---
# 7. Vol
**Vol** shows current volume as a percentage of average volume.
Example:
```text
89%
```
Means current volume is 89% of the average volume.
Interpretation:
| Vol | Meaning |
| -------------- | --------------------------------------- |
| **140%+** | Strong demand / breakout-quality volume |
| **100–139%** | Decent |
| **Under 100%** | Light / not confirmed |
Why it matters:
A breakout or strong move is more convincing when volume expands.
For CANSLIM-style buying, strong volume gives confirmation that bigger buyers may be involved.
One note: on intraday bars or during the trading day, volume can look low until the day completes. On daily charts, interpret it best near/after the close.
---
# 8. Accum
**Accum** tries to detect whether the stock has more accumulation or distribution pressure.
It compares:
* Up days on above-average volume
* Down days on above-average volume
Possible values:
| Accum | Meaning |
| ----------- | ----------------------------------------------------- |
| **Accum** | More heavy-volume up days than heavy-volume down days |
| **Neutral** | No clear edge |
| **Distrib** | More heavy-volume down days than up days |
Why it matters:
CANSLIM cares about institutional accumulation.
A stock can look okay on price, but if it is under distribution, the setup is lower quality.
---
# 9. Pivot
**Pivot** tells you where price is relative to a recent breakout/base area.
It uses the recent high over the base lookback period as a rough pivot reference.
Possible values:
| Pivot | Meaning |
| --------------- | ---------------------------------------------- |
| **Breakout** | Price broke above pivot with strong volume |
| **Near Pivot** | Price is within about 5% below the pivot |
| **Above Pivot** | Price is above pivot, but volume is not strong |
| **Extended** | Price is more than about 5% above pivot |
| **Base Low** | Price is not near a useful pivot area |
Why it matters:
The best setups are often near proper buy areas.
For your dashboard:
| Pivot | Interpretation |
| ----------------------- | ------------------ |
| **Breakout / green** | Strong |
| **Near Pivot / orange** | Watch closely |
| **Extended / red** | Be careful chasing |
| **Base Low / gray** | Not actionable yet |
---
# 10. MR
**MR** means mean reversion / extension risk.
It measures how far price is from the fast EMA using ATR.
Example:
```text
Extended 1.73x ATR
```
Means price is 1.73 ATR above the fast EMA.
Possible values:
| MR | Meaning |
| ------------- | ---------------------------------------------------------- |
| **Discount** | Price pulled back below fast EMA but remains above mid EMA |
| **Normal** | Price is within normal range of fast EMA |
| **Extended** | Price is above normal range |
| **Stretched** | Price is too far extended |
| **Weak** | Price is below mid EMA |
| **n/a** | Not enough data |
Why this matters:
This row helps prevent chasing.
A stock can be strong but too extended for a fresh entry.
Important trigger rule:
```text
BUY TRIGGER cannot fire if MR = Stretched
```
That’s a guardrail.
Best read:
| MR | Interpretation |
| --------------------- | ------------------------ |
| **Discount / green** | Pullback zone |
| **Normal / neutral** | Healthy |
| **Extended / orange** | Be careful |
| **Stretched / red** | Probably not a fresh buy |
| **Weak / red** | Structure may be broken |
---
# 11. Trend
**Trend** gives the broader moving-average structure.
Possible values:
| Trend | Meaning |
| --------------- | ------------------------------------------------------------------- |
| **Bull Strong** | Price above mid EMA, fast EMA above mid EMA, mid EMA above long SMA |
| **Bull Basic** | Price and fast trend are above mid EMA |
| **Neutral** | Mixed |
| **Bear** | Price and averages are bearish |
This row is important because you generally want to buy pullbacks in strong trends, not fight broken charts.
Best setup:
```text
Trend = Bull Strong
```
---
# 12. Stoch
**Stoch** shows Stochastic momentum condition.
Possible values:
| Stoch | Meaning |
| ------------- | ------------------------------------------------------------ |
| **Reset** | Stoch recently got oversold/reset and is turning back up |
| **K>D** | Momentum is positive, but not necessarily from a fresh reset |
| **Roll Over** | Stoch was overbought and crossed down |
| **No Reset** | No useful signal |
Why this matters:
This came from the original HeidingOut-style method:
> Price action leads, Stoch/RSI confirm.
Best entry setup:
```text
Stoch = Reset
```
Caution setup:
```text
Stoch = Roll Over
```
But Stoch is only **2% of AGG** now because oscillators can be noisy.
---
# 13. Price
**Price** is one of the most important rows.
It checks whether price action has actually confirmed.
It requires:
* Higher-low structure
* Close above fast EMA
* Bullish candle
* Close above prior bar high
Possible values:
| Price | Meaning |
| ------------- | -------------------------------------------- |
| **Confirmed** | Price action supports the setup |
| **Waiting** | Setup may exist, but price has not confirmed |
This is weighted **12%** in AGG, which is high.
Why?
Because a setup without price confirmation is still just a possibility.
A BUY TRIGGER requires:
```text
Price = Confirmed
```
---
# 14. INV
**INV** is the invalidation level.
This is the key structural low from the detected impulse/pullback logic.
Plain English:
> If price closes below this level, the setup is probably broken.
Possible values:
| INV | Meaning |
| ----------- | --------------------------------- |
| Price level | Key invalidation reference |
| n/a | Not enough structure detected yet |
Important:
If price breaks below INV, ACTION becomes:
```text
INV
```
Invalidation overrides everything.
Even if RS is strong and CANSLIM is good, a broken structure means the setup has failed.
---
# 15. Target
**Target** shows the projected upside target and upside percentage.
It uses a **1.618 Fib extension** from the detected impulse.
Example:
```text
145.20 / +12.4%
```
Means:
* Potential target: 145.20
* Upside from current price: +12.4%
This is intentionally weighted only **1%** in AGG.
Why so low?
Because targets are estimates. Useful, but not reliable enough to drive the decision.
Use Target as:
> “Is there enough upside to justify the risk?”
Not as:
> “This will definitely go there.”
---
# How the AGG score thinks
The new AGG is intentionally biased toward objective leadership and confirmation.
Current hierarchy:
## Most important
* CANSLIM
* RS
* Price
* Trend
* Pivot
These answer:
> Is this a quality leader acting correctly?
## Middle importance
* 52W
* EWave
* Vol
* MR
These answer:
> Is it near highs, reasonably timed, supported by volume, and not too stretched?
## Lower importance
* Accum
* Stoch
* INV
* Target
These help, but do not dominate.
---
# How to read a good setup
A very good setup would look like:
| Row | Ideal |
| ------- | -------------------------- |
| ACTION | BUY TRIGGER |
| AGG | 80+ |
| EWave | 60+ |
| CANSLIM | 65+ |
| RS | Strong |
| 52W | Better than -15% |
| Vol | 100%+ or 140%+ on breakout |
| Accum | Accum |
| Pivot | Near Pivot or Breakout |
| MR | Normal or Discount |
| Trend | Bull Strong |
| Stoch | Reset or K>D |
| Price | Confirmed |
| INV | Below nearby structure |
| Target | Positive upside |
That is the kind of dashboard that says:
> This is worth real attention.
---
# How to read your ALAB screenshot
From your screenshot, the dashboard looked roughly like:
| Row | Reading |
| ------- | ------------------ |
| ACTION | WAIT |
| EWave | 40 / C Early |
| CANSLIM | 57 / C |
| RS | Strong |
| 52W | -6.1% |
| Vol | 89% |
| Accum | Accum |
| Pivot | Near Pivot |
| MR | Extended 1.73x ATR |
| Trend | Bull Strong |
| Stoch | K>D |
| Price | Waiting |
| Target | n/a |
That says:
**Good stock. Strong RS. Near highs. In a bullish trend. But not confirmed yet, volume is light, and price is a little extended.**
So **WAIT** makes sense.
It is not saying “bad stock.”
It is saying:
> Good candidate, but not a clean entry yet.
---
# The key dashboard philosophy
This is now the right structure:
## CANSLIM finds the leader
Rows:
* CANSLIM
* RS
* 52W
* Vol
* Accum
* Pivot
## EWave helps timing
Rows:
* EWave
* Stoch
* Price
* MR
## Risk/reward controls the trade
Rows:
* INV
* Target
* MR
## AGG combines it all
AGG answers:
> Overall, is this setup strong enough to act on?
---
# My simple decision rules
Use it like this:
## BUY TRIGGER
Only consider buying when:
* ACTION = BUY TRIGGER
* AGG is 80+
* Price is Confirmed
* MR is not Stretched
* INV is clear
* Target gives enough upside
## BUY WATCH
Put on watchlist when:
* ACTION = BUY WATCH
* RS is Strong
* CANSLIM is at least C/B
* Pivot is Near Pivot
* Price is Waiting
## WAIT
Do nothing when:
* Stock is good, but price is not confirmed
* MR is extended
* Volume is not there
* EWave is early
## TRIM / CAUTION
Consider trimming when:
* Stoch rolls over
* MR becomes Stretched
* Price action weakens after a run
## INV
Respect it.
If INV triggers, the setup is broken. Reassess from scratch.
Indicador
Indicador
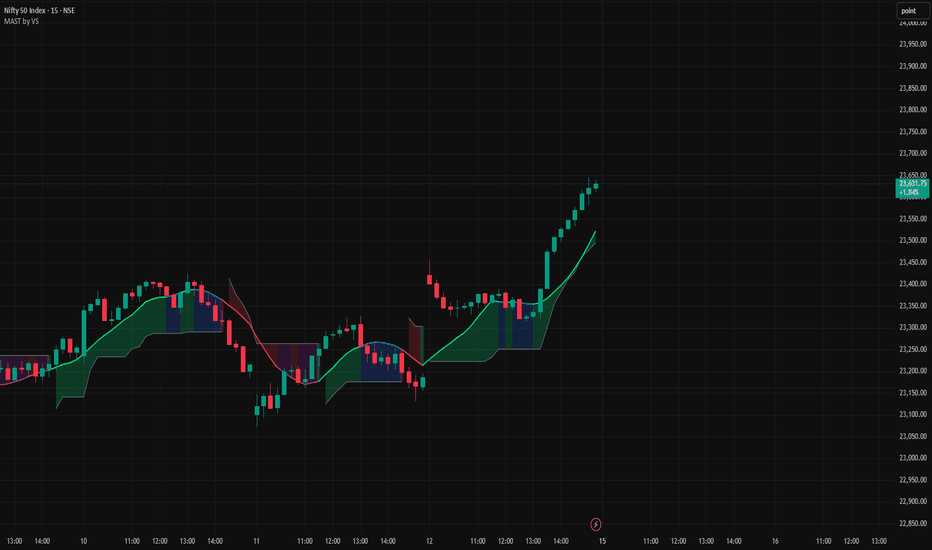
RSI Overpowered [Cartel Console]# RSI Overpowered
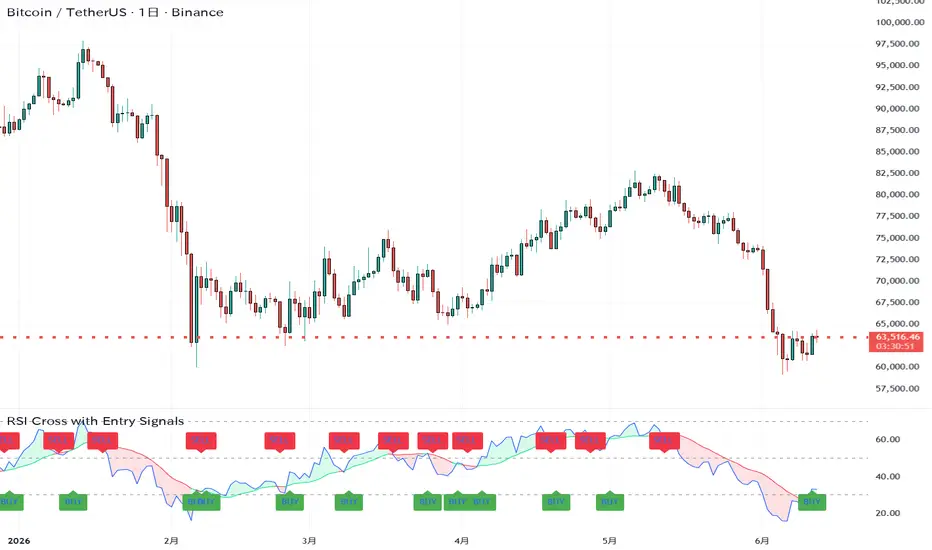
RSI Overpowered is a momentum and volume-pressure analysis tool designed to provide a broader view of market strength by combining multiple volume-based market internals into a single composite oscillator framework.
Instead of relying solely on traditional price-based RSI calculations, this indicator incorporates Relative Strength Index calculations derived from Positive Volume Index (PVI), Negative Volume Index (NVI), and On-Balance Volume (OBV). These components are blended into a Composite RSI that aims to highlight shifts in participation, accumulation, distribution, and momentum conditions.
The indicator includes multiple layers of analysis:
• Composite RSI built from PVI, NVI, and OBV RSI values
• Smoothed signal line for trend and momentum comparison
• Secondary RSI oscillator derived from the composite calculation
• Configurable overbought and oversold zones
• Trend filtering using Supertrend methodology
• Bullish and bearish momentum signals with trend confirmation
• Divergence detection between price and the Composite RSI
• Dynamic area fills and visual momentum shading
• Built-in alert conditions for key events
### How It Works
The script first calculates three independent volume-based indexes:
• Positive Volume Index (PVI)
• Negative Volume Index (NVI)
• On-Balance Volume (OBV)
An RSI is then calculated for each component. The average of these values forms the Composite RSI, which is subsequently smoothed to reduce noise and improve readability.
A secondary RSI oscillator is generated from the Composite RSI itself, creating an additional layer of momentum analysis that can help identify shifts in directional strength.
### Trend Confirmation
To reduce counter-trend signals, the indicator incorporates a Supertrend-based trend filter.
Bullish momentum signals are generated only when the trend filter indicates a bullish environment.
Bearish momentum signals are generated only when the trend filter indicates a bearish environment.
This approach helps align momentum events with broader directional market conditions.
### Divergence Detection
The indicator automatically searches for potential divergences between price action and the Composite RSI.
Bullish divergence may occur when price forms a lower low while the Composite RSI forms a higher low.
Bearish divergence may occur when price forms a higher high while the Composite RSI forms a lower high.
Divergence signals are visualized directly on the oscillator using pivot-based detection logic.
### Visualization Features
• Composite RSI line
• Smoothed signal line
• Dynamic momentum fills
• Overbought and oversold markers
• Trend-filtered signal circles
• Divergence labels and connecting lines
• Momentum gradient visualization
### Alerts Included
• Bullish Momentum Signal
• Bearish Momentum Signal
• Overbought Event
• Oversold Event
### Notes
This indicator is intended for market analysis and educational purposes only. Signals, divergences, trend filters, and oscillator conditions should be used alongside a complete trading plan and appropriate risk management techniques.
No indicator can guarantee future market outcomes, and all market decisions remain the responsibility of the user.
Indicador

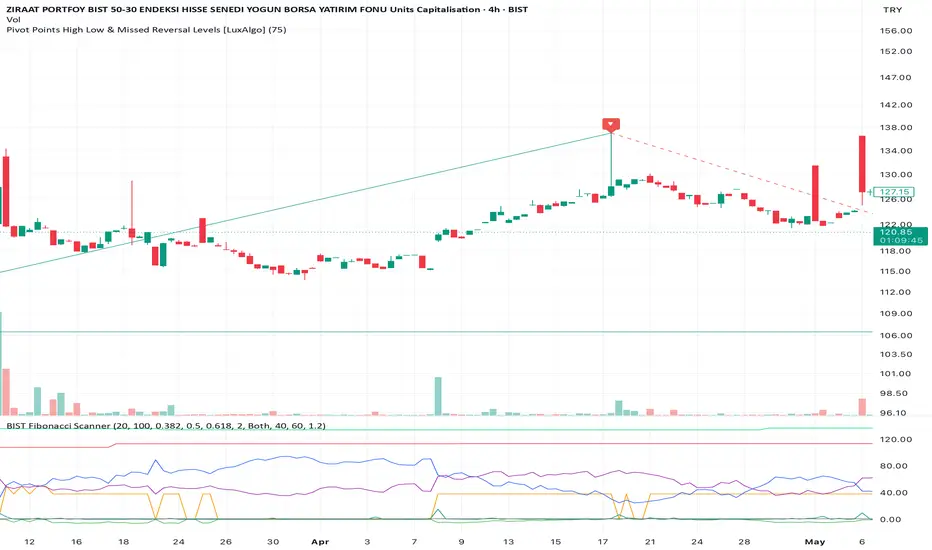
Sentiment Divergence Tracker The "Sentiment Divergence Tracker" is a sophisticated quantitative analysis tool designed to identify statistical anomalies between two correlated financial assets. By monitoring the relative price movement of a primary asset against a correlated counterpart, this indicator highlights "Divergence Zones" that often precede significant market reversals or mean reversions.
Core Functionality:
Traditional technical analysis often ignores the relationship between inter-market assets. This indicator bridges that gap by normalizing percentage-based price fluctuations, allowing for a clean, comparative view of market sentiment.
Key Features:
Dynamic Divergence Calculation: Utilizes standard deviation and moving average models to calculate the "Fair Value" gap between two assets.
Automated Support/Resistance Mapping: Rather than manual drawing, the indicator plots dynamic support lines that adjust based on market volatility, helping traders identify institutional "value areas."
Oversold/Overbought Detection: Visualizes extreme deviations where the price has stretched too far from its correlated pair, signaling high-probability reversal setups.
Institutional Context: Useful for identifying liquidity pockets where "Smart Money" might be accumulating or distributing based on inter-market relationships.
How to Interpret:
Baseline (0.0): Represents the equilibrium point where both assets are moving in perfect correlation.
Divergence Line: The primary blue plot. When this line moves away from the baseline, it indicates a weakening correlation.
Support/Resistance Levels: These are not static lines but dynamic boundaries. A touch or breach of these levels typically indicates that the asset is statistically "oversold" or "overbought" relative to its pair.
Trade Execution: Look for "Mean Reversion" entries when the Divergence Line exhausts its momentum at the support/resistance boundaries and begins to curl back toward the baseline.
Recommended Settings:
Timeframe: Optimized for 15-minute to 4-hour charts for intraday and swing trading.
Correlated Pair Selection: Ensure the "Correlated Asset" input matches a highly correlated instrument (e.g., Gold/Silver, or major Currency/Index pairs).
Volatility Sensitivity: Adjust the lookback period in the settings to suit your specific asset's volatility profile.
Disclaimer:
This tool is intended for analytical purposes and does not constitute financial advice. Always integrate this indicator with your existing risk management strategy and technical confirmation (e.g., candlestick patterns, order blocks Indicador

Indicador

Indicador

Volume Analysis TMFWhat This Indicator Does
This professional-grade volume analysis indicator helps traders identify significant volume events and track subsequent price reactions. By analyzing volume patterns and—for Pro users—real footprint buy/sell data, it reveals where institutional interest is concentrated and when breakouts from these high-volume zones are likely to occur.
Core Purpose:
• Detect abnormally high-volume candles that indicate institutional activity
• Automatically draw boxes around these high-volume zones
• Monitor when price breaks out of these zones (both early and mature breakouts)
• Provide visual and alert-based signals for potential trading opportunities
• Display real-time volume metrics in an easy-to-read table
Who This Is For :
• Day traders looking for volume confirmation on breakouts
• Swing traders identifying key support/resistance zones based on volume
• Order flow traders (Pro users) analyzing buy/sell aggression
• Traders wanting to understand when volume is truly "significant"
Advanced Original Unique Key Features
Dynamic Box Management : Automatically draws boxes around high-volume candles and extends them forward in real-time . Unlike static lines, boxes track price action continuously and adapt to market movement
Sequential Streak Logic : When multiple high-volume candles occur consecutively, only the highest volume candle gets a box . Prevents chart clutter while preserving the most significant volume event
Two-Stage Breakout Detection : Separate signals for early breakouts (<10 bars) vs mature breakouts (≥10 bars) . Allows traders to distinguish between immediate momentum vs delayed confirmation
One-Time Signal Firing : Each box can trigger a breakout signal only once . Prevents repetitive alerts on the same zone, reducing noise
Footprint Integration : For Pro users: displays real buy/sell volume percentages and cumulative delta. Reveals whether buying or selling pressure dominated the volume candle
10-Bar Historical Table : Shows last 10 bars of volume metrics in a color-coded table . Quick visual comparison of recent volume patterns at a glance
Conditional Coloring : Table cells change color based on volume anomalies (e.g., 2× previous sell volume) . Instant visual identification of unusual activity
Table Color Coding (Pro Mode):
• Buy % Cell: Green if Buy > Sell × 1.5 or Buy > Previous Sell × 2
• Sell % Cell: Red if Sell > Buy × 1.5 or Sell > Previous Buy × 2
• Total Volume Cell: Blue if Volume > Avg × 1.5
• Delta Cell: Green if positive, Red if negative
• Cumulative Delta Cell: Green if positive, Dark Red if negative
📖 Step-by-Step Usage Guide
Recommended Default Settings:
├── Lookback Period: 200 (adjust down for faster response)
├── Volume Multiplier: 3.0 (lower = more signals, higher = only extreme volume)
├── Bull Box Color: #4caf4f1e (semi-transparent green)
├── Bear Box Color: #ff52521f (semi-transparent red)
├── Pro User Mode: ON if you have TradingView Pro
Step 2: Identify High-Volume Zones
• Look for 🟡 yellow triangles below candles
• Note the box drawn around that candle (extends forward in time)
• The box represents the high-volume zone's price range
Step 3: Watch for Breakouts
• Within 10 bars: Green/red triangles appear immediately
• After 10 bars: Only alerts (no triangles) to avoid clutter
• Breakout direction = potential trade direction
Step 5: Confirm with Table Data (Pro Users)
• Check Buy/Sell percentages: Higher percentage indicates dominant side
• Look for Delta > 0 (bullish) or < 0 (bearish)
• Monitor Cumulative Delta trend
Table Display Specifications : Last 10 candle data shows
The indicator creates a table at the bottom center of your chart showing:
Column Data (Standard) Data (Pro Mode)
1 Total Volume Total Volume
2 (Hidden) Buy %
3 (Hidden) Sell %
4 (Hidden) Delta
5 (Hidden) Cumulative Delta
⚙️ Optimal Settings by Trading Style
Trading Style Lookback Multiplier Pro Mode Best Timeframe
Scalping 100 -200 3 Optional 1-5 min
Day Trading 200-300 5 Recommended 15 min-1 hour
Swing Trading 300-500 5 Optional 4 hour-daily
Position Trading 500-1000 8 Not needed daily
Disclaimer :
THIS INDICATOR IS PROVIDED FOR EDUCATIONAL AND INFORMATIONAL PURPOSES ONLY.
NOT FINANCIAL ADVICE Nothing in this indicator or its documentation constitutes financial advice, investment advice, trading advice, or any other type of professional advice. You should consult with qualified professionals before making any financial decisions.
NO PROFIT GUARANTEES
Past performance of this indicator does not guarantee future results.
Volume patterns that worked historically may not work in the future.
Market conditions change, and no indicator is 100% accurate.
TRADING RISKS
Trading financial markets involves substantial risk of loss.
You can lose all of your invested capital.
Never trade with money you cannot afford to lose.
Consider using stop-losses and proper position sizing.
Indicador

Indicador

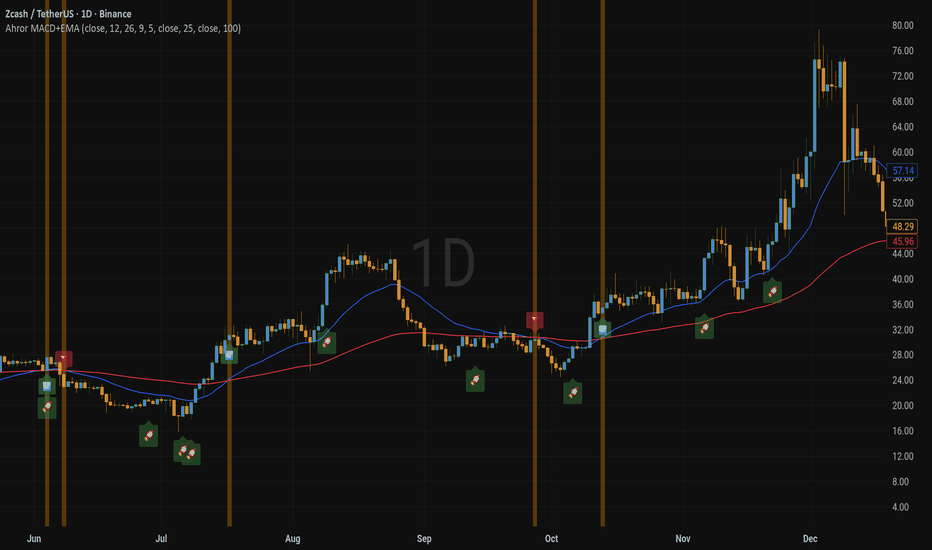
VSA Volume with alerts# VSA Volume with alerts
This indicator is inspired by Volume Spread Analysis (VSA) and Wyckoff methodology, helping traders quickly identify significant volume events and understand the relationship between volume, price spread, and closing position within the bar.
## Features
### Volume Classification
Volume is compared against a Wilder Moving Average of volume and categorized into:
* Ultra High Volume
* Very High Volume
* High Volume
* Normal Volume
* Low Volume
* Very Low Volume
### Color-Coded Volume Bars
* Purple = Ultra High Volume
* Red = Very High Volume
* Orange = High Volume
* Green = Normal Volume
* Blue = Low Volume
* Silver = Very Low Volume
This allows traders to instantly spot unusual activity and potential professional participation.
### VSA Bar Analysis
For every Very High or Ultra High Volume bar, the script evaluates:
**Bar Direction**
* Up Bar
* Down Bar
* Neutral Bar
**Spread Analysis**
* Wide Spread
* Normal Spread
* Narrow Spread
**Close Position**
* Close Near High
* Close Mid Range
* Close Near Low
### Smart Alerts
Dynamic alerts provide detailed VSA information such as:
"ULTRA HIGH VOLUME | UP BAR | WIDE SPREAD | CLOSE NEAR HIGH"
or
"VERY HIGH VOLUME | DOWN BAR | WIDE SPREAD | CLOSE NEAR LOW"
This enables traders to monitor potential accumulation, distribution, buying climaxes, selling climaxes, stopping volume, and other important VSA events without constantly watching charts.
## How It Can Be Used
The indicator is designed to help identify:
* Professional buying and selling activity
* Potential accumulation zones
* Potential distribution zones
* Climactic volume events
* Effort vs Result relationships
* Possible reversals and continuation signals
## Notes
This indicator is intended as a volume-analysis tool and should be used alongside price structure, support/resistance, trend analysis, and proper risk management. It does not generate buy or sell signals and should not be used as a standalone trading system.
Inspired by the principles of Richard D. Wyckoff and Volume Spread Analysis (VSA).
Indicador

Indicador

Indicador

Indicador

Indicador
Indicador

ORB Strategy Timo v14ORB Strategy — Timo v2
🔷 Opening Range Breakout — Complete Trading System
The most complete ORB indicator for futures traders. Built specifically for NQ, MNQ, MGC and MCL — but works on any instrument and timeframe.
This is not just an ORB box. It's a full trading system combining breakout detection, trend filters, volume confirmation, trap protection and a live multi-timeframe dashboard — all in one script.
⚡ What makes this different
Most ORB indicators just draw a box. This one tells you:
✅ Is the breakout real — or a fake (Trap Detection)
✅ Is the trend aligned — EMA 9/21/50 filter
✅ Is the volume confirming — Volume Spike analysis
✅ Is the setup worth taking — Quality Score 0–100
✅ What are all timeframes doing — MTF Dashboard M1–D1
📦 Features (14 total)
ORB Box & Sessions
Two independent sessions: London Open (03:00–03:15 ET) and NY Open (09:30–09:45 ET)
Session box grows live during the window, freezes at close
Zone remains visible all day until 00:00 ET midnight reset
Both London AND NY zones visible simultaneously after 15:45 CET
ORH / ORL labels at each level
Equilibrium line at 50% of range (style, width, color all adjustable)
All colors independently configurable per session
EMA 9 / 21 / 50
Three exponential moving averages as trend filter
EMA 9 > 21 = bullish → only BUY signals allowed
EMA 9 < 21 = bearish → only SELL signals allowed
EMA± cross markers at every crossover
All colors and widths adjustable
VWAP
Daily volume-weighted average price
Institutional reference level — smart money reference
VP± cross markers at every crossover
Color and width adjustable
BUY / SELL Signals
Signal arrow appears only when ALL active filters confirm simultaneously:
M1 close outside ORB range (breakout)
EMA alignment in breakout direction
Price on correct VWAP side
Optional: M15 / M5 close confirmation
Optional: First signal per session only
Signal Filters (5 total, all individually toggleable)
Filter
Default
Purpose
EMA Alignment
ON
No counter-trend trades
VWAP Side
ON
With institutional flow
M15 Confirmation
OFF
Safer, fewer signals
M5 Confirmation
OFF
Additional confirmation
First Signal Only
ON
Max 1 trade per session
SL / TP Lines
Automatic dotted lines at signal: Entry (white), SL (red), TP (green)
Price labels right side showing exact levels
Fully configurable: ticks, colors, line length
Linear Regression Trend Channel
2x Standard Deviation channel (covers ~95% of price action)
Dynamic midline: green = uptrend, red = downtrend
Channel width (length), colors, fill all adjustable
MTF Dashboard
Live multi-timeframe bias table (position adjustable):
7 timeframes: M1 · M5 · M15 · M30 · H1 · H4 · D1
Green dot = EMA9 > EMA21 (bullish) | Red dot = bearish
Current signal: BUY / SELL / NEUTRAL
Live ORB levels + Volume ratio + Quality Score
Volume Spike
Color-coded histogram (green/red per candle, gold on spike)
Configurable spike threshold (default: 1.5x average)
Vol label at signal: "VOL SPIKE 2.3x CONFIRMED" or "Vol 0.8x (no spike)"
MA length adjustable
ORB Quality Score (0–100)
Rates the ORB range before you trade:
70–100: SETUP GOOD → Range is ideal, take the trade
40–69: SETUP OK → Acceptable, trade carefully
0–39: SETUP WEAK → Too small or too large, wait
Based on ATR(14) ratio — label appears right after ORB close
Red background warning when score < 40
Trap Detection
Identifies fake breakouts automatically:
BULL TRAP: Price breaks above ORH but returns within X bars → buyers trapped
BEAR TRAP: Price breaks below ORL but returns within X bars → sellers trapped
Label + background highlight on detection
Bars threshold adjustable (default: 3)
Dedicated alert condition
ORB Statistics Box
Daily trade tracker (resets at configurable hour ET):
Trades / Wins / Losses / Win Rate / Simulated P&L / Status
Color coded: green ≥ 60% WR, yellow ≥ 40%, red below
Position adjustable (4 corners)
⚙️ Settings Overview
14 groups in the settings panel:
London Session (times, 4 colors)
NY Open Session (times, 4 colors)
ORB Box & Lines (box, lines, labels, midline, background)
EMA Settings (periods, colors, cross markers)
VWAP Settings (color, width, cross markers)
Signal Arrows (colors, size: Tiny/Small/Normal/Large)
Signal Filter (5 toggles)
SL / TP (ticks, colors, length)
Trend Channel (length, colors, fill)
MTF Dashboard (position, signal name)
Volume Spike (MA length, threshold, colors)
ORB Quality Score (ATR length, min/max range %, colors)
Trap Detection (bars threshold, colors, alert toggle)
ORB Statistics Box (position, reset hour)
📐 Recommended Setup
Setting
Value
Timeframe
M1 (entry)
London ET
03:00–03:15
NY Open ET
09:30–09:45
TV Timezone
America/New_York
EMA Filter
ON
VWAP Filter
ON
M15/M5 Filter
OFF (optional)
SL Ticks NQ
40 = $200
TP Ticks NQ
80 = $400
SL Ticks MNQ
40 = $60
TP Ticks MNQ
80 = $120
🔔 Alerts (9 total)
ORB BUY Signal
ORB SELL Signal
EMA Cross UP / DOWN (in session)
VWAP Cross UP / DOWN (in session)
ORB Range Set (window closed, ready for breakout)
BULL TRAP detected
BEAR TRAP detected
📋 Tags
ORB opening range breakout NQ MNQ MGC MCL futures prop firm Topstep IQ Capital session EMA VWAP breakout trap detection volume multi timeframe dashboard quality score linear regression
Built for prop firm traders on NQ/MNQ. Respects IQ Capital Position Loss (0.5% = $250/trade) and Topstep Trailing Drawdown rules by design.
This indicator is for informational purposes only. Past performance does not guarantee future results. Always trade with proper risk management.
Indicador

Indicador

Indicador

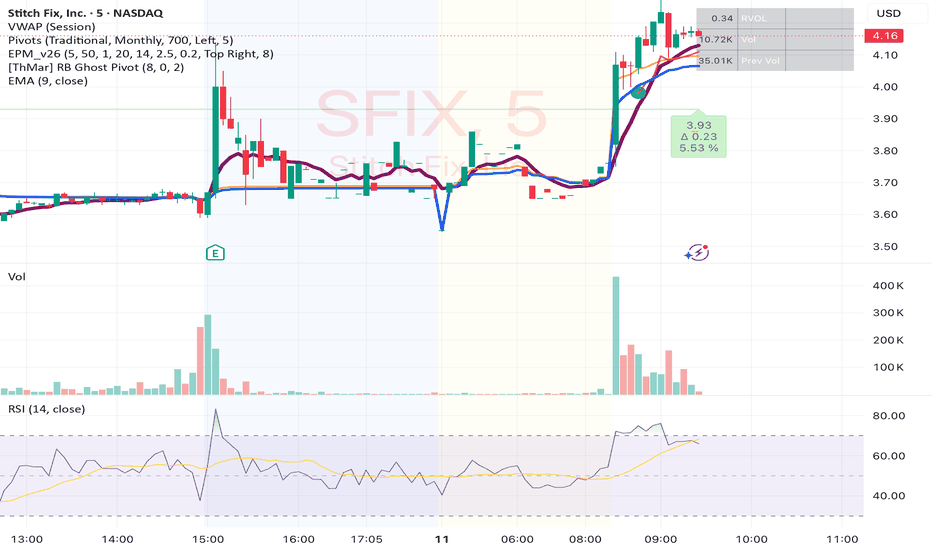
Booker - Relative Volume SignalsBooker RVOL is a momentum breakout indicator designed to identify stocks experiencing unusual buying pressure during the regular trading session.
The indicator looks for a very specific setup often seen in high-momentum small-cap stocks:
* Trading between a user-defined price range (default: $1–$20)
* Up significantly on the day (default: +30% or greater)
* Trading with meaningful liquidity (default: 500,000+ shares)
* Relative Volume (RVOL) above a minimum threshold (default: 4x normal volume)
* Price trading above both VWAP and the 9 EMA
* A breakout above the premarket high
* A bullish “drop-and-pop” pattern, where a red candle is immediately followed by a breakout candle
When all conditions align, the indicator generates an LB RVOL signal and marks the chart.
Included Features
* Relative Volume (RVOL) calculation
* Premarket high tracking
* VWAP and 9 EMA trend confirmation
* Daily gain and volume filtering
* Customizable price range filters
* Entry markers and RVOL labels
* Alert support for automated notifications
Default Philosophy
The default settings are optimized for identifying explosive small-cap momentum stocks that are:
* Gapping higher
* Trading heavy volume
* Holding above key intraday support levels
* Breaking through important resistance levels
Rather than generating frequent signals, LB RVOL focuses on finding rare, high-conviction momentum setups where multiple bullish factors are aligned at the same time.
Signal Interpretation
A signal does not guarantee a successful trade. Instead, it highlights a stock exhibiting:
1. Exceptional relative volume
2. Strong intraday trend structure
3. A breakout above premarket resistance
4. Evidence of continued buying pressure
Many traders use these signals as a starting point for further analysis, including risk management, dilution risk assessment, chart pattern review, and broader market context.
LB RVOL was built to help traders quickly identify stocks attracting institutional and speculative attention before significant intraday moves develop. Indicador
Indicador
Indicador

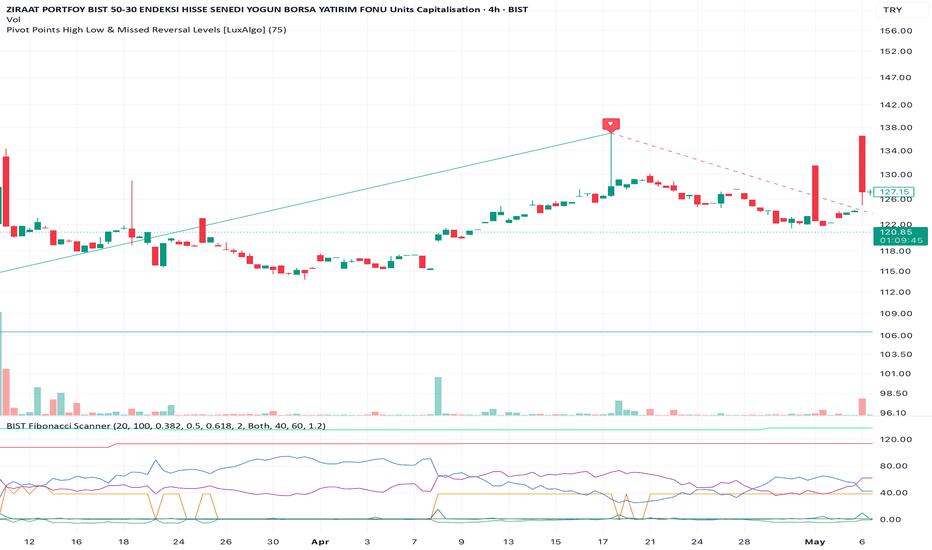
XLY/XLP Equal-Weight RatioThe Equal-Weight Discretionary/Staples Ratio measures the ratio between two equal-weighted ETFs from Invesco: the S&P 500 Equal Weight Consumer Discretionary ETF (RSPD) and the S&P 500 Equal Weight Consumer Staples ETF (RSPS). It is the equal-weighted counterpart to the well-known XLY/XLP ratio, which measures the same two sectors using the cap-weighted SPDR funds Consumer Discretionary Select Sector SPDR Fund (XLY) and Consumer Staples Select Sector SPDR Fund (XLP). This ratio is used by traders and investors as a measure of the relative strength of the consumer discretionary sector versus the consumer staples sector.
Why equal-weighted (RSPD/RSPS) instead of cap-weighted (XLY/XLP)?
In the standard cap-weighted XLY, a handful of mega-cap names dominate the fund — most notably Tesla and Amazon, which together can account for a very large share of XLY's value. As a result, the cap-weighted XLY/XLP ratio often tells you more about the price action of those few heavyweights than about the broad consumer discretionary sector. By using the equal-weighted RSPD and RSPS, every company in each sector contributes roughly the same weight. This removes the distortion from individual giants like Tesla and produces a cleaner, broader read on the underlying breadth of consumer behavior — i.e., how the average discretionary company is doing relative to the average staples company, rather than how Tesla is doing. This makes the equal-weighted ratio a more representative gauge of true risk-on/risk-off sentiment across the consumer economy.
A higher ratio indicates that consumer confidence is higher and people are more willing to spend their money on non-essential items, such as entertainment or luxury goods (discretionary spending). A lower ratio, on the other hand, indicates that consumer confidence is lower and people are gravitating toward essential items like food and household goods (staple spending).
The interpretation of the ratio depends on the current market situation and the analysis of the economic and political factors that may influence consumption. If the ratio rises, it could be an indication of a growing economy and increasing consumer sentiment. However, if it falls, it could be an indication of a weakening economy or declining consumer confidence.
It is important to note that this indicator should not be used as the sole basis for making trading decisions. It is advisable to also consider other indicators, such as technical and fundamental analysis, before making a decision. Indicador

Swing TP/SL UltimateSwing TP/SL Ultimate
TradingView Pine Script v6 — Overlay Indicator
Short title: TP/SL▲▼ | Version: 2.0 | Type: Overlay Indicator
Overview
Swing TP/SL Ultimate is an advanced Take Profit and Stop Loss analysis tool for TradingView. Instead of requiring you to manually set fixed TP/SL percentages, it automatically calculates statistically-derived average TP and SL distances by studying every confirmed Swing High and Swing Low in historical price data across multiple timeframes and pivot lengths.
The core idea: the market's own past behaviour tells you how far it typically moves up (TP) and down (SL) from any given point. This indicator collects hundreds of those data points, filters out outliers, and surfaces the most reliable average — displayed as both a percentage and an actual price level on your chart.
Key Features
Multi-length Pivot DetectionSimultaneously scans 3 configurable pivot lengths (Fast / Mid / Slow) to maximise the number of valid swing samples
Multi-TimeFrame (HTF) PivotsImports pivots from a Higher TimeFrame and merges them into
the same statistical buffer
4 Averaging MethodsSimple, EMA-Weighted, Trimmed Mean, and Blended — all computed in parallel
Per-Bar ATR-Style AverageUses every bar's high−open and open−low as additional TP/SL samples for maximum data density
KNN High/Low PredictionA K-Nearest Neighbours model predicts the likely High and Low over the next 5 bars using 10 market features
Buy / Sell SignalsFires when price reaches a confirmed swing extreme, RSI confirms, and optional volume confirmation passes
Scalable DashboardFour size presets (Tiny / Small / Medium / Large) with compact mode for minimal screen space
Dual-format ValuesEvery metric is shown as both % and actual price — e.g. 2.34% (48,250.00)
Opaque Line LabelsLabels sit directly on chart lines with solid dark backgrounds so they block the line rather than overlap it
How It Works
1. Pivot Collection
A Swing High is a bar whose high is the highest of the N bars before it and the N bars after it. TradingView confirms this N bars after the fact. The indicator runs this detection three times simultaneously with different lengths:
Fast pivot (default N=5) — captures minor swings, many samples
Mid pivot (default N=10) — captures medium swings
Slow pivot (default N=21) — captures major swings, fewer but stronger signals
HTF pivot (default N=10 on 60m) — imported from higher timeframe
Every confirmed pivot feeds into a unified rolling array buffer shared by all four sources.
2. Percentage Calculation
For each confirmed Swing High pivot:
TP% sample = (pivotHigh − confirmClose) / confirmClose × 100
For each confirmed Swing Low pivot:
SL% sample = (confirmClose − pivotLow) / confirmClose × 100
Only positive values are stored. The buffer is capped at Rolling Buffer Size entries — when full, the oldest sample is dropped (FIFO), keeping the average adaptive to the current market regime.
3. Averaging Methods
All four methods run simultaneously. You choose which one drives the final Suggested TP/SL prices:
Simple Average
The arithmetic mean of all samples in the rolling buffer. Straightforward and transparent.
EMA-Weighted Average
A running Exponential Moving Average applied to each new pivot sample as it arrives. Recent pivots are weighted more heavily than older ones, making this method more responsive to regime changes.
α = 2 / (EMA Period + 1)
emaTP = emaTP × (1 − α) + newSample × α
Trimmed Mean (default)
Sorts all buffer samples and removes the top and bottom N% before computing the mean. This eliminates the influence of extreme outlier swings (e.g. a flash crash or a parabolic spike) that would otherwise skew the average.
Default trim: 10% → removes top 10% and bottom 10% of samples
Blended
Averages the Trimmed Mean result with the Per-Bar ATR-style result. Combines the statistical robustness of pivot-based sampling with the high data density of per-bar measurement.
4. Per-Bar ATR-Style Sampling
In addition to pivot-based samples, every single bar contributes:
barTP% = (high − open) / open × 100 ← upside potential per bar
barSL% = (open − low) / open × 100 ← downside risk per bar
An EMA is applied to both series. This gives the indicator a very high sample count (one per bar vs. one per pivot event) and closely mirrors the concept of Average True Range expressed directionally as a percentage.
KNN Prediction
The indicator includes a K-Nearest Neighbours (KNN) machine learning model that predicts how far price is likely to move up and down over the next 5 bars.
Feature Vector (10 dimensions)
#FeatureWhat it captures0RSI (14)Momentum / overbought / oversold1Distance from EMA-50 %Trend deviation2ATR (14) as % of priceVolatility regime3Bollinger Band position %Price within range4Volume vs. 20-bar SMA %Volume spike detection5Candle body size %Bar strength6Upper wick %Rejection at highs7Lower wick %Rejection at lows8Momentum (10-bar) %Short-term trend force9Close position in 20-bar range %Range context
Algorithm
For every bar in the training window (up to 200 bars back, sampled every 2 bars for performance), compute the Euclidean distance between the current bar's feature vector and that historical bar's feature vector.
Select the K nearest historical bars (default K=5).
For each neighbour, look up what actually happened over the next 5 bars: how high did price go, how low did it go.
Weight each neighbour by inverse distance — closer matches contribute more.
The weighted average of future highs and lows becomes the KNN prediction.
The result is plotted as a dotted forward line on the chart and shown in the dashboard.
Buy / Sell Signals
Signals fire only when all conditions are simultaneously true.
Buy Signal (▲ BUY — green label below bar)
ConditionLogicNear Swing Lowclose ≤ lastSwingLow × (1 + avgSL% × 0.5)RSI OversoldRSI ≤ Oversold threshold (default 35)Bullish candleclose > openVolume (optional)volume > 20-bar SMA × 1.2
Sell Signal (▼ SELL — red label above bar)
ConditionLogicNear Swing Highclose ≥ lastSwingHigh × (1 − avgTP% × 0.5)RSI OverboughtRSI ≥ Overbought threshold (default 65)Bearish candleclose < openVolume (optional)volume > 20-bar SMA × 1.2
Note: Signals are contextual alerts, not a complete trading system. Always combine with your own analysis and risk management.
Dashboard
The on-chart table updates on every bar. Its size, position, and content depth are all configurable.
Size Presets
SizeTextRows shownTinytinyCore only (compact)SmallsmallCore + method breakdownMediumnormalCore + breakdown + range statsLargelargeFull: all above + KNN + signal state + HTF status
Dashboard Sections
Always visible
RowLabelDescriptionTitle⬡ TP / SL ULTIMATEActive method + sample countsLive▲ To Swing HIGH% and price distance to last pivot highLive▼ To Swing LOW% and price distance to last pivot lowAvg★ Avg TP (Final)Final averaged TP as % and suggested priceAvg★ Avg SL (Final)Final averaged SL as % and suggested priceAvg⚖ R:R RatioavgTP ÷ avgSL — green ≥2.0, yellow ≥1.0, red <1.0
Small and above
RowLabelDescriptionBreakdownSimple / EMA-Weighted / Trimmed / Per-BarTP% / SL% for each method side by side
Medium and above
RowLabelDescriptionRangeAvg High %Mean upside from all pivot samplesRangeMax / Min High %Best and worst upside seen in bufferRangeAvg Low %Mean downside from all pivot samplesRangeMax Low %Worst downside seen in buffer
Large only
RowLabelDescriptionKNNKNN Pred High +%Predicted upside over next 5 bars (% + price)KNNKNN Pred Low −%Predicted downside over next 5 bars (% + price)SignalRSICurrent RSI value, colour-codedSignalVolume vs SMACurrent volume as % of 20-bar SMASignalActive SignalBUY / SELL / WaitingInfoHTF PivotsWhether HTF pivot collection is active
Chart Visuals
ElementColourDescriptionDashed green lineGreenLast confirmed Swing High levelDashed red lineRedLast confirmed Swing Low levelSolid teal lineTealAvg TP suggested priceSolid orange lineOrangeAvg SL suggested priceDotted purple linePurpleKNN predicted High (forward projection)Dotted fuchsia lineFuchsiaKNN predicted Low (forward projection)▼ triangle above barRedConfirmed pivot high marker▲ triangle below barLimeConfirmed pivot low markerBUY labelLimeBuy signal — all conditions metSELL labelRedSell signal — all conditions met
All lines carry opaque labels (solid dark background matching the line colour) placed directly on the line so the text is legible without the line running through it.
Input Reference
📐 Pivot Detection
InputDefaultRangeDescriptionPivot Length 1 – Fast52–50Left/right bars to confirm a fast swingPivot Length 2 – Mid102–100Left/right bars for mid-grade swingPivot Length 3 – Slow212–200Left/right bars for slow/major swingRolling Buffer Size15020–500Max samples kept per side (TP / SL)Outlier Trim %100–40% of extremes removed from trimmed meanEMA Weight Period142–100Smoothing for EMA-weighted averagePer-Bar EMA Length20010–1000EMA length for per-bar ATR-style average
🌐 Multi-TimeFrame
InputDefaultDescriptionEnable HTF PivotsOnAdds higher-timeframe pivots to the bufferHigher TimeFrame60 (1H)Source timeframe for HTF pivotsHTF Pivot Length10Pivot detection length on the higher timeframe
🤖 KNN Prediction
InputDefaultRangeDescriptionEnable KNNOn—Toggle the KNN engine on/offK Neighbours53–15Number of nearest matches to useKNN Training Window10030–200How many bars back to search
📊 Averaging
InputDefaultOptionsDescriptionPrimary Pivot MethodTrimmed MeanSimple / EMA Weighted / Trimmed Mean / BlendedWhich pivot average drives the final outputSample SourceBlendedPivot Only / Per-Bar Only / BlendedWhat data feeds the final TP/SL
🎯 Signals
InputDefaultDescriptionShow Buy/Sell SignalsOnMaster toggle for signal markersRSI Length14Period for RSI calculationRSI Oversold – Buy35RSI threshold to confirm a buyRSI Overbought – Sell65RSI threshold to confirm a sellVolume ConfirmationOnRequire volume > 1.2× SMA to trigger
🖥 Dashboard
InputDefaultOptionsDescriptionPositionTop RightTop/Bottom × Left/RightCorner placement of the tableDashboard SizeMediumTiny / Small / Medium / LargeControls text size and row countUltra-Compact ModeOff—Shows only title + 6 core rows
🎨 Visuals
InputDefaultDescriptionShow Pivot Level LinesOnDashed lines at last Swing High / LowShow Avg TP/SL LinesOnSolid lines at suggested TP and SL pricesShow KNN Predicted LinesOnDotted forward lines from KNN modelShow Pivot MarkersOnTriangles at confirmed pivot barsShow Line LabelsOnOpaque labels on all chart lines
Recommended Settings by Use Case
Scalping (1m – 5m charts)
Pivot Length 1: 3 Pivot Length 2: 5 Pivot Length 3: 10
HTF Timeframe: 15
Buffer Size: 100 EMA Period: 7 Per-Bar EMA: 50
Primary: EMA Weighted Source: Blended
RSI Oversold: 30 RSI Overbought: 70
Swing Trading (1H – 4H charts)
Pivot Length 1: 5 Pivot Length 2: 10 Pivot Length 3: 21
HTF Timeframe: D
Buffer Size: 150 EMA Period: 14 Per-Bar EMA: 200
Primary: Trimmed Mean Source: Blended
RSI Oversold: 35 RSI Overbought: 65
Position Trading (Daily – Weekly charts)
Pivot Length 1: 10 Pivot Length 2: 20 Pivot Length 3: 50
HTF Timeframe: W
Buffer Size: 200 EMA Period: 21 Per-Bar EMA: 500
Primary: Simple Source: Pivot Only
RSI Oversold: 40 RSI Overbought: 60
Technical Notes
Pine Script version: v6
Type: indicator() with overlay=true
Max lines: 20 | Max labels: 50
MTF data: Uses barmerge.lookahead_off to prevent future-leak
KNN performance: Samples every 2nd bar in the training window; hard-capped at 200 bars to stay within Pine's execution time limits
Global scope rule: All plotshape() calls and var mutations are placed at the global scope as required by Pine Script v6
Changelog
VersionDateChanges1.0InitialBasic pivot avg + dashboard2.0CurrentKNN engine, MTF pivots, 4 avg methods, buy/sell signals, 4 dashboard sizes, opaque line labels, full Pine v6 scope compliance
Built for TradingView Pine Script v6. For educational and analytical purposes only — not financial advice. Indicador