Indicador
Full Trendline + SMC System [Golden_WolfAI]Full Trendline + SMC System
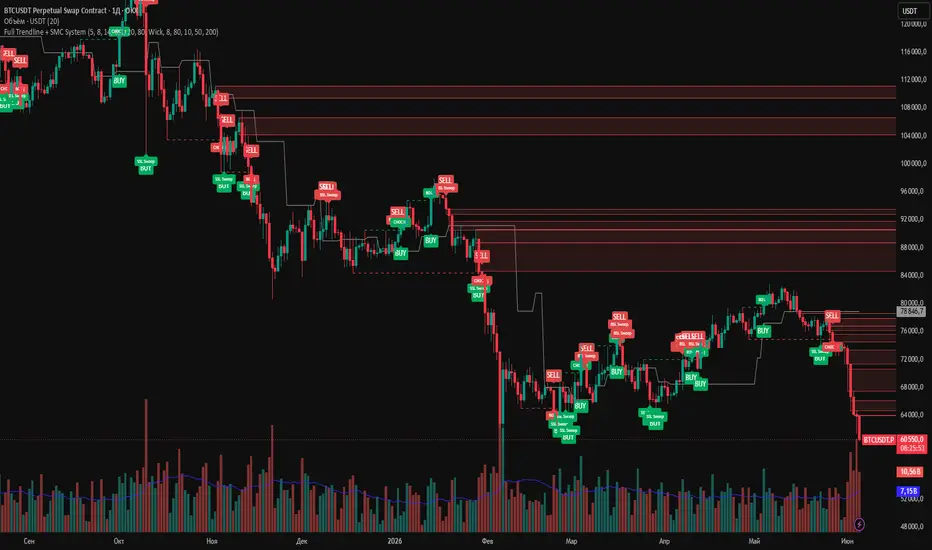
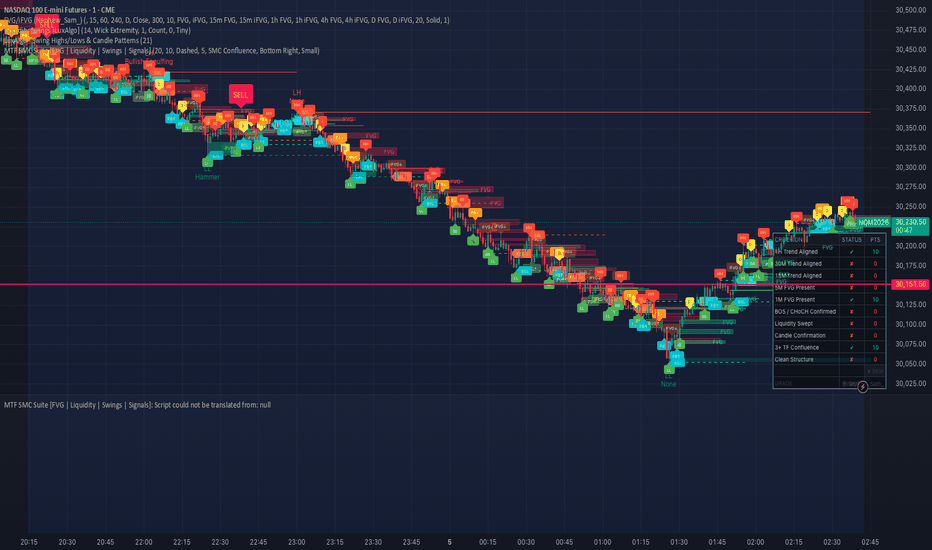
This indicator is built for traders who want to see the market structure clearly, without manually marking every swing, trendline, liquidity zone and imbalance.
Full Trendline + SMC System combines classic trendline logic with Smart Money Concepts, helping you read the chart with more confidence and structure. It highlights key market events such as BOS, CHOCH, liquidity sweeps, equal highs/lows, order blocks, fair value gaps and trendline breaks directly on the chart.
The goal of this tool is simple: reduce noise and show where the real battle between buyers and sellers may be happening.
Main features:
• Automatic trendlines based on swing highs and swing lows
• Bullish and bearish trendline break detection
• BOS and CHOCH market structure labels
• Buy-side and sell-side liquidity sweep detection
• Equal highs and equal lows detection
• Bullish and bearish order block zones
• Fair Value Gap zones with optional auto-removal after fill
• 50% equilibrium level for premium/discount context
• Optional EMA trend filter
• BUY and SELL signal labels
• Built-in alerts for signals, BOS, CHOCH, trendline breaks, sweeps and FVGs
This indicator is not designed to replace your trading plan. It is designed to give you a structured view of the market, so you can make cleaner decisions, avoid random entries and understand where price may be reacting from.
Use it to identify structure, liquidity, imbalance and possible continuation or reversal areas.
Recommended use:
1. Start from higher timeframes to define market direction.
2. Watch BOS and CHOCH to understand structure shifts.
3. Use liquidity sweeps to detect possible traps.
4. Use order blocks and FVGs as reaction zones.
5. Use BUY/SELL signals only as confirmation, not as blind entries.
No indicator can predict the market with certainty. Always use proper risk management and test the tool on your own market, timeframe and trading style before making decisions.
Indicador

Indicador
Indicador

BTC 5m Scalper Pro V4.2 [SAFE STRATEGY] DescriptionBTC 5m Scalper Pro V4.2 is a trend-following, high-probability scalping script meticulously optimized for volatile assets like Bitcoin (BTC) and Gold (XAU/USD). It is designed to capture quick intraday impulses while heavily filtering out market noise, choppy consolidations, and fakeouts.
The core philosophy of this script is SAFETY FIRST. It enforces strict mechanical rules combining momentum, trend synchronization, and trend strength before printing any signal.Key Features🛡️ Multi-Filter Safety EngineThe script will only trigger a signal if three independent conditions align perfectly:Trend Alignment (Supertrend + 200 EMA): Longs are strictly allowed only above the 200 EMA, and Shorts only below the 200 EMA.Momentum Confirmation (RSI): Filters out weak moves.
Longs require NYSE:RSI > 50$, and Shorts require NYSE:RSI < 50$.Trend Strength (ADX): An adjustable ADX threshold ensures the script remains completely silent during low-volume, sideways ranges.⏱️ Zero Repainting & Signal ProtectionSignals are strictly calculated and confirmed on the close of the previous bar .
The script highlights the candle in bright green (Long) or bright pink (Short) and places a clean "GO" label.
Once printed on a closed bar, the signal never disappears or changes.📊 Advanced Risk Management & Automatic PlottingAnti-Wick Stop Loss: Automatically scans the lowest low (for Longs) or highest high (for Shorts) of the last 3 candles and adds an ATR-based padding to prevent sudden market sweeps from stopping you out early.Dynamic Target Lines: Automatically draws your dynamic Stop Loss (Red) and Take Profit (Blue) lines right on your chart with precise price figures.Manual R:R or Fibonacci Target: Choose between a steady manual Reward-to-Risk ratio (default 1.5) or a Fibonacci 1.618 extension target.🎛️ Fully Customizable Mini DashboardIncludes a sleek, real-time table at the bottom-right of your screen showing critical data from your last trade (Execution Price, exact SL/TP, Entry RSI, and ADX strength).
The dashboard can be shrunk to "Ultra-Small" or completely disabled in the settings for a clean chart layout.How to Set Up Your Real-Time Alerts 🔔This script uses the modern alert() function call system to prevent any sync delays. To get instant alerts with your exact entry price, SL, and TP sent straight to your phone or PC:Click on the Create Alert clock icon (Alt + A).Condition: Select Stratégie SÉCURISÉE: BTC 5m Scalper Pro V4.2.Sub-Condition (Crucial): Select Any alert() function call (or Appels de fonction alert()).Trigger: Leave it on Only Once. Note: The code automatically resets itself and manages the bar-close frequency internally, so it will trigger on every valid setup!Click Create.Disclaimer: Scalping involves financial risk.
Always test this script on historical data and apply proper position sizing. Indicador

NY Session Conviction DashboardOverview
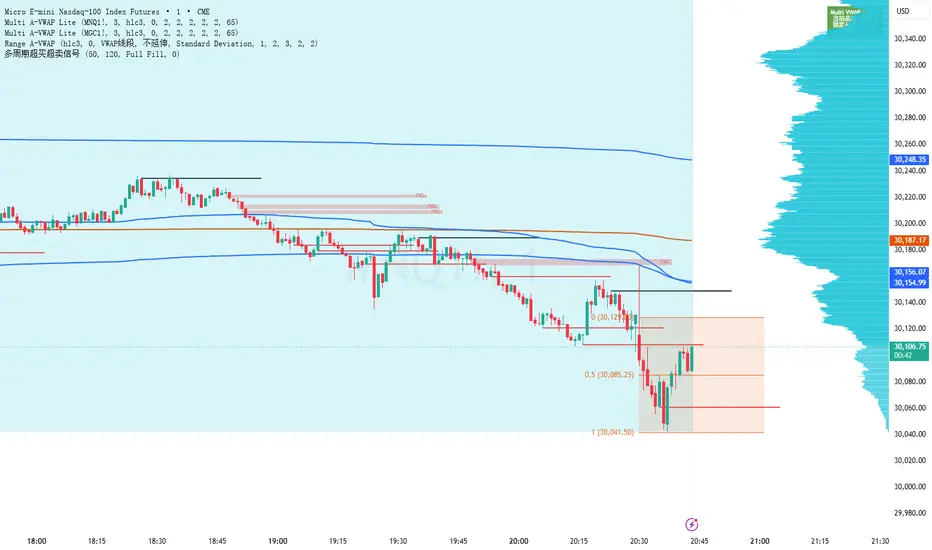
The NY Session Conviction Dashboard is a comprehensive market-state engine designed specifically for intraday futures traders (ES/NQ) executing during the New York session. Rather than generating lagging, automated buy/sell signals, this tool functions as a professional tape-reading companion. It provides a real-time, statistical framework to assess institutional conviction, market efficiency, and volume participation when price tests critical structural levels like Prior Day High/Low (PDH/PDL), Overnight High/Low (ONH/ONL), and Session VWAP.
By applying a Wyckoff-inspired Effort vs. Result model, the script evaluates whether current order flow supports a structural breakout/continuation or a structural fading/rejection.
Core Architecture & Components
1. Intraday Effort (Market Internals Engine)
Dual Index VOLD Ratios: Tracks institutional volume deployment by calculating the dynamic ratio of advancing vs. declining volume for both the NYSE (USI:UVOL/USI:DVOL) and NASDAQ (USI:UVOLQ/USI:DVOLQ).
NYSE TICK Integration: Samples centralized order flow momentum to confirm whether sudden price spikes are supported by broad market buying/selling.
2. Intraday Result (Structural Efficiency & Pressure)
Kaufman-Driven Adaptive KAMA: Uses an Efficiency Ratio (ER) lookback to dynamically adjust its smoothing factor. It remains flat during erratic, noisy balance areas and turns sharply directional when true algorithmic expansion occurs.
Session VWAP with ER Stabilization: Resets precisely at the NY Open (0930 EST). Features a unique initial-hour "Stabilization Event Box" based on Early Session efficiency to protect against choppy opening balancing behaviors.
Candle Pressure Index (CPI): Measures the precision of close location relative to a bar's total range, filtered through an ATR noise gate to eliminate low-liquidity anomalies.
3. Institutional Absorption Detection
Plots discrete, real-time exhaustion markers (X) directly on the chart when high-effort internal signatures (VOLD extremes/TICK spikes) fail to yield a directional result—classically signaling institutional absorption or passive resting liquidity behavior.
Understanding the Tape Reading States
The dashboard dynamically computes and displays the mathematical harmony between broad market internals and current price action, classifying the market into distinct behavioral regimes:
BULL ALIGN / BEAR ALIGN (Golden State): Full harmony. Internals, Volume Ratios, TICK, CPI, and Trend Efficiency are aligned aggressively in one direction. High-conviction expansion.
BULL DIV / BEAR DIV (Price Divergence): Price is flat or declining, but broad market internals are heavily positive (or vice-versa). Often leads to a sudden catch-up expansion or rotational reversal.
BULL ABSORB / BEAR ABSORB: High internal volume effort is actively hitting the market, but the price trend efficiency is exceptionally low (ER < 0.30). This points to major passive limit orders blocking further progression.
LEAD DIV (Leadership Divergence): NYSE and NASDAQ volume structures are actively opposing one another, indicating a split, rotation-heavy market profile.
How to Use This Tool
This indicator is built for discretionary execution support.
Identify Your Levels Manually: Map out your key price boundaries (PDH, PDL, Daily VWAP, or high-volume nodes).
Watch the Test: As price approaches a level, look down at the Tape Dashboard.
Verify Conviction: * A breakout past PDH accompanied by a BULL ALIGN state implies high-probability continuation.
A test of PDH accompanied by a BEAR ABSORB or BEAR DIV state indicates a structural failure, offering a high-probability mean-reversion setup back to VWAP. Indicador

Indicador
5 Major Signal Strategy / 7 Candlestick Patterns ## 5 Major Signal Strategy / 7 Candlestick Patterns
This strategy is based on the `HanJinSignals26` signal library and is designed to detect multiple independent candlestick reversal and momentum patterns on the chart.
The strategy currently supports the following signal groups:
1. Pinbar
2. Engulfing Pattern
3. Fractal Top
4. Fractal Bottom
5. Single Harami
6. Double Harami
7. Big Body Candle
Each signal can be enabled or disabled independently from the input panel. When a signal is disabled, the related library function will not be called, keeping the detection flow clean and modular.
## Core Design
The main design goal of this strategy is signal independence.
Each enabled signal has:
* Its own detection logic
* Its own chart marker
* Its own strategy entry ID
* Its own webhook alert tag
This means that different signal types can trigger independently without depending on one shared signal result.
## Webhook Bridge
The strategy also includes a webhook payload generator.
When a confirmed signal appears at bar close, the strategy sends a structured JSON payload containing:
* Secret key
* Unique signal ID
* Timestamp
* Symbol
* Trade side
* Signal comment/tag
This makes the script suitable for connecting TradingView alerts to external automation systems, bridge services, or execution engines.
## Important Notes
This script is designed for signal research, automation testing, and strategy development.
It is not financial advice and does not guarantee profitability.
Users should always perform their own backtesting, forward testing, risk control, and parameter adjustment before using any signal in a real trading environment.
## Author
Created by richardgong1988.
Estrategia

Indicador

Smart Market Structure ProDescription:
This indicator automatically detects and marks significant swing highs and swing lows using pivot-based market structure analysis.
Features:
Identifies Swing Highs and Swing Lows.
Labels market structure as:
HH (Higher High)
HL (Higher Low)
LH (Lower High)
LL (Lower Low)
Draws structure lines connecting consecutive highs and lows.
Helps traders visualize trend direction and market structure.
Suitable for Forex, Gold, Indices, Stocks, and Cryptocurrencies.
Works on all timeframes, including 1-minute charts.
How to Use:
A sequence of HH and HL indicates an uptrend.
A sequence of LH and LL indicates a downtrend.
Use market structure breaks as potential trend reversal signals.
Combine with support/resistance, moving averages, or supply and demand zones for better trade confirmation.
Recommended Settings:
Aggressive: Left Bars = 3, Right Bars = 3
Balanced: Left Bars = 5, Right Bars = 5
Conservative: Left Bars = 8, Right Bars = 8
Disclaimer:
This indicator is for educational and analytical purposes only and should not be considered financial advice. Always use proper risk management when trading. Indicador

Indicador

Indicador

Indicador

RizA_Ultra_v23RizA Ultra v23 - Multi-Timeframe Trend & Liquidity Engine
RizA_Ultra_v23 is a highly adaptive, institutional-grade technical analysis indicator designed for multi-timeframe trend alignment, liquidity tracking, and dynamic risk management. By fusing dual Multi-Timeframe (MTF) Simple Moving Averages, an advanced MTF Momentum Confirmation Filter (WaveTrend), and real-time Liquidity Swing Zones, this tool provides traders with a pristine macro-to-micro view of any market.
Whether you trade Indices (NAS100, GER40), Crypto (BTCUSD), or Forex/Metals (XAUUSD), this indicator eliminates the noise and delivers precise execution signals.
🌟 Key Features
1. Smart Asset Profiles (Broker-Independent)
Say goodbye to constantly changing your indicator settings when switching assets. The script features built-in, optimized presets for four major symbols that apply automatically by scanning your chart ticker:
NAS100 (Nasdaq)
BTCUSD (Bitcoin)
XAUUSD (Gold)
GER40 (Dax)
Note: Includes a fully customizable manual mode for any other asset of your choice.
2. Dual MTF Trend Alignment (MTF1 & MTF2)
The core engine tracks two distinct higher timeframes simultaneously using customizable Short/Long SMA pairs.
Visual Ribbons: Fills the space between the short and long moving averages with color-coded sentiment bands (Bullish/Bearish).
Execution Matrix: Signals are only triggered when the faster MTF cross aligns with the directional bias of the slower MTF trend.
3. MTF MAC Confirmation (WaveTrend Filter)
To filter out false breakouts and choppy consolidation zones, an integrated WaveTrend Oscillator Engine functions on a third customizable timeframe. It validates the structural health of the move, preventing you from buying a premium or selling a discount.
4. Institutional Liquidity Swings
Tracks market structure in real-time by identifying key Pivot Highs and Pivot Lows.
Wick & Range Extremities: Draws clear, real-time institutional liquidity blocks.
Intrabar Precision: Utilizes lower timeframe lower-tf lookups to calculate historical volume/count depth within the swing areas.
Breach Tracking: Solid lines turn to dashed lines once liquidity is swept or invalidated by price action.
5. Dynamic Trailing Stop Loss (TSL)
Protects your capital with a fully automated, trailing stop-loss visualizer:
Fixed Initial Risk: Plots a standard initial stop loss based on your fixed percentage input.
Profit Activation Engine: Once price reaches a specific percentage threshold, a Trailing Stop activates, dynamically locking in profits bar-by-bar until a violation candle closes out the position.
6. Heads-Up Display (HUD) Dashboard
Includes a clean, highly readable info-table positioned on your chart to track the real-time status of your MTF1, MTF2, and MAC momentum filters simultaneously without cluttering your price action view.
📥 Settings & Customization
Timeframes & Periods: Fully configure intervals and lengths for all MTF filters.
Liquidity Options: Adjust Pivot Lookbacks, select filter parameters (Volume vs. Count), and customize visual zones.
Risk Metrics: Tweak initial stop-loss percentages, TSL activation points, and trailing tighter percentages.
UI/UX: Toggle visual components, change colors, adjust transparency, and reposition the dashboard table.
🚨 Real-Time Alerts Included
Never miss a setup. This indicator comes equipped with ready-made alert conditions for automation or push notifications:
Long Signal — Triggered when multi-timeframe structures align bullishly with MAC confirmation.
Short Signal — Triggered when multi-timeframe structures align bearishly with MAC confirmation.
Disclaimer: Trading financial instruments involves high risk. This tool is designed for educational and analytical purposes and does not constitute financial advice. Indicador

Indicador

Market MapMarketStructureLab - Market Map
Market Map is a visual market context indicator designed to help traders read the chart structure more clearly.
The tool does not generate buy or sell signals. Instead, it focuses on mapping the current market environment by highlighting important support and resistance zones, premium / balance / discount areas, projected dynamic trend lines, and a compact dashboard with simple market context readings.
The main idea behind this indicator is to answer a few practical questions:
Where is price trading now?
Is it close to support or resistance?
Is price located in the upper, middle, or lower part of the recent range?
Who currently has more control according to the trend context: buyers, sellers, or neither side?
How much room is there to the nearest support or resistance area?
━━━━━━━━━━━━━━━━━━━━━━
📌 WHAT THE INDICATOR SHOWS
━━━━━━━━━━━━━━━━━━━━━━
1. Support and Resistance Zones
The indicator builds support and resistance areas from clustered pivot highs and pivot lows.
A resistance zone appears where price has previously reacted from above.
A support zone appears where price has previously held from below.
These zones are not exact prediction levels. They are visual areas where price has shown previous market interest and where traders may want to pay closer attention.
2. Premium / Balance / Discount Areas
The script divides the recent price range into three visual areas:
Premium area — the upper part of the range.
Balance area — the middle part of the range.
Discount area — the lower part of the range.
This helps traders understand whether price is currently high, low, or balanced within the recent market structure.
3. Dynamic Trend Lines
The indicator can project dynamic trend lines from recent pivot highs and pivot lows.
The red projected line represents the slope of recent highs.
The green projected line represents the slope of recent lows.
These lines are designed for visual structure reading only. They are not automatic entry or exit signals.
4. Dashboard
The dashboard gives a compact summary of the current market context:
Market — bullish, bearish, or neutral trend context based on EMA structure.
Zone — current location of price: support, resistance, premium, discount, balance, or middle.
Control — whether buyers, sellers, or neither side have the current edge.
Room — approximate distance from the current price to nearby resistance and support.
Focus — a simple note on what area deserves attention.
━━━━━━━━━━━━━━━━━━━━━━
🧭 HOW TO USE IT
━━━━━━━━━━━━━━━━━━━━━━
This indicator is best used as a market map.
It can help traders prepare before making decisions by showing the current chart environment in a cleaner and more structured way.
A simple workflow may look like this:
1. Check whether price is near a support or resistance zone.
2. Look at whether price is in premium, balance, or discount.
3. Read the dashboard to understand the current market context.
4. Use the dynamic trend lines to review the slope of recent structure.
5. Combine the map with your own strategy, confirmation tools, and risk management.
━━━━━━━━━━━━━━━━━━━━━━
⚠️ IMPORTANT LIMITATIONS
━━━━━━━━━━━━━━━━━━━━━━
This script does not provide financial advice.
It does not predict future price movement.
It does not guarantee profitable trades.
It does not execute trades.
It does not provide automatic buy or sell signals.
It should not be used as a standalone trading system.
Support and resistance zones are based on historical price structure and may fail at any time. Market conditions can change quickly, especially during high volatility, earnings events, news releases, or low-liquidity periods.
Every trader is responsible for their own analysis, validation, risk management, position sizing, and trading decisions.
━━━━━━━━━━━━━━━━━━━━━━
✅ BEST USED FOR
━━━━━━━━━━━━━━━━━━━━━━
Market structure reading
Support and resistance analysis
Range location analysis
Trend context review
Visual chart preparation
Beginner-friendly market mapping
Multi-timeframe context building
Suggested timeframes: H1 and above.
━━━━━━━━━━━━━━━━━━━━━━
🛡️ DISCLAIMER
━━━━━━━━━━━━━━━━━━━━━━
MarketStructureLab - Market Map is provided for educational and informational purposes only.
It is a visual chart analysis tool, not financial, investment, or trading advice. No indicator can guarantee future results. Always do your own research and use proper risk management before making any trading decision.
Indicador

Indicador

Henryman - Screener Pre-Mercado - Asia-Model+Tables## ¿Qué es esto?
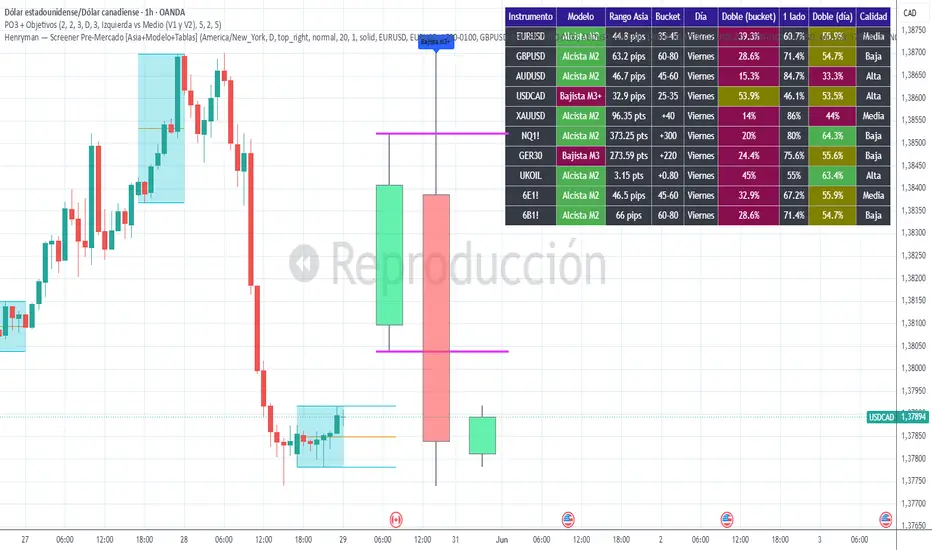
Es un "panel de control" (un indicador) que se pone encima de un gráfico de precios en TradingView. Te dice de un vistazo, para varios instrumentos a la vez (EUR/USD, oro, NASDAQ, etc.), tres cosas: qué __modelo__ (patrón) se ha formado, cuánto se movió el precio en la __sesión asiática__ de la noche, y qué __probabilidad__ histórica hay de que el precio se mueva a uno o a los dos lados ese día.
## Cómo instalarlo (paso a paso)
1. Entra en __tradingview.com__ y abre cualquier gráfico (arriba pone el nombre del instrumento, p. ej. EURUSD).
2. En la parte de abajo de la pantalla pulsa el botón __"Pine Editor"__ (Editor de Pine). Se abre una ventana de texto.
3. Borra lo que haya y __pega todo el contenido__ del archivo `screener_henryman.txt`.
4. Pulsa __"Add to chart"__ (Añadir al gráfico). Verás aparecer una __tabla__ en una esquina del gráfico.
## Cómo configurarlo
1. Pasa el ratón por el nombre del indicador (arriba a la izquierda del gráfico) y pulsa el icono de __engranaje__ (Ajustes / Settings).
2. __"Instrumentos"__: hay 12 filas. En cada una marcas la casilla para activarla, eliges el símbolo (p. ej. `OANDA:EURUSD`) y el tipo (preset) que le corresponde. Activa solo los que vayas a mirar.
3. __"TF del Modelo"__: aquí eliges en qué velas se busca el patrón. Opciones: `240` = 4 horas, `720` = 12 horas, `D` = diario, `W` = semanal. (Diario es el normal).
4. El resto (colores, posición de la tabla, rango asiático) puedes dejarlo como viene.
## Cómo leer la tabla
Cada fila es un instrumento, y las columnas te dicen:
- __Modelo__: el patrón detectado. Verde = alcista (sugiere subida), rojo/granate = bajista (sugiere bajada), un guion "—" = no hay patrón claro.
- __Rango Asia__: cuántos pips/puntos se movió el precio durante la noche asiática.
- __Día / Doble / 1 lado / Calidad__: estadísticas de qué suele pasar ese día y con ese tamaño de rango.
## Los 3 modelos (en lenguaje normal)
Mira siempre __dos velas seguidas__: la de la izquierda (referencia) y la de la derecha (la que actúa). NO importa el color de las velas, solo la forma:
- __M2__ → la vela derecha primero "engaña" rompiendo un poco por un extremo de la izquierda (manipulación) pero luego vuelve dentro del rango. Es un aviso de posible giro.
- __M3__ → la vela derecha cierra con fuerza al otro lado, fuera del rango de la izquierda, sin haber hecho ese "engaño" previo.
- __M3+__ → el más completo: primero engaña (rompe un extremo) y además cierra con fuerza al otro lado. Es la señal más fuerte.
(En alcista el "engaño" es por abajo y el cierre fuerte por arriba; en bajista es justo al revés).
## Idea clave
El indicador NO opera por ti: es una ayuda visual para detectar rápido en qué instrumentos hay un patrón y con qué probabilidad histórica, para que tú decidas dónde mirar.
Indicador

Indicador

MTF CVD Synchrony | Rainbow MatrixGENERAL OVERVIEW
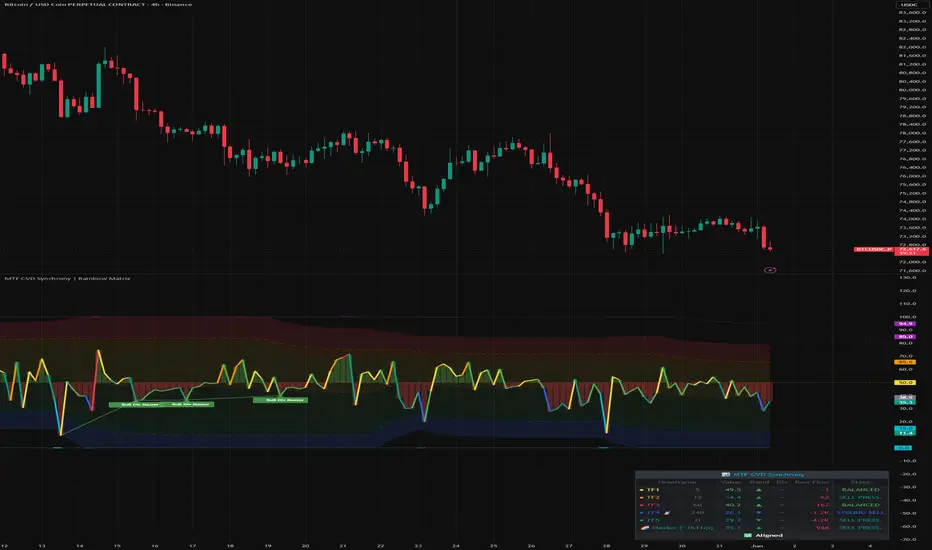
MTF CVD Synchrony is a multi-timeframe directional flow oscillator that condenses five independent CVD (Cumulative Volume Delta) readings — one per Fibonacci-spaced timeframe — into a single weighted Master Line on a zero-centered 0-100 scale, surrounded by per-TF "ghost lines" that fade visually as they diverge from the consensus. The defining feature: 50 is true neutral. Above 50 means buyers are dominating; below 50 means sellers are dominating. The further from 50, the stronger the directional pressure. When the five timeframes align, the rainbow becomes a solid band; when they diverge, the disagreement becomes a visible density property of the indicator itself.
A background histogram visualizes the Master score's deviation from the neutral 50 line — green columns extend up when buyers dominate, red columns extend down when sellers dominate. A compact 7×9 MTF Legend Table surfaces every dimension simultaneously: per-TF resolutions, score values, trend direction, divergence flags, raw flow magnitude, and named directional State — with an antenna marker flagging the row whose timeframe matches your chart's native resolution.
Designed as the directional member of a three-indicator family. Apply all three side-by-side for a complete read: MTF RSI Synchrony shows where price sits in its momentum range; MTF Volume Delta Bar Synchrony shows whether the move has volume magnitude behind it; MTF CVD Synchrony shows who is actually winning — buyers or sellers. Same visual signature, same canonical Fibonacci ratios, same Legend Table layout — instant cross-indicator readability.
WHAT IS THE THEORY BEHIND THIS INDICATOR
Cumulative Volume Delta attempts to answer a question that price and volume alone cannot: in any given bar, were buyers or sellers more aggressive? Traditional volume tells you HOW MUCH traded, but not the DIRECTION of the pressure. A high-volume bar that closes flat tells a very different story from a high-volume bar that closes at its highs — yet raw volume scores them identically.
CVD approximates directional pressure by weighting each bar's volume by where price closed within its range. This indicator uses the Close Location Value (CLV) for that weighting:
clv = ((close − low) − (high − close)) / (high − low)
CLV ranges from +1 (close exactly at the high — maximum buying pressure) to −1 (close exactly at the low — maximum selling pressure), with 0 at the midpoint. Multiplying CLV by volume produces a signed directional contribution per bar: delta_raw = clv × volume. This is more nuanced than the binary tick rule (close > open = buy) used by most "delta" indicators — CLV captures HOW DECISIVELY price closed in its range, not just the sign.
The per-bar delta is then smoothed by EMA and normalized into a bounded 0-100 zero-centered score:
cvd_smooth = EMA(delta_raw, smoothing_length)
max_abs = highest(|cvd_smooth|, normalization_window)
score = 50 + (cvd_smooth / max_abs) × 50
The genius of the zero-centered approach: 50 always means balance, regardless of the asset's structural bias. A score of 75 means buyers are exerting 50% of the maximum recent pressure to the upside; a score of 25 means sellers are exerting 50% of maximum recent pressure to the downside. This is fundamentally different from a percentile rank (which would anchor 50 at the historical median, skewing with structural trends).
Five such scores — one per timeframe (default 5 / 15 / 60 / 240 / D) — are fused via canonical Fibonacci weights (0.15 / 0.20 / 0.25 / 0.25 / 0.15, peak weight on the macro TF3/TF4 where institutional positioning consolidates) into the weighted Master Line.
FEATURES
🔹 Multi-Timeframe CVD Fusion Engine (zero-centered directional scale)
🔹 CVD Histogram (deviation from neutral 50 — green buy / red sell)
🔹 Adaptive Fibonacci Channel (Z-Breathing → Z-Alert → Z-Exhaustion → Black Swan)
🔹 Hybrid Black Swan Zones (static or dynamic — default dynamic)
🔹 Classic Price↔CVD Divergence Detection (per-TF + Master)
🔹 MTF Legend Table (7 columns × 9 rows, with Raw Flow + State, multilingual)
🔹 Multilingual Interface (EN / PT / ES / RU / ZH)
🔹 Multi-Timeframe CVD Fusion Engine
What It Does
Runs five independent CVD scores on Fibonacci-spaced timeframes and fuses them into a single weighted Master Line, with each per-TF reading plotted as a ghost line that fades by distance to the consensus.
Method
On each timeframe, f_cvd_full() computes CLV × volume per bar, smooths it via EMA, and normalizes against a rolling-max window to produce the zero-centered score. The five scores fuse via Fibonacci weights (0.15 / 0.20 / 0.25 / 0.25 / 0.15). Both smoothing length and normalization window are independently configurable per timeframe.
Per-TF smoothing defaults (Wilder-anchored on TF3+TF4):
◇ TF1 (5m): 7 — scalping
◇ TF2 (15m): 10 — day-trading
◇ TF3 (60m): 14 — Wilder canonical
◇ TF4 (240m): 14 — Wilder canonical
◇ TF5 (D): 21 — swing/position
Per-TF normalization windows (each TF's natural horizon):
◇ TF1: 30 (≈2.5h on 5m)
◇ TF2: 50 (≈12.5h on 15m)
◇ TF3: 80 (≈3.3 days on 1h)
◇ TF4: 100 (≈16 days on 4h)
◇ TF5: 150 (≈5 months on Daily)
All request.security calls use lookahead=barmerge.lookahead_off for anti-repaint integrity.
Why It Matters
A 5-minute buy surge means little if the 4-hour and daily flows are decisively selling. The fusion engine reveals whether directional pressure is aligned across timescales (high conviction) or contradictory (a counter-trend bounce inside a larger trend). The ghost-line rainbow makes that alignment visible at a glance.
🔹 Adaptive Fibonacci Channel
What It Does
Six color-coded bands around the Master Line that adapt to its own recent volatility, using the brand's canonical Fibonacci ratios.
Method
Highest/lowest of the Master over a configurable lookback (default 50) are smoothed by EMA (default 10) to form the channel envelope. Bands sit at canonical Fibonacci proportions: Z-Breathing (1.50/1.85), Z-Alert (1.85σ anchor), Z-Exhaustion (2.75/1.85), Black Swan (3.85/1.85). All six band values are mathematically clamped to before rendering, keeping the rainbow inside the visible pane.
Why It Matters
Static thresholds can't adapt to regime changes. The Fibonacci channel calibrates the warning zones to the asset's current directional-flow volatility, so a "climax" on a calm pair and a "climax" on a volatile one both trigger at appropriate statistical extremes.
🔹 Hybrid Black Swan Zones
What It Does
Flags directional flow climax extremes — either at static 85/15 thresholds (BUY CLIMAX / SELL CLIMAX boundaries) or at the dynamic Fibonacci 3.85σ band.
Method
Dynamic Black Swan Mode is ON by default (Fibonacci 3.85σ proportion of the Master channel). Toggle OFF for static 85/15. Each zone renders as a glow line that brightens as the Master approaches. The static reference lines (15/50/85) are shown by default to anchor the zero-centered scale: 85 = purple (buy climax boundary), 50 = yellow (neutral), 15 = aqua (sell climax boundary).
Why It Matters
Directional flow climaxes mark exhaustion points — a BUY CLIMAX (score ≥ 85) means buyers have pushed to a recent extreme, often preceding a pause or reversal; a SELL CLIMAX (≤ 15) marks capitulation. The dynamic mode self-calibrates per asset and regime.
🔹 Classic Price↔CVD Divergence Detection
What It Does
Detects regular bear divergences (price higher high while CVD makes lower high — rally on weakening buy pressure) and bull divergences (price lower low while CVD makes higher low — selling exhausting). Runs on each timeframe AND on the Master line.
Method
Per-TF divergence runs inside request.security via pivot detection on the per-TF CVD score. Master divergence runs on the chart-TF directly, rendering a connecting line + label between pivots (red bear / green bull) on the pane. Per-TF results surface in the Legend Table's "Div" column.
Why It Matters
Price↔flow divergence is one of the most powerful applications of CVD. When price makes a new high but directional flow doesn't confirm, the rally is running on fading conviction — a classic distribution warning. Detecting this per-TF AND on the Master gives both early granular warnings and high-conviction confirmations.
🔹 MTF Legend Table
What It Does
A compact 7×9 table surfacing every dimension of the analysis at a glance.
Method
Rendered via table.new(force_overlay=false) on the pane. Layout:
◇ Row 0: title (spans all columns)
◇ Row 1: column headers — Indicator / Timeframe / Value / Trend / Div / Raw / State
◇ Rows 2-6: per-TF data
◇ Row 7: Master row ("🌈 Master (~XhYm)" with effective TF)
◇ Row 8: MTF Divergence status row
Per-TF cells show: ● TF label (+ antenna 📡 if chart-native), TF resolution, zero-centered score (zone-colored), trend arrow (±0.5 deadzone), divergence (🔺/🔻/—), Raw Flow (compact K/M/B signed magnitude, green if positive / red if negative), and State (directional name, zone-colored).
Why It Matters
The Raw Flow column complements the Value column: Value answers "how strong is the directional pressure?" (the normalized score), while Raw answers "how much actual volume is behind it?" (the absolute flow). A score of 75 with a small raw magnitude is weaker conviction than 75 with a huge raw magnitude. Together with State, the table tells a complete directional story per timeframe.
🔹 Multilingual Interface
What It Does
Translates all HUD labels, status messages, alert text, Legend Table headers, and directional State names to 5 languages: English, Português, Español, Русский, 中文.
Method
A single language dropdown selects the active language via Pine v6's ternary-chain pattern. Code, comments, and configuration tooltips remain in English by convention.
Why It Matters
The Rainbow Matrix family is built for traders worldwide. Multilingual UI removes friction for non-English-native users.
HOW TO USE
Reading the Pane
◇ Master near 50 with ghost lines tight: balanced flow, no directional edge (absorption / equilibrium).
◇ Master rising above 50: buyers gaining control. Above 62 = BUY PRESSURE; above 71 = STRONG BUY.
◇ Master falling below 50: sellers gaining control. Below 38 = SELL PRESSURE; below 29 = STRONG SELL.
◇ Master touches Black Swan High (≥85, purple glow): BUY CLIMAX — buyers at a recent extreme, watch for exhaustion.
◇ Master touches Black Swan Low (≤15, aqua glow): SELL CLIMAX — capitulation, watch for reversal.
◇ Histogram green/red columns: immediate bar-by-bar directional read around the 50 centerline.
Reading the Legend Table
The antenna marker (📡) flags your chart's native timeframe — start there, then scan up/down to see whether faster/slower TFs confirm or contradict the directional bias. Compare Value (pressure strength), Raw (actual flow magnitude), and State (named classification) for each row. The status row summarizes MTF alignment between TF1 and TF5.
Reading Divergences
Master bear divergence (price up + CVD down) = rally on fading buy conviction, distribution warning. Master bull divergence (price down + CVD up) = selling exhausting, potential bottom. Per-TF divergences in the Div column give early granular warnings.
Tactical Combinations
◇ Master BUY CLIMAX + bear divergence + multiple TFs diverging = strongest reversal-from-high signal.
◇ Master SELL CLIMAX + bull divergence = strongest reversal-from-low signal.
◇ Master near 50 + all TFs near 50 + tight ghosts = absorption / coiling, often precedes a directional break.
◇ Triple confluence (the full family): RSI overbought + Volume EXTREME magnitude + CVD STRONG SELL = distribution at the top. RSI oversold + Volume EXTREME + CVD STRONG BUY = accumulation at the bottom. These three indicators answering momentum + magnitude + direction simultaneously is the strongest read the Rainbow Matrix family offers.
INPUTS EXPLAINED
GLOBAL SETTINGS — System Language (EN/PT/ES/RU/ZH), table/label font sizes.
MULTI-TIMEFRAME — AI Auto-Sync TFs; TF1-TF5 manual resolutions (default 5/15/60/240/D); per-TF CVD Smoothing Length (7/10/14/14/21); per-TF CVD Normalization Window (30/50/80/100/150).
ENGINE — Dynamic Black Swan Mode (default ON); Dynamic Channel Lookback (50) and Smoothing (10); Divergence Pivot Lookback (5).
VISUALIZATION — TF1-TF5 colors + show toggles (all ghost lines OFF by default — only Master visible on install); Ghost Fade Sensitivity (3.5); Show Master Line / Rainbow Fills / Black Swan / Dynamic Channel; Show CVD Histogram; Show MTF Legend Table; Show Divergence Column; Show Raw Flow Column; Show State Column; Show Master Divergence Chart Line; Legend position; Show Divergence Event Markers; Show Static Reference Lines (15/50/85, ON by default).
ALERTS — Black Swan crossings (high/low); Strong MTF Divergence; Z-Exhaustion zone entries; Master Classic Divergence.
IMPORTANT NOTES
🔸 Pine Script v6 — uses request.security with lookahead=barmerge.lookahead_off. 16 total security calls (5 CVD score + 5 per-TF divergence + supporting channel calculations). Chart load may take a moment longer than a single-TF indicator.
🔸 CLV approximation, not order-flow tick data — Directional pressure is approximated via the Close Location Value (where price closed within each bar's range), NOT real bid/ask order flow. Pine Script v6 has no tick-by-tick data access in indicator scripts. CLV is a more nuanced approximation than the binary tick rule used by most free-tier "delta" indicators, but it remains an approximation. For true order-flow delta, use dedicated footprint/order-flow tools.
🔸 Zero-centered scale — Unlike the percentile-rank siblings (RSI, Volume Delta Bar), this indicator's 50 is a TRUE neutral (zero net directional flow), not a historical median. This is intentional — direction is inherently signed, so a fixed zero-point is more meaningful than a regime-relative median.
🔸 Normalization warmup — During the first normalization_window bars on each TF, the rolling-max anchor (max_abs) is built from a small sample, so early bars may show exaggerated swings until the window fills. Normal warmup behavior for any rolling-window indicator.
🔸 Repaint behavior — Historical bars use confirmed close data; the current real-time bar updates as ticks arrive. Pivot-based divergence requires confirmation bars before triggering (standard pivot divergence behavior).
🔸 Fibonacci ratios are canonical — The channel proportions (1.50/1.85/2.75/3.85) and fusion weights (0.15/0.20/0.25/0.25/0.15) match the Rainbow Matrix brand standard across all sibling indicators, preserving cross-indicator visual consistency.
🔸 License: MPL 2.0 — open source. Free to fork, modify, and republish under the same license terms.
UNIQUENESS
Three pillars differentiate this from other CVD indicators on TradingView:
1. Multi-timeframe CVD fusion with synchrony as a visual property. Most CVD tools run on a single timeframe. This indicator runs five, fuses them via Fibonacci weights, and expresses directional alignment as a rainbow density — solid when timeframes agree on direction, spread when they disagree. The cross-TF directional consensus becomes immediately readable.
2. True zero-centered scale with CLV weighting. The 50 midpoint is a mathematically meaningful neutral (zero net flow), not a regime-skewed median. And the directional weighting uses Close Location Value — capturing how decisively price closed within each bar's range — rather than the cruder binary tick rule. This combination produces a directional read that stays honest across structural trends.
3. Three complementary readings in one Legend Table, designed as a family. Value (pressure strength), Raw Flow (actual magnitude), and State (named classification) disambiguate a single timeframe's directional picture. And as the directional member of the Rainbow Matrix trio (alongside RSI for momentum and Volume Delta Bar for magnitude), it completes a three-dimensional read of any market: where price is, how big the move is, and who's winning.
Rainbow Matrix AI | Multi-timeframe institutional analysis tools for traders.
🌐 rainbowmatrix.ai
✉️ Contact: contact@rainbowmatrix.ai
Indicador

CandelaCharts - Breadth Divergence📝 Overview
The CandelaCharts - Breadth Divergence indicator identifies structural divergences between the primary chart's price action and a secondary breadth or macroeconomic symbol (such as VALUG (Value Line Geometric Index), USI:ADD (Advance-Decline Issues), or US10Y (Treasury Yields)).
Because you can plug any custom ticker into the indicator, it functions perfectly as an inter-market or macro divergence tool. By analyzing pivot highs and lows, it detects when the underlying market breadth or macro environment fails to confirm the price movement, signaling potential market reversals.
Bearish Divergence: Occurs when the main chart makes a Higher High while the breadth/macro symbol makes a Lower High.
Bullish Divergence: Occurs when the main chart makes a Lower Low while the breadth/macro symbol makes a Higher Low.
📦 Features
Automated Divergence Detection: Accurately maps regular bullish and bearish divergences using customizable pivot points.
Customizable Breadth Symbol: Set any symbol to act as the breadth index to measure internal market strength.
Visual Clarity: Highlights divergence zones with clean lines connecting the pivots and shaded background boxes for easy identification.
Flexible Lookbacks: Complete control over pivot lookback lengths to adapt the sensitivity to any timeframe or volatility condition.
📈 Supported Assets & Timeframes
This indicator is universally compatible with any asset class (Equities, Crypto, Forex, Commodities, Indices) and any timeframe . To adapt the indicator to a different market, you only need to change a single input: the Breadth Symbol . For example:
S&P 500 ( SPY , ES1! ): Set the Breadth Symbol to USI:ADD (Advance-Decline), USI:VOLD (Up/Down Volume), RSP (Equal Weight), or VALUG (Value Line).
Nasdaq 100 ( QQQ , NQ1! ): Set the Breadth Symbol to USI:ADDQ (Nasdaq Advance-Decline), USI:VOLDQ , QQQE (Equal Weight), or VXN (Nasdaq Volatility).
Forex / Currencies (e.g. EURUSD , GBPUSD ): Set the Breadth Symbol to DXY (US Dollar Index) or US10Y (US 10-Year Treasury Yield).
Crypto ( BTCUSD ): Set the Breadth Symbol to TOTAL3 (Altcoin Market Cap) or BTC.D (Bitcoin Dominance).
⚙️ Settings
Breadth Symbol: The ticker used to compare against the main chart (Default: VALUG - Value Line Geometric Index).
Pivot Left / Right: The number of bars required to the left and right to confirm a pivot high or low.
Bullish / Bearish Colors: Customize the color of the divergence lines and background boxes. The backgrounds automatically apply a 90% opacity to the chosen colors.
⚡️ Showcase
S&P 500 ( ES1! ) vs. VALUG : Show a bullish divergence where ES makes a lower low but the Value Line Geometric Index makes a higher low.
Nasdaq 100 ( NQ1! ) vs. ADDQ : Highlight a scenario where the cap-weighted NQ pushes higher but the Nasdaq Advance-Decline diverges, signaling weakness in the broader tech sector.
Ethereum ( ETHUSD ) vs. TOTAL3 : Show a bearish divergence where Ethereum makes a higher high, but the broader Altcoin market cap fails to follow suit.
Euro ( EURUSD ) vs. DXY : Display an inverse divergence setup using the US Dollar Index.
🚨 Alerts
This indicator features built-in alerts using the `alert()` function. You can create an alert on the indicator to be notified whenever a Bullish or Bearish Breadth Divergence is detected.
⚠️ Disclaimer
Trading involves significant risk, and many participants may incur losses. The content on this site is not intended as financial advice and should not be interpreted as such. Decisions to buy, sell, hold, or trade securities, commodities, or other financial instruments carry inherent risks and are best made with guidance from qualified financial professionals. Past performance is not indicative of future results.
Indicador

Estrategia

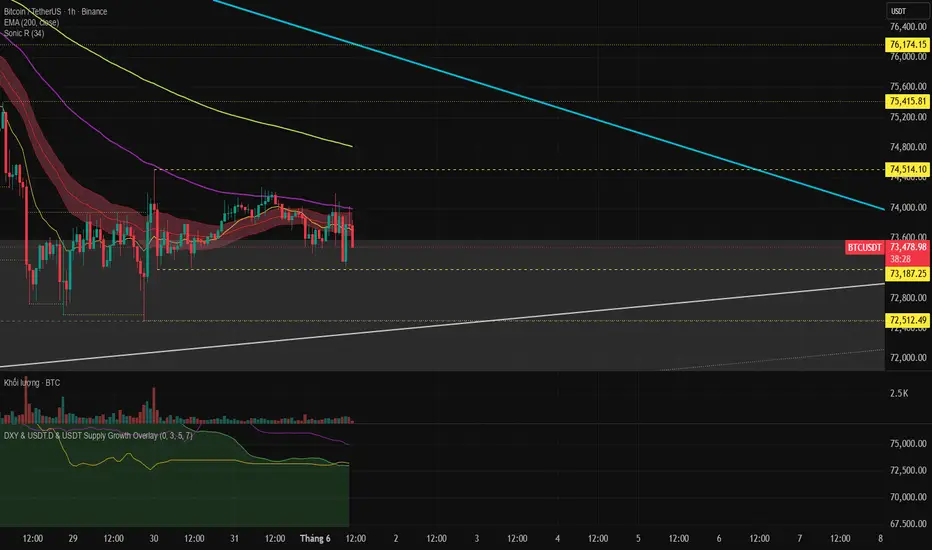
Sonic R (13-34-89) by DQT Sonic R System - EMA 13-34-89-200
Description:
The Sonic R indicator is built upon a multi-layered Exponential Moving Average (EMA) system combined with a Price Action Channel (PAC), designed to identify market trends, dynamic support/resistance zones, and high-probability trade entries.
Core Components:
1. Price Action Channel (PAC) — EMA 34 Band
The PAC is calculated using EMA 34 applied to High, Low, and Close prices, forming a dynamic channel that represents the short-term equilibrium zone. Price above the channel signals bullish momentum; price below signals bearish pressure.
2. EMA Trend System:
🟡 EMA 13 — Fast-reacting short-term trend, captures immediate price momentum
🔴 EMA 34 — Core support/resistance zone displayed as a red band, acts as the market's heartbeat
🟣 EMA 89 — Medium-term trend filter, smooths out market noise
🟢 EMA 200 — Long-term trend anchor, defines the overall market direction
How to Use:
Price above all EMAs → strong uptrend, prioritize buy setups
Price below all EMAs → strong downtrend, prioritize sell setups
Price inside the red EMA 34 band → market consolidating, wait for breakout confirmation
EMAs stacked in order (13 > 34 > 89 > 200) → trend is clean and strong, highest confidence entries
Best Used On: All timeframes — most effective on H1, H4, and Daily charts. Indicador