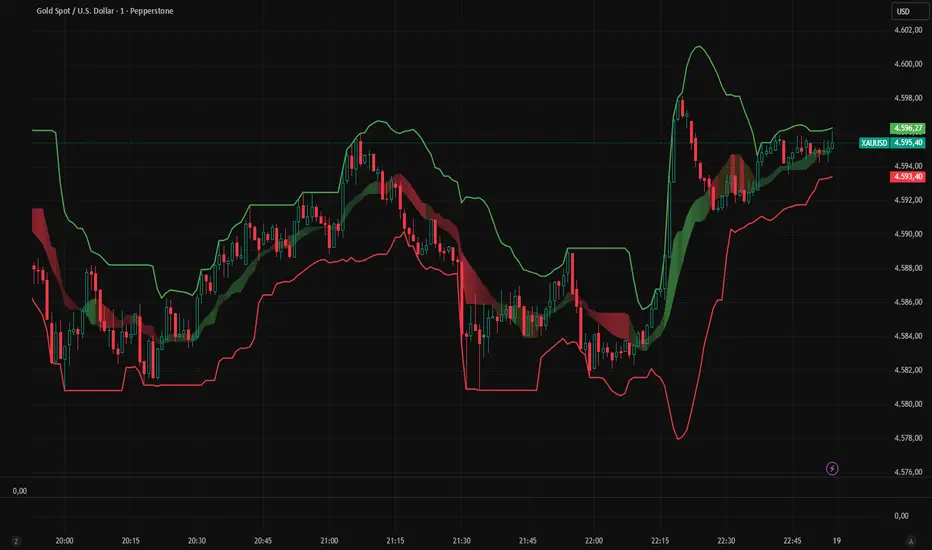
TrendLock | Multi-Timeframe Supertrend Donchian BreakoutStrategy Explanation
TrendLock combines three independent confirmations before it will ever open a trade: a primary Supertrend for local trend direction, a higher-timeframe Supertrend that must agree before entries are allowed, and a Donchian channel breakout that times the actual entry once both trend layers align. A volume-spike filter adds a final check that real participation is behind the move, not just drift.
The idea is simple: most Supertrend scripts fire on every local flip and get chopped up in ranges. TrendLock only engages when the bigger picture and the immediate price action are both pointing the same way, and only pulls the trigger on a genuine breakout — not just a trend-line touch.
Exits are ATR-based (stop and target sized off current volatility, not fixed percentages), with an optional early exit if the primary Supertrend flips against the position.
Features
Dual-timeframe Supertrend agreement filter (toggle on/off)
Donchian channel breakout entry trigger, plotted with a shaded channel
Volume-spike confirmation filter
ATR-based stop loss and take profit
Optional trend-flip exit independent of the stop/target
Long-only, short-only, or both-direction modes
Background tint shows HTF/LTF agreement at a glance
Built-in alert conditions for long and short signals
Tips
Pick an HTF meaningfully above your trading timeframe (e.g. 15m chart → 4H filter, 1H chart → 1D filter). Too close and the filter does nothing; too far and setups become rare.
Test the HTF filter on and off separately — it should reduce trade count and whipsaws, not just trade count.
Donchian lookback and ATR lengths interact: a longer Donchian window means fewer, larger breakouts, so widen your ATR stop/target multipliers accordingly.
Try disabling the volume filter on lower-liquidity assets, where volume data can be noisy or unreliable.
Backtest across several unrelated symbols and timeframes using the same input values — if it only works on one chart, the settings are likely overfit rather than a real edge.
Warnings
This is a backtesting and research tool, not financial advice — past performance in the Strategy Tester does not predict future results.
request.security calls for the HTF Supertrend can behave differently between the visible chart and actual live execution; always forward-test on a paper account before risking real capital.
Breakout strategies are prone to false starts in choppy markets even with trend filters — expect a real losing-streak tail in the backtest, not just the equity curve's best stretch.
Commission, slippage, and order-fill assumptions in the Strategy Tester are approximations; verify against your actual broker/exchange fee schedule before sizing a live position.
The HTF filter and volume filter are optional and default to specific settings — review every input before deploying, don't assume the defaults suit your instrument or timeframe.
Estrategia

AMD Po3 with Live Edge Stats WillyAlgoTrader Version OrGa## English
### AMD Po3 with Live Edge Stats — OrGa
The **OrGa version** is an enhanced New York Session-focused adaptation of the original AMD Po3 concept by WillyAlgoTrader.
The indicator is designed to identify **Power of Three / AMD market cycles**:
**Accumulation → Manipulation → Distribution**
Instead of treating every liquidity grab as a trade signal, the script first detects a statistically compressed accumulation range. A valid manipulation requires price to sweep one side of the range and subsequently **close back inside the range**. Only after this confirmation is the Distribution phase activated.
### Core Logic
**Accumulation**
* Detects compressed ranges using a Donchian-based volatility percentile model
* Default range boundaries are derived from confirmed pivot highs and lows
* Minimum range maturity prevents very young consolidations from generating premature sweep signals
**Manipulation**
* Detects liquidity sweeps above or below the accumulation range
* A sweep alone is not sufficient
* Price must return and close back inside the range within the configured number of bars
* If price fails to return, the event is classified as a breakout rather than a manipulation
**Distribution**
* A confirmed sweep below the range projects an upward distribution
* A confirmed sweep above the range projects a downward distribution
* The confirmed Distribution candle acts as the reference entry candle
### 🐊 Entry Signals
Confirmed Distribution entries are displayed directly on the chart:
**🐊 D ▲ = Long setup**
**🐊 D ▼ = Short setup**
The signal is generated only after candle close.
The entry emoji can be changed in the indicator settings.
### Reference Trade Model
For every confirmed setup the indicator calculates:
* Reference Entry
* Stop Loss
* Distribution Target
* Risk-to-Reward Ratio
* Risk distance in %
* Trade outcome statistics
The Stop is placed beyond the full manipulation extreme with an ATR-based safety buffer.
The Distribution target is calculated using a configurable Fibonacci extension.
**OrGa default: 1.618**
The Fib extension remains fully adjustable, allowing values such as:
* 1.272
* 1.5
* 1.618
* 2.0
The target should be interpreted as an expected distribution objective rather than a mandatory take-profit level.
### OrGa Liquidity & Confluence Model
The OrGa version adds contextual liquidity levels to help evaluate the quality of each AMD setup.
Available confluences include:
* Previous Day High / Previous Day Low
* London High / London Low
* Daily Open
* New York Session VWAP
Each confirmed Distribution setup receives a **Confluence Score**.
Example:
**🐊 D ▲ 3/4**
The score helps distinguish a random range sweep from a sweep occurring at meaningful market liquidity.
By default, the confluence score is informational and does **not** block signals.
An optional minimum score filter can be enabled if only higher-confluence setups should be traded.
### New York Session Optimisation
The OrGa configuration is primarily designed around the **15-minute chart** and the New York trading session.
Default workflow:
**4H Trend Bias → 15M AMD Setup → optional 5M Execution**
The default New York manipulation window is:
**09:30–12:00 America/New_York**
Using the native New York timezone automatically accounts for US daylight-saving changes. Traders using European chart time therefore do not need to manually adjust the session throughout the year.
### Higher-Timeframe Bias
The OrGa default HTF filter is:
**4H Close vs EMA 50**
* Above EMA50 → Long distributions preferred
* Below EMA50 → Short distributions preferred
The HTF data uses the previous confirmed higher-timeframe candle to avoid future-data leakage.
If a manipulation is rejected by the HTF bias, the range can optionally re-arm and wait for a sweep of the opposite side.
### Alerts
TradingView alerts are available for confirmed entries.
Separate conditions are provided for:
**🐊 OrGa LONG Entry**
**🐊 OrGa SHORT Entry**
Entry signals are confirmed on candle close.
The script also supports dynamic alerts for:
* Liquidity Sweep
* Confirmed Distribution
* Target reached
* Stop hit
* Timeout
Webhook JSON formatting is available for external integrations.
### Repainting
The core AMD signal logic is evaluated on **confirmed candles only**.
The higher-timeframe bias uses confirmed HTF data.
Pivot-based range boundaries require confirmation bars, which introduces normal pivot confirmation lag, but this is not future leakage.
The script is therefore designed for live use without intentional future-data leakage or classic signal repainting.
### Recommended Usage
The indicator should not be used as a blind Buy/Sell system.
Higher-quality setups typically combine:
* Valid accumulation
* Liquidity sweep
* Return inside the range
* 4H directional bias
* PDH / PDL or London liquidity
* Daily Open positioning
* Session VWAP alignment
* Strong New York timing
For refined execution, a confirmed 15M Distribution signal can be followed by a 5M market-structure confirmation such as CHOCH, FVG retest or liquidity reclaim.
The objective of the OrGa version is not to generate more signals, but to identify **cleaner and more contextual AMD setups with transparent risk, targets and live statistics**.
---
## Deutsch
### AMD Po3 with Live Edge Stats — OrGa
Die **OrGa-Version** ist eine auf die New-York-Session ausgerichtete Weiterentwicklung des ursprünglichen AMD-Po3-Konzepts von WillyAlgoTrader.
Der Indikator sucht nach **Power-of-Three- bzw. AMD-Marktzyklen**:
**Accumulation → Manipulation → Distribution**
Dabei wird nicht jeder Liquidity Grab automatisch als Trading-Signal interpretiert. Zuerst muss eine statistisch komprimierte Accumulation Range entstehen. Danach muss eine Range-Grenze gesweept werden und der Kurs anschliessend **wieder innerhalb der Range schliessen**. Erst dann wird die Distribution bestätigt.
### Kernlogik
**Accumulation**
* Erkennt enge Ranges über ein Donchian-basiertes Volatilitäts-Perzentil
* Die Range-Grenzen werden standardmässig aus bestätigten Pivot Highs und Pivot Lows gebildet
* Eine Mindest-Reifezeit verhindert Signale aus sehr jungen und instabilen Ranges
**Manipulation**
* Erkennt Liquidity Sweeps oberhalb oder unterhalb der Accumulation Range
* Ein Sweep alleine ist noch kein Signal
* Der Kurs muss innerhalb der definierten Anzahl Kerzen wieder in die Range zurückkehren und dort schliessen
* Erfolgt keine Rückkehr, wird die Bewegung als Breakout und nicht als Manipulation gewertet
**Distribution**
* Sweep unterhalb der Range → erwartete Distribution nach oben
* Sweep oberhalb der Range → erwartete Distribution nach unten
* Die bestätigte Distribution-Kerze bildet den Referenz-Entry
### 🐊 Entry-Signale
Bestätigte Distribution-Setups werden direkt im Chart dargestellt:
**🐊 D ▲ = Long-Setup**
**🐊 D ▼ = Short-Setup**
Das Signal entsteht erst nach dem Schluss der Kerze.
Das Entry-Emoji kann in den Einstellungen geändert werden.
### Referenz-Trade-Modell
Für jedes bestätigte Setup berechnet der Indikator:
* Referenz-Entry
* Stop Loss
* Distribution Target
* Risk-to-Reward
* Risikoabstand in %
* Ergebnisstatistiken
Der Stop liegt hinter dem vollständigen Manipulations-Extrem und erhält zusätzlich einen ATR-basierten Sicherheitsabstand.
Das Distribution Target basiert auf einer frei einstellbaren Fibonacci Extension.
**OrGa-Standard: 1.618**
Der Wert kann jederzeit beispielsweise auf folgende Werte geändert werden:
* 1.272
* 1.5
* 1.618
* 2.0
Das Ziel ist als erwartete Distribution-Reichweite zu verstehen und nicht zwingend als fixer Take Profit.
### OrGa Liquidity- und Confluence-Modell
Die OrGa-Version ergänzt zusätzliche Marktlevels, damit die Qualität eines AMD-Setups besser beurteilt werden kann.
Berücksichtigte Confluences:
* Previous Day High / Previous Day Low
* London High / London Low
* Daily Open
* New York Session VWAP
Jedes bestätigte Distribution-Setup erhält einen **Confluence Score**.
Beispiel:
**🐊 D ▲ 3/4**
Dadurch lässt sich unterscheiden, ob lediglich irgendeine Range-Grenze gesweept wurde oder ob der Sweep gleichzeitig an relevanter Marktliquidität stattgefunden hat.
Standardmässig dient der Score nur als Zusatzinformation und blockiert keine Signale.
Optional kann ein Mindestscore aktiviert werden, wenn nur Setups mit höherer Confluence gehandelt werden sollen.
### Optimierung für die New-York-Session
Die OrGa-Konfiguration ist primär für den **15-Minuten-Chart** und die New-York-Session ausgelegt.
Empfohlener Workflow:
**4H Trend Bias → 15M AMD Setup → optional 5M Execution**
Das standardmässige Manipulationsfenster für New York lautet:
**09:30–12:00 America/New_York**
Durch die Verwendung der echten New-York-Zeitzone werden Sommer- und Winterzeit automatisch berücksichtigt. Bei einem europäischen TradingView-Chart muss die Session deshalb nicht laufend manuell angepasst werden.
### Higher-Timeframe Bias
Der OrGa-Standard verwendet:
**4H Close gegenüber EMA50**
* Über EMA50 → Long-Distributionen bevorzugt
* Unter EMA50 → Short-Distributionen bevorzugt
Für den HTF-Bias wird ausschliesslich die vorherige bestätigte 4H-Kerze verwendet.
Wird eine Manipulation vom HTF-Bias abgelehnt, kann die bestehende Range optional re-armed werden und auf einen Sweep der gegenüberliegenden Seite warten.
### TradingView-Alarme
Für bestätigte Entries stehen separate TradingView-Alarmbedingungen zur Verfügung:
**🐊 OrGa LONG Entry**
**🐊 OrGa SHORT Entry**
Die Entry-Alarme werden erst nach bestätigtem Candle Close ausgelöst.
Zusätzlich unterstützt der Indikator dynamische Alarme für:
* Liquidity Sweep
* bestätigte Distribution
* Target erreicht
* Stop getroffen
* Timeout
Für externe Integrationen kann eine Webhook-JSON-Ausgabe aktiviert werden.
### Repainting
Die eigentliche AMD-Signallogik wird ausschliesslich auf **bestätigten Kerzen** ausgewertet.
Auch der Higher-Timeframe Bias basiert auf bestätigten HTF-Daten.
Die Pivot-Grenzen benötigen einige Kerzen zur Bestätigung. Dadurch entsteht ein normaler Pivot-Bestätigungs-Lag, jedoch kein Future Leak.
Der Indikator ist damit für den Live-Einsatz ausgelegt und verwendet keine absichtliche zukünftige Kursinformation.
### Empfohlene Anwendung
Der Indikator sollte nicht als blindes Buy-/Sell-System verwendet werden.
Hochwertige Setups kombinieren idealerweise:
* saubere Accumulation
* Liquidity Sweep
* Rückkehr innerhalb der Range
* passenden 4H Bias
* PDH / PDL oder London Liquidity
* passende Position gegenüber dem Daily Open
* Session-VWAP-Bestätigung
* gutes Timing innerhalb der New-York-Session
Für einen präziseren Entry kann nach einem bestätigten 15M-Distribution-Signal auf dem 5M-Chart beispielsweise auf CHOCH, FVG-Retest oder Liquidity Reclaim gewartet werden.
Das Ziel der OrGa-Version ist nicht, möglichst viele Signale zu erzeugen, sondern **sauberere und besser kontextualisierte AMD-Setups mit transparentem Risiko, Zielprojektion und Live-Statistik zu liefern**.
Indicador

Cloud Pro | Ichimoku Confluence Overview
An Ichimoku Kinko Hyo strategy built around one core idea: not all Tenkan/Kijun crosses are equally trustworthy. Every cross is automatically classified as Strong, Neutral, or Weak based on where it happens relative to the cloud, and you choose exactly which tiers are allowed to trigger trades — independently for long entries, long exits, short entries, and short exits. Layered on top: a higher-timeframe trend filter, ATR- or fixed-%-based risk management, and risk-based position sizing.
Features
Signal-strength tiers — TK crosses classified Strong / Neutral / Weak by their position relative to the cloud, with separate tier selectors for long entry, long exit, short entry, and short exit
Trading mode selector — run Long-only, Short-only, or Both from one script
Higher-timeframe trend filter — requires the HTF Tenkan/Kijun relationship to agree with the trade direction before entry
Flexible stop/target modes — choose ATR-based or fixed-percentage stops and targets, or disable stops entirely
Risk-based position sizing — size each trade off a target % of equity at risk given the current stop distance, rather than a flat allocation, with a max-position-size safety cap
Optional cloud-thickness size scaling — modestly scale position size based on how thick the cloud is relative to ATR, as a rough confidence proxy
Kumo twist markers — flags upcoming cloud color changes in the displaced cloud before price reaches them
Live signal dashboard — price-vs-cloud, cloud color, TK state, HTF trend, current position, and next trade size, all in one table
Clean visual defaults — cloud and dashboard on by default; Tenkan, Kijun, and Chikou lines are off by default and toggle back on individually
Brief Strategy Explanation
Ichimoku combines trend, momentum, and support/resistance into one system. This script uses the Tenkan/Kijun cross as its trigger and grades that cross's reliability by its position relative to the cloud at the time it fires — a cross above a bullish cloud is a stronger signal than one happening inside or below it. You decide, via the tier selectors, how selective to be. A higher-timeframe filter and configurable stop/target then manage trade quality and risk from there.
Tips for Use
Start on the Daily timeframe — the default 9/26/52 periods are built around it
Use liquid, trend-prone instruments — Ichimoku is trend-following at its core and tends to underperform on range-bound names
Strong Only entry tiers will produce very few signals in backtests — start with Strong + Neutral and tighten from there once you've seen trade frequency
The Chikou Span and its offset are plotted but not wired into entry/exit logic in this version — treat it as a manual visual confirmation tool if you want to eyeball it before taking a signal
Stops and targets in ATR mode are recalculated each bar rather than fixed at entry — be aware of this when reading backtest results, since it means the effective risk on a trade can drift with volatility after entry
If Use Cloud Scaling is on, it applies to both sizing modes — check the "Next Size" dashboard value before assuming Risk-Based mode is holding your risk % exactly
Backtest across a trending period and a sideways period separately — this version has no regime filter, so performance in choppy markets may look worse without one
Estrategia

DNSE VN301!, Donchian Break Out Strategy"Donchian Channel Breakout with SMA Trend Filter" is a trend-following breakout strategy designed to capture sustained price movements while filtering out low-probability signals. The Donchian Channel identifies breakouts by tracking the highest high and lowest low over a specified lookback period, generating potential entry signals when price closes outside the recent trading range. Because breakouts during sideways or low-volatility markets often fail, the strategy incorporates a Simple Moving Average (SMA) as a trend filter.
Long signals are prioritized when the SMA is rising, while Short signals are prioritized when the SMA is falling, ensuring trades align with the prevailing market trend. By combining breakout detection with trend confirmation, the strategy aims to reduce false breakouts and improve overall signal quality.
*By default: each VN Futures contract requires VND 30,000,000 of initial margin. The strategy assumes an initial capital of VND 100,000,000, resulting in a fixed position size of 3 contracts for each trading signal.
To better reflect real-market trading conditions, the backtest incorporates a commission of VND 10,000 per contract and a minimum slippage assumption of 3 ticks on every executed trade.
Settings & Strategy Configuration:
Chart: recommended 15-minute timeframe
Donchian Channel Period: 20
SMA Period: 200
Stop Loss: 10 points
Take Profit: 20 points
SMA Trend Filter: On / Off
Use Take Profit: On / Off
Time Filter: On / Off
Trading Session: 09:00 – 14:30
Trade Direction: Long / Short / Both
Default Script Settings:
The strategy calculates the upper and lower bands of the Donchian Channel using the selected lookback period. A breakout above the upper band may indicate buying pressure, while a breakout below the lower band may indicate selling pressure.
When the SMA(200) trend filter is enabled, the script only allows Long entries when SMA(200) is rising and only allows Short entries when SMA(200) is falling. When the SMA filter is disabled, the strategy can trade both directions based only on Donchian Channel breakout signals.
Entry & Exit Conditions:
Entry Long:
Close Price > Upper Donchian Channel
AND SMA(200) is rising, if the SMA filter is enabled
AND the signal appears within the selected trading session
AND Long trading is allowed by the trade direction setting
Exit Long:
Stop Loss: 10 points from entry price
Take Profit: 20 points from entry price, if enabled
Opposite Donchian breakout signal
Position reversal when a valid Short signal appears
Automatic close at the end of the trading session
Entry Short:
Close Price < Lower Donchian Channel
AND SMA(200) is falling, if the SMA filter is enabled
AND the signal appears within the selected trading session
AND Short trading is allowed by the trade direction setting
Exit Short:
Stop Loss: 10 points from entry price
Take Profit: 20 points from entry price, if enabled
Opposite Donchian breakout signal
Position reversal when a valid Long signal appears
Automatic close at the end of the trading session
Disclaimers:
Trading futures contracts carries a high degree of risk, and price movements can be highly volatile. This script is intended as a reference and research tool only. It should be used by individuals who understand futures trading, have assessed their own risk tolerance, and are knowledgeable about the strategy’s logic.
All investment decisions are the sole responsibility of the user. DNSE bears no liability for any potential losses incurred from applying this strategy in real trading. Past performance does not guarantee future results.
______________________________________________________________________
"Chiến lược Breakout Donchian Channel kết hợp bộ lọc xu hướng SMA" là một chiến lược giao dịch theo xu hướng, được thiết kế nhằm tận dụng các đợt bứt phá giá mạnh đồng thời giảm thiểu các tín hiệu nhiễu. Donchian Channel xác định các điểm breakout bằng cách theo dõi mức giá cao nhất và thấp nhất trong một khoảng thời gian xác định, từ đó tạo tín hiệu khi giá đóng cửa vượt ra khỏi vùng dao động gần nhất. Do các tín hiệu breakout trong giai đoạn thị trường đi ngang hoặc biến động thấp thường có xác suất thất bại cao, chiến lược sử dụng thêm đường trung bình động đơn giản (SMA) làm bộ lọc xu hướng.
Khi đường SMA đang dốc lên, chiến lược ưu tiên các tín hiệu Long; ngược lại, khi SMA dốc xuống, chiến lược ưu tiên các tín hiệu Short, giúp các lệnh giao dịch đi cùng xu hướng chính của thị trường. Bằng cách kết hợp tín hiệu breakout với xác nhận xu hướng, chiến lược hướng tới việc giảm các tín hiệu phá vỡ giả và nâng cao chất lượng giao dịch.
*Theo mặc định, mỗi hợp đồng VN Futures yêu cầu ký quỹ ban đầu là 30.000.000 VNĐ. Chiến lược giả định vốn ban đầu là 100.000.000 VNĐ, tương ứng với quy mô vị thế cố định là 3 hợp đồng cho mỗi tín hiệu giao dịch được tạo ra.
Để phản ánh sát hơn điều kiện giao dịch thực tế, kết quả kiểm định (backtest) được giả định với phí giao dịch là 10.000 VNĐ cho mỗi hợp đồng và độ trượt giá (slippage) tối thiểu là 3 bước giá (ticks) đối với mỗi lệnh được khớp.
Cài đặt & cấu hình chiến lược:
Biểu đồ: khuyến nghị khung 15 phút
Chu kỳ Donchian Channel: 20
Chu kỳ SMA: 200
Cắt lỗ: 10 điểm
Chốt lời: 20 điểm
Bộ lọc xu hướng SMA: Bật / Tắt
Dùng chốt lời: Bật / Tắt
Bộ lọc giờ: Bật / Tắt
Khung giờ giao dịch: 09:00 – 14:30
Chiều giao dịch: Mua / Bán / Cả hai
Cài đặt mặc định của script:
Chiến lược tính toán biên trên và biên dưới của Donchian Channel dựa trên chu kỳ được chọn. Khi giá phá lên biên trên, lực mua có thể đang chiếm ưu thế. Khi giá phá xuống biên dưới, lực bán có thể đang chiếm ưu thế.
Khi bật bộ lọc xu hướng SMA(200), script chỉ cho phép lệnh Mua khi SMA(200) dốc lên và chỉ cho phép lệnh Bán khi SMA(200) dốc xuống. Khi tắt bộ lọc SMA, chiến lược có thể giao dịch cả hai chiều chỉ dựa trên tín hiệu breakout của Donchian Channel.
Điều kiện vào và thoát lệnh:
Vào lệnh Mua:
Giá đóng cửa > Biên trên Donchian Channel
VÀ SMA(200) dốc lên, nếu bật bộ lọc SMA
VÀ tín hiệu xuất hiện trong khung giờ giao dịch
VÀ chiều giao dịch cho phép lệnh Mua
Thoát lệnh Mua:
Cắt lỗ: 10 điểm từ giá vào lệnh
Chốt lời: 20 điểm từ giá vào lệnh, nếu bật
Có tín hiệu breakout ngược chiều
Đảo chiều khi xuất hiện tín hiệu Bán hợp lệ
Tự động đóng lệnh khi hết khung giờ giao dịch
Vào lệnh Bán:
Giá đóng cửa < Biên dưới Donchian Channel
VÀ SMA(200) dốc xuống, nếu bật bộ lọc SMA
VÀ tín hiệu xuất hiện trong khung giờ giao dịch
VÀ chiều giao dịch cho phép lệnh Bán
Thoát lệnh Bán:
Cắt lỗ: 10 điểm từ giá vào lệnh
Chốt lời: 20 điểm từ giá vào lệnh, nếu bật
Có tín hiệu breakout ngược chiều
Đảo chiều khi xuất hiện tín hiệu Mua hợp lệ
Tự động đóng lệnh khi hết khung giờ giao dịch
Tuyên bố rủi ro:
Giao dịch hợp đồng tương lai có mức độ rủi ro cao và giá có thể biến động mạnh. Script này chỉ phục vụ mục đích tham khảo, nghiên cứu và kiểm thử. Người dùng cần hiểu rõ giao dịch phái sinh, khẩu vị rủi ro cá nhân và logic của chiến lược trước khi áp dụng vào giao dịch thực tế.
Mọi quyết định đầu tư thuộc trách nhiệm của người dùng. DNSE không chịu trách nhiệm cho bất kỳ khoản lỗ nào phát sinh từ việc sử dụng chiến lược này trong giao dịch thực tế. Hiệu quả trong quá khứ không đảm bảo kết quả trong tương lai.
Estrategia

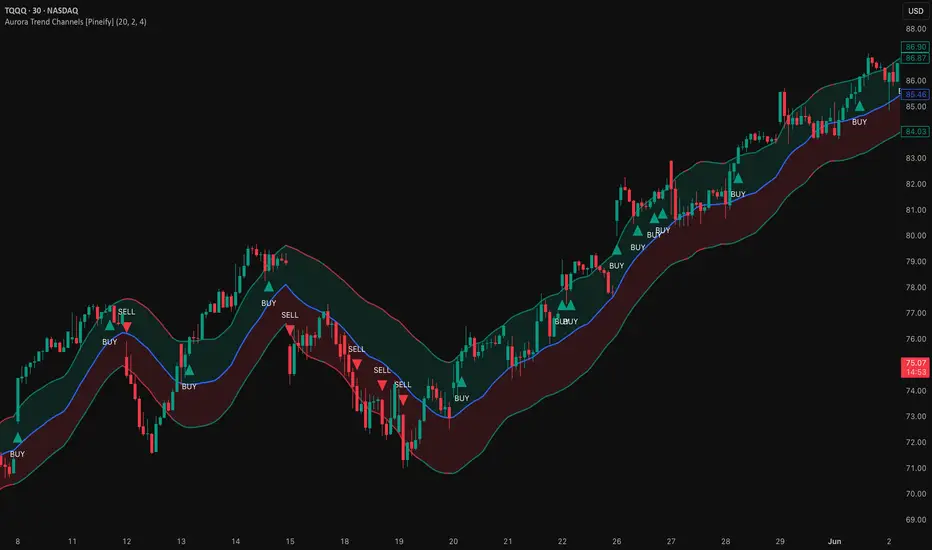
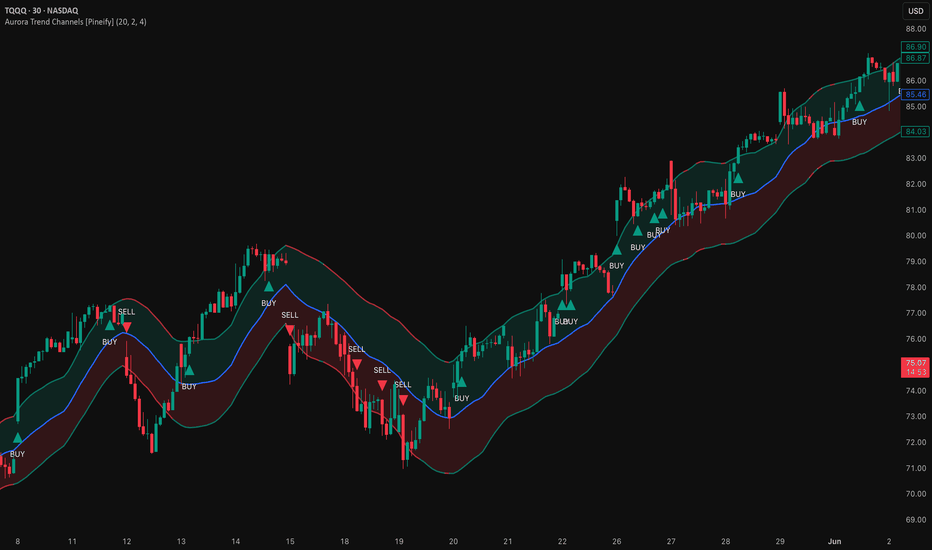
Aurora Trend Channels [Pineify]Aurora Trend Channels
A volatility-adjusted trend channel built around a Volume-Weighted Moving Average (VWMA) center and Average True Range (ATR) outer bands. Unlike standard Bollinger Bands — which expand with statistical price deviation — the outer bands here track true-range volatility, including gap moves, and the center responds to volume weight rather than giving every candle equal influence. The channel shifts color with trend direction, and breakout signals fire only when price exits the outer ATR envelope, filtering out the weak cross-center noise that produces most false signals in simpler systems.
Key Features
VWMA center line: high-volume candles steer the trend reference more than low-volume ones, aligning the basis with where real trading activity occurred
ATR-scaled bands: channel width expands during volatile sessions and contracts during quiet ones — the envelope automatically adapts to current market conditions
EMA post-smoothing: a second smoothing pass over the raw VWMA and ATR values removes single-bar spikes without adding significant lag, producing cleaner channel edges
Dynamic color coding: the entire channel flips between bullish green and bearish red in real time, giving an instant visual read on the current trend state
Split-zone fills: the upper half of the channel is shaded bullish, the lower half bearish, so you can immediately see where price sits within the structure
Outer-band breakout signals: BUY and SELL labels appear only when price crosses outside the ATR bands — a higher bar than a simple basis crossover
Alert conditions for both breakout directions, compatible with TradingView's built-in alert system
How It Works
The calculation runs in two stages: building the channel, then smoothing it.
VWMA basis: Each bar's close is weighted by its volume over the Channel Length lookback. High-volume candles pull the moving average toward the prices at which the most trading happened — a demand-weighted trend reference rather than a simple time average.
ATR envelope: The Average True Range over the same lookback is multiplied by the Band Multiplier and added/subtracted from the VWMA. ATR accounts for gap moves that high-low range ignores, so the bands genuinely reflect the full volatility environment.
EMA smoothing: Both the raw VWMA and the raw band values are passed through an EMA of length Smoothing Factor . This second pass removes the jagged edges that appear when a single high-volatility bar distorts the ATR calculation, without requiring a longer primary lookback.
Trend coloring: A simple price-versus-basis comparison determines channel color on each bar. The VWMA already embeds volume context, so a bare close comparison is sufficient — no additional filter is needed.
Signal conditions: Buy signals trigger on crossover (close crosses above the upper band), sell signals on crossunder (close crosses below the lower band). Crossing the outer ATR band means price moved beyond the typical volatility range, not merely through the center — it takes more momentum to get there.
How the Components Work Together
The core design choice here is pairing a volume-sensitive center with a volatility-sensitive envelope. Either alone has a weakness: a VWMA reacts to where volume traded but does not adapt its width to current market conditions; ATR bands sized around a simple SMA treat every candle's price equally regardless of liquidity. Combining them gives a channel that is anchored to real trading activity on the vertical axis and calibrated to actual volatility on the horizontal axis.
The EMA smoothing layer serves a specific function that would be lost with a single longer lookback. A longer primary window reduces noise but also makes the channel slower to respond to trend changes. Post-smoothing via a short EMA removes the erratic single-bar edges while keeping the primary length aggressive enough to track trends in real time. The result is a channel that reacts quickly but does not telegraph every spike.
Because signals require a full close outside the outer band rather than a touch or intrabar breach, they are naturally scarce. On a daily chart using default settings, expect a few signals per month rather than a few per week — which means each one carries more weight but also that the indicator is not designed for high-frequency entries.
Trading Ideas and Insights
Use the buy signal as an initial breakout entry trigger, then use retests of the upper band as add-on levels on the assumption the band becomes dynamic support after a breakout. A failure to hold the band after retest may indicate the move is exhausting.
The channel fill colors work well as a trend filter for a separate entry system. If the channel is red, consider suppressing buy signals from another indicator until the channel flips green — a simple but effective regime filter.
On higher timeframes (daily, weekly), the VWMA center often acts as a mean-reversion target after extended moves. Price that runs far from the basis and then loses momentum may retrace toward it; this is not directly signaled, but visually obvious on the chart.
In ranging markets, price will oscillate between the bands without triggering outer-band breakouts. This is by design — the indicator is quiet in ranges and active in trending environments. If you see frequent small candles touching but not closing outside the bands, that is the market telling you conditions are not favorable for breakout trades.
Past patterns do not guarantee future results. All signals should be evaluated within the context of the broader market structure and combined with appropriate risk management.
Unique Aspects
VWMA as the trend center, not SMA or EMA — the volume weighting means the channel is anchored where liquidity was concentrated, not just where time passed
ATR bands instead of standard-deviation bands: the outer envelope reflects the full range including gaps, making it more robust on instruments with frequent overnight moves or news-driven spikes
Two-stage smoothing design: the primary length drives responsiveness, the post-smooth EMA removes erratic band edges — decoupling these two concerns rather than collapsing them into a single longer period
Breakout signals on outer band crosses only — no signals on basis crossovers, which substantially reduces noise on trending instruments
Split fill that shades upper and lower zones in separate colors, giving an intuitive sense of channel structure without relying solely on the band lines
How to Use
Add the indicator to any chart. It works on all timeframes and instruments, though it was designed primarily for trending markets on the daily and 4-hour charts.
Observe the channel color. Green indicates price is above the VWMA (bullish); red indicates below (bearish). Use this as a broad market context filter.
Watch for BUY labels (triangle below bar) when price closes above the upper band, and SELL labels (triangle above bar) when price closes below the lower band. These indicate breakouts beyond the typical ATR volatility range.
After a breakout signal, watch whether price holds the outer band on any pullback. A clean retest and bounce can serve as a secondary entry point.
To set alerts: right-click the indicator → Add Alert → select "Aurora Buy Alert" or "Aurora Sell Alert".
Customization
Channel Length (default: 20) — Controls both the VWMA lookback and the ATR period. Lower values (10–14) produce a fast, reactive channel suitable for intraday charts. Higher values (30–50) create a more stable channel that filters out shorter swing noise, better suited to daily or weekly context.
Band Multiplier (default: 2.0) — Scales the ATR to set band width. At 2.0 on most instruments, outer band crosses are relatively uncommon — perhaps a few per month on a daily chart. Reducing to 1.5 produces more frequent signals; increasing to 2.5 or 3.0 reserves signals for only the most decisive momentum moves.
Smoothing Factor (default: 4) — The EMA period applied after the primary calculation. Values of 1–3 produce crisper but more jagged band edges; values of 5–8 create visually cleaner bands with slightly more lag at band turns. Most users will not need to change this.
Bullish/Bearish/Basis colors — Adjust to match your chart theme or personal preference without affecting calculation.
Conclusion
Aurora Trend Channels targets the specific problem of defining when a price move is large enough to matter — not just trending, but trending beyond the normal noise range. The VWMA-plus-ATR construction ties the channel to both volume activity and realized volatility, giving it more market context than either component alone. It works best as part of a broader system: the channel for trend direction and breakout signals, combined with a secondary tool for entry timing and position sizing within the trend.
Indicador
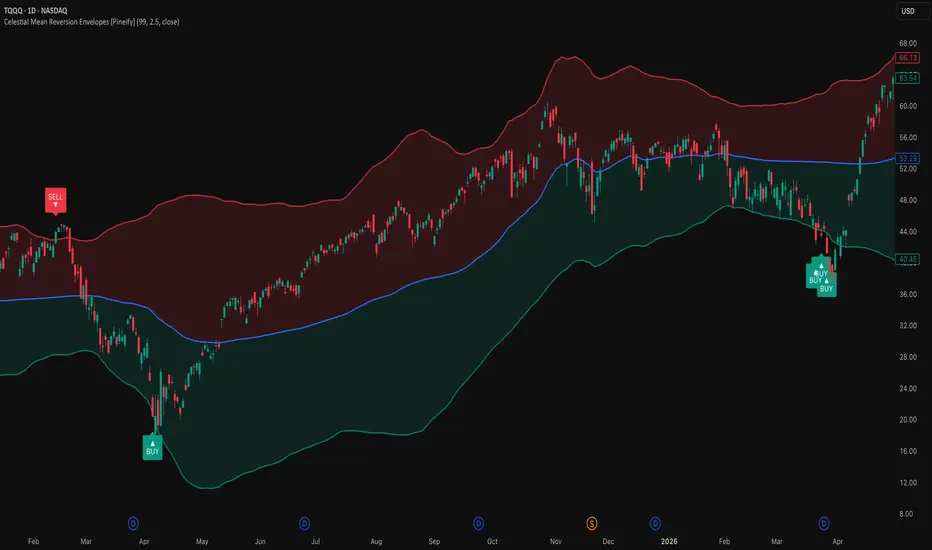
Celestial Mean Reversion Envelopes [Pineify]Celestial Mean Reversion Envelopes
This indicator identifies mean reversion opportunities by wrapping an adaptive moving average in standard deviation envelopes and signaling when price snaps back inside after piercing a band. Rather than using a fixed-period moving average as the baseline, the central line adapts its speed based on how frequently price is setting new highest highs or lowest lows — it tracks price quickly in trending conditions and almost freezes in ranges, so the bands shift organically with market character.
Key Features
Adaptive mean that responds to trend intensity rather than time alone — sluggish during consolidation, responsive during strong moves
Standard deviation envelopes calibrated to actual recent volatility, not fixed ATR multiples
Buy and sell signals generated on band crossunders/crossovers, confirming the reversal rather than anticipating it
Translucent overbought/oversold shading between the mean and each band for quick visual context
Built-in alerts for both reversion directions
How It Works
The calculation runs in two stages: first building the adaptive mean, then constructing the envelopes around it.
Extreme tracking — On each bar, the indicator checks whether a new highest high or lowest low has formed over the lookback window. Bars where a fresh extreme appears are marked with a value of 1; all other bars get 0. The SMA of these binary values over the same window gives the fraction of recent bars that produced a new extreme.
Squaring the fraction — Raising that fraction to the power of 2 produces a nonlinear smoothing coefficient. When trends are strong and new extremes appear on most bars, the coefficient approaches 1 and the adaptive mean tracks price closely. In a choppy range where few new extremes form, the coefficient collapses near zero and the mean barely moves. This technique is inspired by TRAMA (Trend Regularity Adaptive Moving Average) by e2e4mfck.
Adaptive mean update — Each bar the mean nudges toward the source price by the amount determined by the coefficient. The result is an average that effectively switches between "responsive" and "parked" behavior depending on what the market is doing.
Standard deviation envelopes — The upper and lower bands are placed at ±(StdDev × multiplier) from the adaptive mean, where StdDev is computed over the same lookback period. This makes the band width proportional to recent volatility: wider when price has been swinging, tighter during quiet periods.
Signal generation — A buy signal fires when source crossesunder the lower band (price dipped below, then closed back above it). A sell signal fires on a crossover of the upper band. The crossunder/crossover logic requires price to actually breach and then retrace — a bar that merely touches the band without closing through it does not trigger.
How the Components Work Together
The adaptive mean solves a problem that conventional envelope indicators ignore: when a market trends hard, a static EMA or SMA falls behind, making the upper band a poor reference for "too far, too fast." Because the adaptive mean accelerates during trends, the envelopes stay anchored to current price levels rather than lagging. This means the bands are more likely to represent genuine statistical extremes rather than just momentum riding.
The standard deviation layer adds a second dimension. Instead of a fixed pip or percentage offset, the band width expands when the market is volatile and contracts when it is calm — naturally suppressing signals during low-volatility compression and allowing wider moves during active sessions before flagging exhaustion.
Together these two layers create a filter that roughly says: "price reached a statistically unusual distance from where the trend currently sits, then pulled back." That combination reduces fakeout signals compared to using static bands on a lagging baseline.
Trading Ideas and Insights
On higher timeframes (daily, 4H), buy signals at the lower band that coincide with a key support level or volume spike may offer higher-confidence entries. Look for the adaptive mean to be flattening — it suggests the trend is pausing rather than reversing.
In intraday trading, signals that appear after a sharp impulsive leg tend to perform better than signals generated inside a choppy range. The adaptive mean will often be steeply sloped after an impulse, indicating the signal is against the micro-trend — exercise more caution and use tighter risk.
When price oscillates between the bands repeatedly without triggering signals, the market is likely in a low-volatility squeeze. A breakout attempt that immediately pulls back (triggering a sell or buy signal) at the edge of that range can mark the failed breakout early.
The gradient fill zones serve as a running reference for where price stands relative to the mean. Price persistently in the upper (red) fill with a rising adaptive mean suggests a strong trend; consider fading only when price crosses back into the neutral zone.
Past performance of any signal pattern does not guarantee future results. Always combine signals with broader context — structure, volume, and higher-timeframe bias. These signals indicate potential exhaustion; they do not predict reversal magnitude.
Unique Aspects
The squaring of the trend-regularity fraction is the core differentiator. Most adaptive averages use linear coefficients; squaring creates a much sharper distinction between trending and ranging states, so the mean spends more time "frozen" during ranges and snaps to price quickly when momentum genuinely kicks in.
Signals require price to close back inside the band, not just touch it — this one-bar confirmation step reduces noise from wicks that briefly pierce a band and immediately reverse without a real close-to-close move.
Band width is purely standard-deviation based rather than ATR-derived, which means the scaling responds to the actual statistical dispersion of the source series rather than the high-low range. On instruments with many gaps this can produce meaningfully different widths than ATR bands.
How to Use
Add the indicator to any chart. It overlays directly on the price pane.
The blue line is the adaptive mean. When it is rising steeply the market is in an upward trending mode; when flat or slightly sloped, it is ranging.
The red-shaded zone above the mean is the overbought area; the green-shaded zone below is the oversold area. Price spending extended time in one zone suggests momentum, not necessarily exhaustion.
A green BUY label below a bar means price closed back above the lower band after briefly breaking it — potential reversion entry. A red SELL label above a bar means the opposite.
To set alerts, use the "Buy Alert" or "Sell Alert" conditions from the indicator's alert panel (Once Per Bar Close recommended to avoid premature triggers on intrabar wicks).
Customization
Adaptive Mean Length (default: 99) — Controls both the highest/lowest lookback and the SMA averaging window for the smoothing coefficient. Higher values slow the mean considerably and widen bands; lower values increase reactivity but also produce more frequent and less reliable signals.
Envelope Multiplier (default: 2.5) — Scales the standard deviation distance. 2.0 suits instruments with tighter typical ranges; raise to 3.0+ on highly volatile assets to avoid constant band touches that don't represent genuine extremes.
Source (default: close) — Change to hl2 or hlc3 to incorporate high and low into the baseline; close is typically sufficient for most reversion setups.
Color inputs — Adjust bullish/bearish/mean colors and toggle the gradient fill on or off depending on visual preference.
Conclusion
Celestial Mean Reversion Envelopes pairs an adaptive mean that adjusts its responsiveness to trend regularity with volatility-scaled deviation bands, targeting the specific moment when a stretched move closes back inside its statistical boundary. The approach is best suited to traders who wait for confirmation — the crossunder/crossover trigger ensures you're acting on a completed reversal bar, not an open wick. As with any mean-reversion tool, it works best when context confirms the extension is exhaustion rather than breakout continuation.
Indicador

Aurora Expanded Trend Cloud [Pineify]Aurora Expanded Trend Cloud
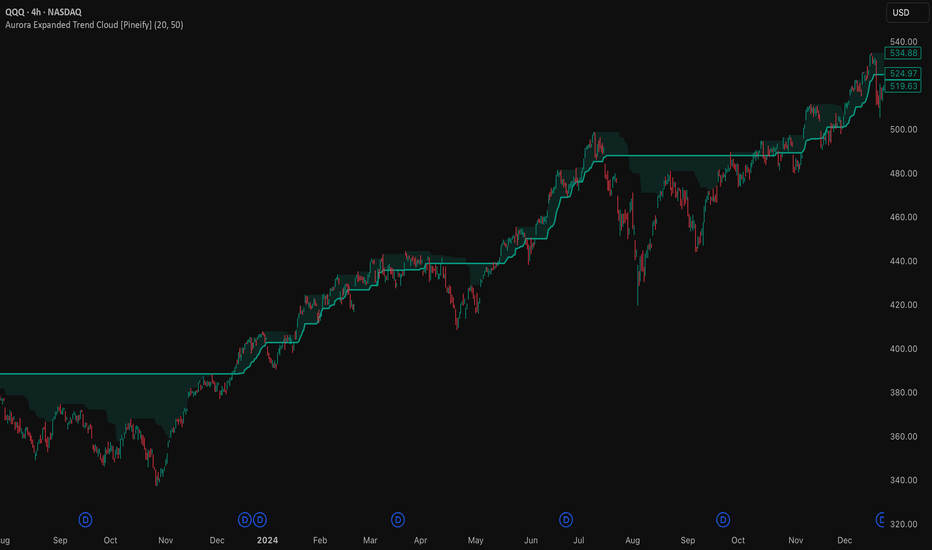
This indicator uses a Donchian Channel breakout to define trend direction and then projects an asymmetric "cloud" zone above or below price — a visual region where the market is expected to find support (in uptrends) or resistance (in downtrends). What makes it different from a plain Donchian system is the one-directional trailing cloud boundary: once the floor starts rising (or the ceiling falling), it never reverses, creating a ratcheting effect that tightens as a trend matures without whipping back on normal pullbacks.
Key Features
Trend direction determined by Donchian Channel breakouts — clean, objective, no oscillator subjectivity
Cloud width scales with the current channel width, so the zone automatically widens during high-volatility periods and compresses when price is ranging
One-way trailing boundary: the cloud floor only moves up in bull trends; the cloud ceiling only moves down in bear trends — reducing false exits during healthy retracements
Trend-start circles mark the exact bar where each breakout first confirmed, providing a clear visual reference for entry timing
Trend state exposed in the Data Window for use in external scripts or Pine Strategy bridges
How It Works
The calculation pipeline has three stages:
Channel Construction — Each bar, the indicator computes the N-bar highest high (upper band) and lowest low (lower band). The difference is the channel width, which serves as a volatility proxy.
Expansion Offset — An expansion percentage (default 50 %) is applied to the channel width to derive an offset. For example, on a bar where the channel spans 10 points, a 50 % setting produces a 5-point offset. This offset is added to the lower band (bullish cloud floor) or subtracted from the upper band (bearish cloud ceiling).
One-Directional Trail — Rather than placing the cloud boundary exactly at the shifted band each bar, the indicator uses math.max (bullish) or math.min (bearish) against the prior trail value. Once the floor is at level X, it will not drop below X even if the Donchian lower band temporarily dips — the level "locks in" and can only continue advancing. On a trend flip, the trail resets from the new band anchor.
How the Components Work Together
The Donchian breakout sets the trend but is inherently reactive — it waits for price to close beyond the N-bar extreme, so the first signal can be a bar or two late on fast moves. The cloud's one-way trail compensates for this by providing a persistent, non-retreating reference level throughout the trend. Because the floor never pulls back, it acts as a natural trailing stop zone: if price closes below the green cloud boundary, the bullish structure has likely deteriorated beyond normal noise. The two mechanisms are complementary — breakout for entry, one-directional trail for management.
The expansion percentage links cloud width to current volatility. On a stock moving 1 % a day in a tight channel, the cloud stays narrow. During a high-momentum phase where the channel widens, the cloud expands proportionally, giving the trade more room to breathe. This avoids one of the common frustrations with fixed-offset trailing stops: premature exits during volatile but sustained trends.
Trading Ideas and Insights
When a green circle appears and the cloud floor begins to form below price, it may signal an early-stage uptrend. Consider entries on the first close above the upper band with the cloud floor as an initial stop reference.
As a trend matures, the cloud floor rises and tightens. A close back into the cloud zone — especially with a wick that tags the floor — may indicate a pause rather than a reversal. A close below the cloud often warrants reassessment.
Compression of the Donchian Channel ahead of a circle signal (upper and lower bands converging) can suggest accumulated energy before a breakout. These setups may produce cleaner follow-through than breakouts from already-wide channels.
On higher timeframes the cloud acts as a broad trend filter. If price is above the green cloud on the daily, consider filtering intraday long setups only from that direction.
Past behavior does not guarantee future results. The indicator has no predictive capability — it identifies conditions based on historical price structure. Always combine with independent confirmation and proper risk management.
Limitations to Be Aware Of
The Donchian breakout condition requires a close beyond the N-bar extreme. On fast-moving bars, the entry signal appears one bar after the actual breakout, which can result in a worse fill price.
The one-way trail means the cloud boundary never retreats during a trend, but it also means it can diverge significantly from current price during extended moves. In those situations, the cloud is no longer a tight stop reference — it reflects the starting anchor of the trend, not current structure.
In choppy, range-bound conditions, the indicator will produce frequent trend flips (circles in rapid alternation). No trend-following tool performs well in this regime; watch the channel width as a rough proxy for regime type.
How to Use
Add the indicator to any chart and timeframe. It works on overlay mode, drawing directly on price.
A green cloud below price confirms a bullish trend. A red cloud above price confirms a bearish trend. The solid-colored boundary line is the active trailing level.
Colored circles mark trend start bars. Green below price = trend flipped bullish. Red above price = trend flipped bearish.
Use the Trend Length input to adjust sensitivity. Shorter values (10–15) react faster and suit shorter timeframes or momentum styles. Longer values (30–50) filter more noise and suit swing or position trading.
Adjust the Expansion % to control how far the cloud boundary sits from the Donchian band. Higher values give more room and widen the cloud; lower values keep the trail tight to price.
Customization
Trend Length (default: 20) — Lookback window for the Donchian Channel. Larger values require a more sustained breakout to flip the trend and produce fewer, higher-conviction signals. Smaller values increase responsiveness at the cost of more noise.
Expansion % (default: 50) — How wide the cloud is expressed as a fraction of the channel width. At 100 %, the cloud spans the full channel. At 0 %, the cloud collapses to a line at the channel boundary. Values between 30 %–70 % work well for most setups.
Conclusion
Aurora Expanded Trend Cloud combines a Donchian breakout system with a volatility-adaptive, one-directional trailing zone to give both a clear trend signal and a persistent visual reference level throughout the move. It is best suited for traders who want an objective, rule-based trend overlay without manual line-drawing — particularly on trending assets and timeframes where Donchian systems historically perform best.
Indicador
Breakout Evidence Board [TradeDots]Breakout Evidence Board
Summary
This indicator detects Donchian-style breakouts (a close beyond the highest close or lowest close over a user-configured lookback) and scores each breakout from 0 to 100 across seven independent factors of supporting evidence. The output is a composite "Evidence Score" with a tier label of Strong, Valid, Mixed, or Weak. It is intended as a quality filter for continuation entries — traders use it to separate breakouts that occur in supportive context from breakouts that occur on thin volume, late extension, or counter-trend conditions.
What is original here
Breakout detection from prior-bar Donchian extremes is standard and is already present in many public scripts. The contribution of this script is the seven-factor evidence panel applied at the moment of the breakout. The factors quantify the breakout's pre-conditions (compression), the breakout's immediate character (volume, ATR expansion, close location), its position relative to mean (VWAP distance), and its alignment with higher-timeframe context. The combination — and the transparency of each factor's contribution to the final score — is what differentiates this script. Each factor weight is exposed as an input so the model can be inspected, tuned, or partially disabled.
How it works
Breakout detection uses the highest close and lowest close over the prior donchian_len bars, indexed by so the breakout level is the previous bar's extreme rather than the current bar's own extreme. A bullish breakout is registered when the current close exceeds the prior-bar highest close; the bearish case is symmetric. To avoid re-firing on every bar that remains above the prior high, only the first breakout (a transition from "not broken" to "broken") is treated as a signal. Optionally, a "Require Compression Before Breakout" filter rejects breakouts that do not follow a mature Bollinger Bandwidth compression — useful in choppy markets. Signal evaluation is gated by barstate.isconfirmed.
When a breakout is detected, the following seven factors are computed.
1. Compression score. The Bollinger Bandwidth at the prior bar, expressed as a percentile rank over the configured lookback. The score is inverted: tight pre-break (low BBW percentile) yields a high score, while a breakout from already-expanded volatility yields a low score.
2. ATR expansion score. The current bar's ATR percentile rank. High ATR percentile means the breakout is moving with thrust, not just drifting across the level.
3. Volume score. The current bar's volume percentile rank.
4. Close-location score. Where the close sits within the bar's high-low range. For a bullish breakout the score rewards a close near the bar's high; for a bearish breakout, a close near the bar's low. A weak close (in the middle of the range or against direction) indicates indecision.
5. VWAP distance score. The absolute distance from an anchored VWAP, expressed in ATR units. A breakout that is already extended from VWAP scores lower than a breakout that occurs near the mean. The anchor is user-selectable: Session, Week, or Month.
6. HTF alignment score. A higher-timeframe trend reference is fetched and the breakout direction is compared against the HTF trend. Aligned breakouts score full credit; neutral HTF scores half; counter-HTF scores zero.
7. Compression-to-expansion confirmation. A binary factor that earns full credit only when the prior bar was in a mature compression and the current bar shows clear expansion (ATR percentile above a threshold). This captures the classic "coil release" pattern.
The composite is the weighted average of all seven factors. Tier mapping:
Strong : score 80 or higher
Valid : score 60 to 79
Mixed : score 30 to 59
Weak : below 30
Repainting and data integrity
Signal generation and labels are gated by barstate.isconfirmed. Donchian extremes are indexed by so they refer to the prior bar's high or low, not the current bar's own value. The higher-timeframe trend reference is fetched with request.security() using a prior-bar source together with barmerge.lookahead_on — the standard non-repainting idiom that returns the last confirmed HTF bar's value. This pattern does not access future data.
How to read the chart
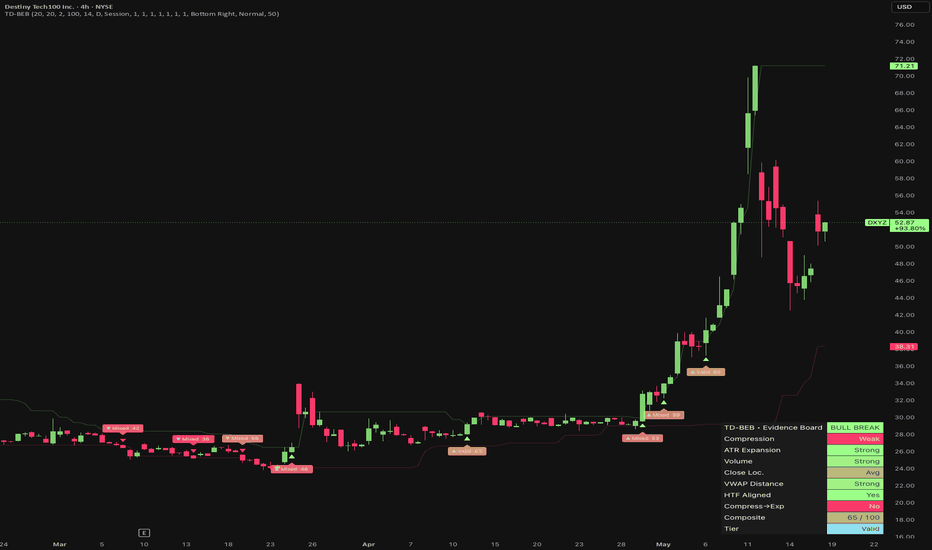
The Donchian rails (prior-bar highest and lowest closes) are plotted as thin green and red lines so the breakout level is visible.
A small triangle marks the breakout bar (below for bullish, above for bearish).
A directional tier label is placed on the breakout bar, color-graded from red at low scores to green at high scores. Text shows the tier and numeric composite score.
An "Evidence Board" dashboard panel displays each of the seven factors as a row, with gradient cells reflecting that factor's contribution, plus the composite score and tier.
All sub-scores are also output as hidden plots for use in the Data Window and alert messages.
Inputs
Inputs are grouped into five sections.
Core Settings : Donchian lookback, Bollinger Band length and standard-deviation multiplier, percentile-rank lookback, ATR length.
Filters : HTF trend reference, VWAP anchor (Session / Week / Month), optional "Require Compression Before Breakout" toggle.
Score Tuning : a 0 to 1 weight for each of the seven factors.
Visual Settings : panel position, panel size, label cap, marker toggles.
Any Alert() function call conditions : per-alert boolean toggles.
Alerts
Four alert conditions are provided: Strong Bull Breakout (bullish breakout with score at or above 80), Strong Bear Breakout, Any Breakout with Score ≥ 70, and Any Breakout with Score ≥ 80. Each alert is declared via alertcondition() for the native TradingView alert UI and is fired programmatically through alert() when the corresponding input toggle is enabled. Programmatic alerts use alert.freq_once_per_bar_close. Alert message templates include {{ticker}}, {{interval}}, and {{close}} placeholders.
How to use this script
This is a continuation filter, not a complete system.
Look for a chart setup where a breakout would be your trade thesis (range break, base break, retest of a prior high, etc.).
Wait for a breakout marker.
Read the Evidence Board panel. A Strong or Valid score with HTF aligned is the highest-conviction case.
A Weak score on a Donchian breakout usually indicates either thin volume, no prior compression, or counter-trend pressure — useful as a "skip this one" signal.
The script does not place orders or define stops; sizing and exits remain the user's responsibility.
Limitations and honest caveats
The composite is a heuristic evidence weighting, not a probability. A Strong tier does not imply a specific success rate.
Fast news-driven breakouts may print with little prior compression and may receive lower scores than they deserve. The "Require Compression" filter is therefore off by default; users who want it strict can enable it.
The anchored VWAP uses a fixed anchor choice (Session, Week, or Month). It does not support multiple simultaneous VWAPs or user-defined anchor points.
Donchian breakouts on the current chart timeframe may not align with breakouts a user perceives at higher timeframes; consider the HTF alignment factor as a coarse check, not as multi-timeframe structure analysis.
The script does not include any backtesting, position sizing, or order management logic.
Disclaimer
This script is published for informational and educational purposes. It is not investment advice and is not a recommendation to buy or sell any instrument. Past appearance of any pattern, including high-quality breakouts, does not guarantee future behaviour. Users are solely responsible for their own trading decisions and risk management.
Indicador
Donchian Retest Readiness [AGPro Series]# Donchian Retest Readiness
🧠 Core Idea
After price breaks a Donchian Channel boundary, is the broken edge ready to act as a clean retest and continuation reference?
📌 Overview / What it does
Donchian Retest Readiness is a breakout-boundary decision-support script built around Donchian Channels.
The script maps the rolling Donchian high, low, and midpoint, detects channel breaks, builds a retest pocket around the broken edge, scores retest quality from 0 to 100, and projects continuation lanes with target rails.
It does not predict price direction, automate trades, or provide guaranteed signals. It organizes Donchian break context, retest quality, channel edge, risk, and action state into a clean visual workflow.
🎯 Purpose & Design Philosophy
Many breakout tools mark the moment price leaves a range, but the difficult part often comes after the break: deciding whether the broken edge is being respected.
This script was built for traders who want to evaluate Donchian breakout retests without treating every new high or new low as a complete trading idea.
The design supports structured observation: break first, retest pocket second, hold quality third.
⚡ Why This Script Is Different
Most Donchian tools focus on channel highs and lows.
This script does NOT stop at drawing the Donchian Channel.
Instead, it converts the broken channel edge into a decision zone, evaluates whether price returns to that area, measures hold quality, and summarizes readiness with a clear 0-100 score.
⚙️ Methodology
1. Donchian Channel Mapping
2. Breakout Boundary Detection
3. Retest Pocket Construction
4. Hold / Failure Evaluation
5. 0-100 Retest Readiness Score
6. Panel And Alert Output
🗺️ How to Read the Chart
The Donchian Channel shows the rolling high, low, and midpoint.
The retest pocket appears around the broken channel edge after a breakout.
READY RETEST labels appear when price interacts with the broken edge and holds with enough quality.
Continuation lanes and target rails show the projected area beyond the accepted retest context.
The panel summarizes Break State, Retest Score, Channel Edge, Risk, and Action.
🚦 Signals & States
• READY → A qualified Donchian retest has formed.
• MONITOR → A Donchian break is active and retest behavior is being evaluated.
• WAIT → The channel is valid, but no active break / retest context is present.
• INVALIDATED → Price failed back through the broken channel edge.
• BLOCKED → The Donchian channel is not suitable for evaluation under current settings.
🔔 Alerts Logic
Bullish Donchian Retest Ready triggers when price breaks above the Donchian high, returns to the broken edge, and holds with enough score quality.
Bearish Donchian Retest Ready triggers when price breaks below the Donchian low, returns to the broken edge, and holds with enough score quality.
Donchian Break Watch alerts mark the first boundary break when enabled.
Donchian Retest Invalidated triggers when price fails back through the broken edge.
Alerts are attention markers, not trade instructions.
🧩 Confluence Logic
The retest score combines wick response, close pressure beyond the broken edge, proximity to the retest pocket, breakout impulse, relative volume, and channel width quality.
When several of these conditions align, the retest context becomes stronger.
📊 When to Use
• Breakout markets
• Trend continuation setups
• Pullbacks after new highs or new lows
• Donchian Channel structure analysis
• Intraday or swing contexts where retest behavior matters
⚠️ When NOT to Use
• Very low-liquidity symbols
• Extremely noisy chop
• Abnormal spread conditions
• News spikes where retest behavior is unstable
• Markets where every boundary break immediately reverses
🎛️ Key Inputs
• Donchian Length → controls the rolling channel high and low.
• ATR Length → controls retest pocket depth, buffers, targets, and label spacing.
• Minimum Channel Width → blocks weak channels that are too narrow.
• Retest Pocket ATR → controls how wide the broken-edge retest pocket is.
• Minimum Ready Score → controls how selective READY states are.
• Projection Bars → controls how far pockets and targets extend.
• Visual settings → control channel, fill, pocket, lane, labels, tags, and panel.
🖥️ Interface & Visual Design
The script uses a clean AG Pro panel to summarize the current Donchian context.
The visual hierarchy is designed to keep the channel visible while making the active retest pocket and READY label easy to see.
Default settings keep failed and early watch labels off so publication screenshots remain clean.
🧪 Practical Usage Workflow
1. Read the panel state.
2. Check the Donchian channel boundary.
3. Wait for a break and retest pocket.
4. Evaluate whether price holds the broken edge.
5. Review target rails and failure risk.
🔍 Interpretation Guidelines
A READY retest means the broken Donchian edge is being respected according to the script rules.
It does not mean price must continue.
An invalidated retest means price failed back through the broken edge and the breakout context lost quality.
🚫 What This Script Is NOT
This script is not a prediction engine.
It is not a buy or sell signal generator.
It is not an automated trading system.
It does not guarantee breakouts, continuation, or reversals.
⚠️ Limitations & Transparency
Donchian behavior can vary by symbol, timeframe, volatility, and liquidity.
Shorter timeframes may produce more noise.
Longer Donchian lengths may react more slowly.
The script should be interpreted within broader structure, market regime, and risk context.
🧠 Market Context Notes
Donchian edges often become meaningful when market participants react to new highs, new lows, and breakout continuation attempts.
The strongest contexts usually combine a clean boundary break, controlled retest, and enough continuation room.
🧾 Use Case Examples
When price breaks above the Donchian high and later retests the broken edge without closing back through it, the script may mark a bullish READY RETEST.
When price breaks below the Donchian low and retests the edge from below with enough quality, the script may mark a bearish READY RETEST.
When price breaks out and then closes back through the broken edge, the retest can become invalidated.
🧱 System Philosophy
This script follows the AGPro Series approach: structured context, practical scoring, clean visuals, and decision-support states instead of noisy prediction claims.
🔐 Non-Promise Statement
No script can provide certainty.
No output should be treated as guaranteed.
All states are rule-based analytical markers.
📉 Risk Disclosure
Trading involves risk.
Users are responsible for their own decisions, risk management, and position sizing.
This script is for educational and analytical purposes only and does not provide financial advice.
📚 Educational Note
The purpose of this script is to help users study Donchian Channel breakout and retest behavior through a structured visual framework.
Indicador

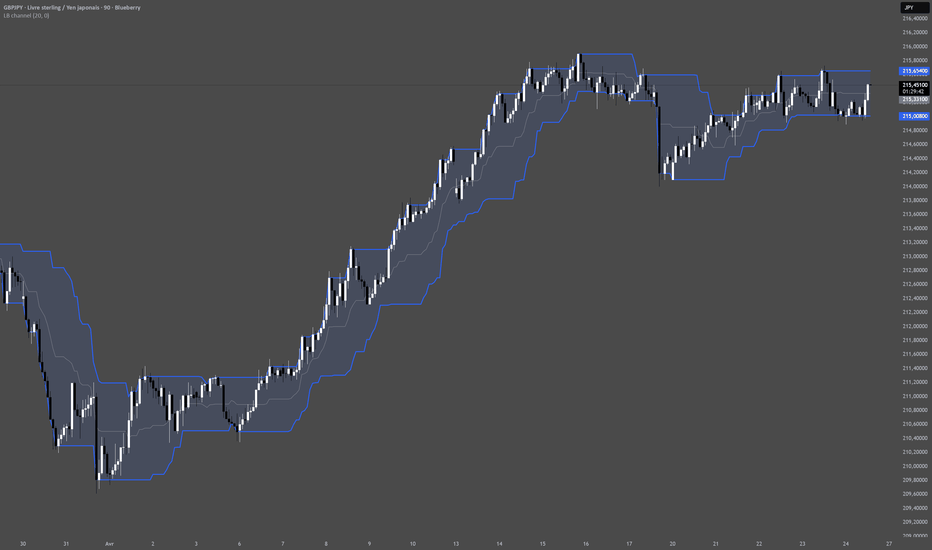
Luis channel
Luis Barlier Channel (LB Channel) – Technical Overview
1. Core Concept & Calculations
The LB Channel is a price envelope indicator that generates three lines based on a lookback period (default: 20 bars).
Key Innovation: Ignores wicks entirely, focusing only on candle bodies:
Body High (BH):
max(open, close)
max(open, close)
Body Low (BL):
min(open, close)
min(open, close)
Channel Lines:
Upper Bound:
Highest(BH,length)
Highest(BH,length)
Lower Bound:
Lowest(BL,length)
Lowest(BL,length)
Basis (Middle):
(Upper+Lower)/2
2. Visual & Functional Features
Dynamic S/R Zone: Blue boundaries act as support/resistance, updating only when new body highs/lows break prior extremes.
Value Area Fill: Light blue shading (90% transparency) highlights if price is "inside" or "outside" the recent range.
Offset Control: Shift entire channel forward/backward for cycle analysis.
3. The Problem It Solves: Wick Noise
Traditional channels (Donchian, Bollinger) react to volatility spikes:
Long wicks from news/liquidity hunts artificially widen ranges
Generate false breakouts
Distort "fair value"
LB Channel Solution: Filters noise by using only committed price action (body highs/lows), ignoring temporary spikes that lack follow-through. Indicador
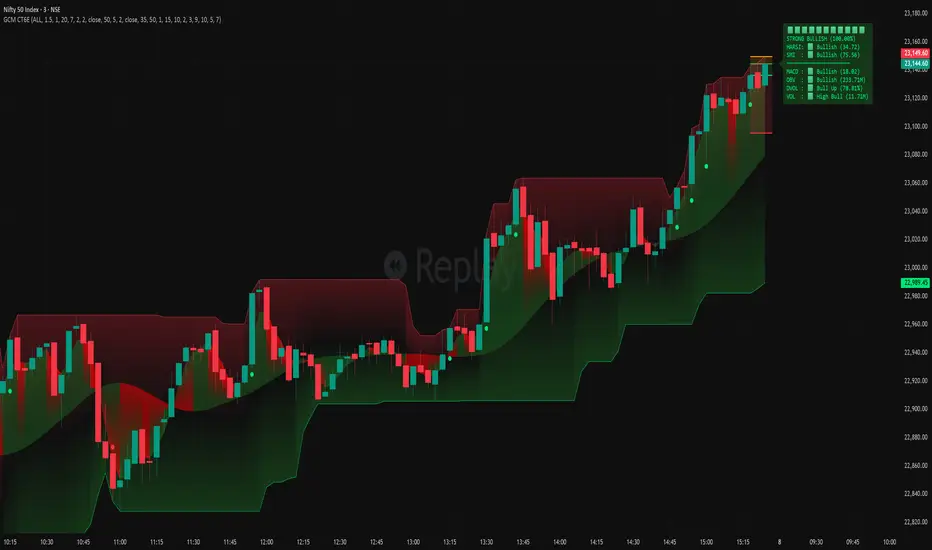
GCM Confluence Terminal: DC, JMA, HA RSI, SMI, MACD & OBV EngineDescription:
Title: GCM Confluence Terminal (CT6E) - Institutional Momentum Matrix
"Six Engines. 11 Points of Confluence. One Flawless Execution.
Decode the flow and dominate the trend with your ultimate institutional edge.
Trade the data. Ignore the drama."
-uniGram
Welcome to the GCM Confluence Terminal 6 Engine (CT6E).
Designed for the clinical and disciplined trader, the CT6E is not just an indicator—it is a complete quantitative execution terminal. It strips away market noise and emotional bias by aggregating six discrete market dimensions into a single, highly optimized 11-point momentum scoring matrix.
Whether you trade Smart Money Concepts (SMC), Price Action, or Trend-Following strategies, the CT6E provides the ultimate "Institutional Edge" by calculating trend direction, macro/micro momentum, and order flow pressure simultaneously.
🔥 CORE ARCHITECTURE (The 6 Engines):
1. Trend & Volatility (JMA & DC): Advanced Jurik Moving Averages combined with Donchian Channel zones for dynamic trend identification and precise breakout/reversal mapping.
2. Base Trend (HARSI): Smoothed Heikin-Ashi RSI to filter out fake price spikes and reveal the true underlying trend.
3. Micro Momentum (SMI): Stochastic Momentum Index to track immediate speed and early exhaustion shifts.
4. Macro Momentum (MACD): Traditional momentum convergence acting as the bridge between immediate speed and structural trend.
5. Volume Flow (OBV): Cumulative On-Balance Volume tracking to confirm if smart money is stepping in to support the move.
6. Delta Pressure (DVOL): Real-time internal candle pressure (Bull Up vs. Bear Dn) to read the exact fight between buyers and sellers within the current timeframe.
🎯 THE 11-POINT ALPHA HUD (Heads-Up Display):
The CT6E features a revolutionary "Glass HUD" that translates complex, multi-timeframe calculations into a simple 0 to 11 scoring system.
• It visually organizes data from Macro to Micro (Trend ➔ Momentum ➔ Volume ➔ Pressure).
• Automatically shifts to neutral status (Low Vol / ⬜) during choppy or dead zones to keep you out of low-probability trades.
• Dynamically adapts its UI theme (Green/Red/Gray) based on the absolute HARSI status.
🛡️ POSITION SUIT PROTOCOL:
Stop guessing your risk parameters. Upon a valid signal crossover, the CT6E automatically deploys a visual "Position Suit"—a projected ribbon on your chart detailing live entry, ATR-based dynamic Stop Loss, and extreme price tracking, allowing for flawless visual trade management.
HOW TO USE:
• Confluence is Key: Wait for the HUD to confirm "STRONG BULLISH" or "STRONG BEARISH" (Scores 10 or 11/11).
• Confirm with Volume: Ensure VOL is registering "High Bull/Bear" and DVOL confirms the exact directional pressure before executing.
• Trade Management: Use the Position Suit ribbons to trail your stops dynamically as the trend expands.
⚠️ Disclaimer & Risk Warning:
The GCM Confluence Terminal (CT6E) is an analytical tool provided for educational and informational purposes only. It does not constitute financial or investment advice. Trading in financial markets (crypto, forex, stocks, options) involves a high degree of risk and may not be suitable for all investors. Past performance of any indicator or trading system is not indicative of future results. Always conduct your own due diligence, rigorously backtest any strategy, and employ strict risk management. The author assumes no responsibility or liability for any financial losses incurred while using this script.
________________________________________
Kannada Version (ಕನ್ನಡ ಅನುವಾದ)
ಶೀರ್ಷಿಕೆ: GCM Confluence Terminal (CT6E) - Institutional Momentum Matrix
"6 ಎಂಜಿನ್ಗಳು. 11 ಪಾಯಿಂಟ್ಗಳ ಕನ್ಫರ್ಮೇಷನ್. ಒಂದೇ ಒಂದು ಪರ್ಫೆಕ್ಟ್ ಎಕ್ಸಿಕ್ಯೂಷನ್.
ಮಾರ್ಕೆಟ್ ಫ್ಲೋ ಅನ್ನು ಡಿಕೋಡ್ ಮಾಡಿ ಮತ್ತು ನಿಮ್ಮ ಅಂತಿಮ ಇನ್ಸ್ಟಿಟ್ಯೂಷನಲ್ ಅಸ್ತ್ರದ ಮೂಲಕ ಟ್ರೆಂಡ್ ಅನ್ನು ಆಳಿ.
ಡೇಟಾವನ್ನು ಟ್ರೇಡ್ ಮಾಡಿ. ಡ್ರಾಮಾವನ್ನು ನಿರ್ಲಕ್ಷಿಸಿ."
-uniGram
GCM Confluence Terminal 6 Engine (CT6E) ಗೆ ಸ್ವಾಗತ.
ಶಿಸ್ತುಬದ್ಧ ಮತ್ತು ವೃತ್ತಿಪರ ಟ್ರೇಡರ್ಗಳಿಗಾಗಿ ವಿನ್ಯಾಸಗೊಳಿಸಲಾದ CT6E ಕೇವಲ ಒಂದು 'ಇಂಡಿಕೇಟರ್' ಅಲ್ಲ—ಇದೊಂದು ಸಂಪೂರ್ಣ ಕ್ವಾಂಟಿಟೇಟಿವ್ ಎಕ್ಸಿಕ್ಯೂಷನ್ ಟರ್ಮಿನಲ್ (Quantitative execution terminal). ಇದು ಮಾರ್ಕೆಟ್ನ ಗೊಂದಲಗಳನ್ನು (noise) ಮತ್ತು ಎಮೋಷನಲ್ ನಿರ್ಧಾರಗಳನ್ನು ಬದಿಗೊತ್ತಿ, ಮಾರ್ಕೆಟ್ನ 6 ವಿಭಿನ್ನ ಆಯಾಮಗಳನ್ನು ಒಟ್ಟುಗೂಡಿಸಿ, ಅತ್ಯಂತ ನಿಖರವಾದ '11-ಪಾಯಿಂಟ್ ಮೊಮೆಂಟಮ್ ಸ್ಕೋರಿಂಗ್ ಮ್ಯಾಟ್ರಿಕ್ಸ್' ಆಗಿ ಪರಿವರ್ತಿಸುತ್ತದೆ.
ನೀವು Smart Money Concepts (SMC), Price Action, ಅಥವಾ Trend-Following ತಂತ್ರಗಳನ್ನು ಬಳಸುವವರಾಗಿದ್ದರೂ, CT6E ನಿಮಗೆ ಅಂತಿಮವಾದ "ಇನ್ಸ್ಟಿಟ್ಯೂಷನಲ್ ಎಡ್ಜ್" (Institutional Edge) ಒದಗಿಸುತ್ತದೆ. ಇದು ಟ್ರೆಂಡ್ನ ದಿಕ್ಕು, ಮ್ಯಾಕ್ರೋ/ಮೈಕ್ರೋ ಮೊಮೆಂಟಮ್, ಮತ್ತು ಆರ್ಡರ್ ಫ್ಲೋ ಪ್ರೆಶರ್ ಅನ್ನು ಏಕಕಾಲದಲ್ಲಿ ಲೆಕ್ಕಾಚಾರ ಮಾಡುತ್ತದೆ.
🔥 ಕೋರ್ ಆರ್ಕಿಟೆಕ್ಚರ್ (6 ಪ್ರಬಲ ಎಂಜಿನ್ಗಳು):
1. Trend & Volatility (JMA & DC): ಅಡ್ವಾನ್ಸ್ಡ್ ಜುರಿಕ್ ಮೂವಿಂಗ್ ಆವರೇಜ್ (JMA) ಮತ್ತು ಡೊಂಚಿಯನ್ ಚಾನೆಲ್ (DC) ಗಳ ಸಂಯೋಜನೆ. ಇದು ಡೈನಾಮಿಕ್ ಟ್ರೆಂಡ್ ಅನ್ನು ಗುರುತಿಸಲು ಮತ್ತು ನಿಖರವಾದ ಬ್ರೇಕ್ಔಟ್/ರಿವರ್ಸಲ್ ಅನ್ನು ಮ್ಯಾಪ್ ಮಾಡಲು ಸಹಾಯ ಮಾಡುತ್ತದೆ.
2. Base Trend (HARSI): ನಕಲಿ ಪ್ರೈಸ್ ಸ್ಪೈಕ್ಗಳನ್ನು (fake spikes) ಫಿಲ್ಟರ್ ಮಾಡಿ, ಅಸಲಿ ಟ್ರೆಂಡ್ ಅನ್ನು ಬಹಿರಂಗಪಡಿಸುವ ಸ್ಮೂತ್ಡ್ ಹೈಕಿನ್-ಆಶಿ ಆರ್ಎಸ್ಐ (Smoothed Heikin-Ashi RSI).
3. Micro Momentum (SMI): ಪ್ರಸ್ತುತ ವೇಗ (immediate speed) ಮತ್ತು ಟ್ರೆಂಡ್ನ ಆರಂಭಿಕ ಆಯಾಸವನ್ನು (early exhaustion) ಟ್ರ್ಯಾಕ್ ಮಾಡುವ ಸ್ಟೊಕಾಸ್ಟಿಕ್ ಮೊಮೆಂಟಮ್ ಇಂಡೆಕ್ಸ್.
4. Macro Momentum (MACD): ತಕ್ಷಣದ ವೇಗ ಮತ್ತು ಮೂಲ ಟ್ರೆಂಡ್ನ ನಡುವೆ ಸೇತುವೆಯಾಗಿ (bridge) ಕಾರ್ಯನಿರ್ವಹಿಸುವ ಸಾಂಪ್ರದಾಯಿಕ ಮೊಮೆಂಟಮ್ ಕನ್ವರ್ಜೆನ್ಸ್.
5. Volume Flow (OBV): ಈ ಟ್ರೆಂಡ್ಗೆ 'ಸ್ಮಾರ್ಟ್ ಮನಿ' (Smart money) ಬೆಂಬಲ ನೀಡುತ್ತಿದೆಯೇ ಎಂದು ಖಚಿತಪಡಿಸುವ ಕ್ಯುಮುಲೇಟಿವ್ ಆನ್-ಬ್ಯಾಲೆನ್ಸ್ ವಾಲ್ಯೂಮ್ (OBV).
6. Delta Pressure (DVOL): ನಿರ್ದಿಷ್ಟ ಟೈಮ್ಫ್ರೇಮ್ನ ಕ್ಯಾಂಡಲ್ ಒಳಗೆ ಬೈಯರ್ಸ್ ಮತ್ತು ಸೆಲ್ಲರ್ಸ್ ನಡುವಿನ ನೈಜ ಯುದ್ಧವನ್ನು (Bull Up vs. Bear Dn) ಓದುವ ರಿಯಲ್-ಟೈಮ್ ಡೆಲ್ಟಾ ಪ್ರೆಶರ್.
🎯 11-ಪಾಯಿಂಟ್ ಆಲ್ಫಾ HUD (Heads-Up Display):
CT6E ಒಂದು ಕ್ರಾಂತಿಕಾರಿ "ಗ್ಲಾಸ್ HUD" (Glass HUD) ಅನ್ನು ಹೊಂದಿದೆ. ಇದು ಸಂಕೀರ್ಣವಾದ ಮಲ್ಟಿ-ಟೈಮ್ಫ್ರೇಮ್ ಲೆಕ್ಕಾಚಾರಗಳನ್ನು ಸರಳವಾದ 0 ರಿಂದ 11 ಸ್ಕೋರಿಂಗ್ ಸಿಸ್ಟಮ್ ಆಗಿ ಅನುವಾದಿಸುತ್ತದೆ.
• ಇದು ಡೇಟಾವನ್ನು ಮ್ಯಾಕ್ರೋ-ನಿಂದ ಮೈಕ್ರೋ-ಗೆ (ಟ್ರೆಂಡ್ ➔ ಮೊಮೆಂಟಮ್ ➔ ವಾಲ್ಯೂಮ್ ➔ ಪ್ರೆಶರ್) ದೃಷ್ಟಿಗೋಚರವಾಗಿ (visually) ಆಯೋಜಿಸುತ್ತದೆ.
• ಮಾರ್ಕೆಟ್ ಚಾಪಿ (Choppy) ಅಥವಾ ಡೆಡ್ (Dead) ಝೋನ್ನಲ್ಲಿದ್ದಾಗ ನ್ಯೂಟ್ರಲ್ ಸ್ಟೇಟಸ್ಗೆ (Low Vol / ⬜) ಆಟೋಮ್ಯಾಟಿಕ್ ಆಗಿ ಶಿಫ್ಟ್ ಆಗುವ ಮೂಲಕ ನಿಮ್ಮನ್ನು ಫೇಕ್ ಟ್ರೇಡ್ಗಳಿಂದ ಕಾಪಾಡುತ್ತದೆ.
• HARSI ಸ್ಟೇಟಸ್ ಆಧಾರದ ಮೇಲೆ ತನ್ನ UI ಥೀಮ್ ಅನ್ನು (Green/Red/Gray) ಡೈನಾಮಿಕ್ ಆಗಿ ಬದಲಾಯಿಸಿಕೊಳ್ಳುತ್ತದೆ.
🛡️ ಪೊಸಿಷನ್ ಸೂಟ್ ಪ್ರೋಟೋಕಾಲ್ (Position Suit Protocol):
ನಿಮ್ಮ ರಿಸ್ಕ್ ಲೆಕ್ಕಾಚಾರಗಳಲ್ಲಿ ಇನ್ನು ಕನ್ಫ್ಯೂಷನ್ ಬೇಡ. ವ್ಯಾಲಿಡ್ ಸಿಗ್ನಲ್ ಬಂದ ತಕ್ಷಣ, CT6E ನಿಮ್ಮ ಚಾರ್ಟ್ ಮೇಲೆ ಆಟೋಮ್ಯಾಟಿಕ್ ಆಗಿ ಒಂದು "ಪೊಸಿಷನ್ ಸೂಟ್" (Position Suit) ಅನ್ನು ಪ್ರದರ್ಶಿಸುತ್ತದೆ. ಇದು ಲೈವ್ ಎಂಟ್ರಿ, ATR-ಆಧಾರಿತ ಡೈನಾಮಿಕ್ ಸ್ಟಾಪ್ ಲಾಸ್, ಮತ್ತು ಎಕ್ಸ್ಟ್ರೀಮ್ ಪ್ರೈಸ್ ಟ್ರ್ಯಾಕಿಂಗ್ ಅನ್ನು ಒಳಗೊಂಡಿದ್ದು, ನಿಮ್ಮ ಟ್ರೇಡ್ ಮ್ಯಾನೇಜ್ಮೆಂಟ್ ಅನ್ನು ದೋಷರಹಿತವಾಗಿಸುತ್ತದೆ.
ಹೇಗೆ ಬಳಸುವುದು:
• Confluence is Key: HUD ಸ್ಕೋರ್ "STRONG BULLISH" ಅಥವಾ "STRONG BEARISH" (10 ಅಥವಾ 11/11 ಸ್ಕೋರ್) ಎಂದು ಕನ್ಫರ್ಮ್ ಮಾಡುವವರೆಗೆ ಕಾಯಿರಿ.
• Confirm with Volume: ಟ್ರೇಡ್ ಎಕ್ಸಿಕ್ಯೂಟ್ ಮಾಡುವ ಮೊದಲು VOL "High Bull/Bear" ನಲ್ಲಿದೆಯೇ ಮತ್ತು DVOL ನಿಖರವಾದ ಡೈರೆಕ್ಷನಲ್ ಪ್ರೆಶರ್ ಅನ್ನು ಬೆಂಬಲಿಸುತ್ತಿದೆಯೇ ಎಂದು ಖಚಿತಪಡಿಸಿಕೊಳ್ಳಿ.
• Trade Management: ಟ್ರೆಂಡ್ ವಿಸ್ತರಿಸಿದಂತೆ (trend expands) ನಿಮ್ಮ ಸ್ಟಾಪ್ ಲಾಸ್ ಅನ್ನು ಡೈನಾಮಿಕ್ ಆಗಿ ಟ್ರೈಲ್ (trail) ಮಾಡಲು ಪೊಸಿಷನ್ ಸೂಟ್ ರಿಬ್ಬನ್ಗಳನ್ನು ಬಳಸಿ.
⚠️ ಹಕ್ಕುತ್ಯಾಗ ಮತ್ತು ಅಪಾಯದ ಎಚ್ಚರಿಕೆ (Disclaimer & Risk Warning):
GCM Confluence Terminal (CT6E) ಕೇವಲ ಶೈಕ್ಷಣಿಕ ಮತ್ತು ಮಾಹಿತಿ ಉದ್ದೇಶಗಳಿಗಾಗಿ ಒದಗಿಸಲಾದ ವಿಶ್ಲೇಷಣಾತ್ಮಕ ಸಾಧನವಾಗಿದೆ. ಇದು ಆರ್ಥಿಕ ಅಥವಾ ಹೂಡಿಕೆ ಸಲಹೆಯಲ್ಲ. ಹಣಕಾಸು ಮಾರುಕಟ್ಟೆಗಳಲ್ಲಿ (ಕ್ರಿಪ್ಟೋ, ಫಾರೆಕ್ಸ್, ಸ್ಟಾಕ್ಸ್, ಆಪ್ಷನ್ಸ್) ಟ್ರೇಡಿಂಗ್ ಮಾಡುವುದು ಹೆಚ್ಚಿನ ಮಟ್ಟದ ಅಪಾಯವನ್ನು ಒಳಗೊಂಡಿರುತ್ತದೆ ಮತ್ತು ಇದು ಎಲ್ಲಾ ಹೂಡಿಕೆದಾರರಿಗೆ ಸೂಕ್ತವಲ್ಲ. ಯಾವುದೇ ಇಂಡಿಕೇಟರ್ ಅಥವಾ ಟ್ರೇಡಿಂಗ್ ಸಿಸ್ಟಮ್ನ ಹಿಂದಿನ ಕಾರ್ಯಕ್ಷಮತೆಯು ಭವಿಷ್ಯದ ಫಲಿತಾಂಶಗಳ ಸೂಚಕವಲ್ಲ. ಯಾವಾಗಲೂ ನಿಮ್ಮದೇ ಆದ ರಿಸರ್ಚ್ (due diligence) ಮಾಡಿ, ಯಾವುದೇ ಸ್ಟ್ರಾಟಜಿಯನ್ನು ಕಟ್ಟುನಿಟ್ಟಾಗಿ ಬ್ಯಾಕ್ಟೆಸ್ಟ್ ಮಾಡಿ ಮತ್ತು ಕಟ್ಟುನಿಟ್ಟಾದ ರಿಸ್ಕ್ ಮ್ಯಾನೇಜ್ಮೆಂಟ್ ಅನ್ನು ಅನುಸರಿಸಿ. ಈ ಸ್ಕ್ರಿಪ್ಟ್ ಅನ್ನು ಬಳಸುವಾಗ ಉಂಟಾಗುವ ಯಾವುದೇ ಆರ್ಥಿಕ ನಷ್ಟಗಳಿಗೆ ಲೇಖಕರು ಯಾವುದೇ ಜವಾಬ್ದಾರಿ ಅಥವಾ ಹೊಣೆಗಾರಿಕೆಯನ್ನು ವಹಿಸುವುದಿಲ್ಲ.
________________________________________
🖼️ SYSTEM SHOWCASE:
DECODING THE MATRIX From aggressive trends to choppy noise, see how the 11-point HUD guides you through real market executions.
(ಸಿಸ್ಟಮ್ ಶೋಕೇಸ್: ಲೈವ್ ಮಾರ್ಕೆಟ್ ಎಕ್ಸಿಕ್ಯೂಷನ್ ಸ್ಟ್ರಾಂಗ್ ಟ್ರೆಂಡ್ನಿಂದ ಹಿಡಿದು ಚಾಪಿ (Choppy) ಮಾರ್ಕೆಟ್ವರೆಗೆ, 11-ಪಾಯಿಂಟ್ HUD ನಿಮ್ಮನ್ನು ಹೇಗೆ ಗೈಡ್ ಮಾಡುತ್ತದೆ ಎಂದು ಕಣ್ಣಾರೆ ನೋಡಿ)
Image - 1:
The 11-Point Alpha HUD: Your real-time institutional dashboard. It instantly decodes 6 complex market dimensions—Trend, Momentum, Volume, and Pressure—into one clear, actionable score.
11-ಪಾಯಿಂಟ್ ಆಲ್ಫಾ HUD: ಇದು ನಿಮ್ಮ ರಿಯಲ್-ಟೈಮ್ ಇನ್ಸ್ಟಿಟ್ಯೂಷನಲ್ ಡ್ಯಾಶ್ಬೋರ್ಡ್. ಮಾರ್ಕೆಟ್ನ 6 ಆಯಾಮಗಳನ್ನು (ಟ್ರೆಂಡ್, ಮೊಮೆಂಟಮ್, ವಾಲ್ಯೂಮ್ ಮತ್ತು ಪ್ರೆಶರ್) ಒಂದೇ ಸೆಕೆಂಡಿನಲ್ಲಿ ಲೆಕ್ಕಾಚಾರ ಮಾಡಿ, ಅತ್ಯಂತ ನಿಖರವಾದ ಸ್ಕೋರ್ ನೀಡುತ್ತದೆ.
Image - 2:
Strong Bullish Expansion: Witness the CT6E capture explosive upside trends. The matrix aligns perfectly with a 10/11+ score and confirmed "High Bull" volume, validating a high-probability institutional long entry.
ಸ್ಟ್ರಾಂಗ್ ಬುಲ್ಲಿಶ್ ಮೊಮೆಂಟಮ್: CT6E ಸ್ಕ್ರಿಪ್ಟ್ ಬಲಿಷ್ಠವಾದ ಅಪ್ಟ್ರೆಂಡ್ ಅನ್ನು ನಿಖರವಾಗಿ ಸೆರೆಹಿಡಿಯುವ ಕ್ಷಣ. 10/11 + ಸ್ಕೋರ್, ಗ್ರೀನ್ ಕ್ಲೌಡ್ ಮತ್ತು "High Bull" ವಾಲ್ಯೂಮ್ ಮೂಲಕ, ಇದು ಹೈ-ಪ್ರಾಬಬಿಲಿಟಿ (High-probability) ಲಾಂಗ್ ಎಂಟ್ರಿಯನ್ನು ಕನ್ಫರ್ಮ್ ಮಾಡುತ್ತದೆ.
Image - 3:
Flawless Bearish Execution: Watch the CT6E navigate aggressive market sell-offs. A 0/11 matrix score, dominant red JMA cloud, and confirmed "High Bear" volume signal intense institutional shorting pressure.
ಸ್ಟ್ರಾಂಗ್ ಬೇರಿಶ್ ಮೊಮೆಂಟಮ್: ಮಾರ್ಕೆಟ್ ತೀವ್ರವಾಗಿ ಕುಸಿಯುತ್ತಿರುವಾಗ CT6E ಅದನ್ನು ಎಷ್ಟು ಪರ್ಫೆಕ್ಟ್ ಆಗಿ ಕ್ಯಾಚ್ ಮಾಡುತ್ತದೆ ಎಂದು ನೋಡಿ. 0/11 ಸ್ಕೋರ್, ರೆಡ್ JMA ಕ್ಲೌಡ್ ಮತ್ತು "High Bear" ವಾಲ್ಯೂಮ್, ಇನ್ಸ್ಟಿಟ್ಯೂಷನಲ್ ಸೆಲ್ಲಿಂಗ್ ಪ್ರೆಶರ್ ಅನ್ನು ಸ್ಪಷ್ಟವಾಗಿ ಕನ್ಫರ್ಮ್ ಮಾಡುತ್ತದೆ.
Image - 4:
The Noise Killer (Choppy Filter): Capital preservation is paramount. Watch the CT6E intelligently shift to a neutral state (Gray/Low Vol) during sideways action, filtering out market noise and keeping you out of low-probability fake-outs.
ಚಾಪಿ ಮಾರ್ಕೆಟ್ ಫಿಲ್ಟರ್ (The Noise Killer): ಲಾಭ ಮಾಡುವುದರಷ್ಟೇ ಬಂಡವಾಳ ರಕ್ಷಿಸಿಕೊಳ್ಳುವುದು ಕೂಡ ಮುಖ್ಯ. ಮಾರ್ಕೆಟ್ ಸೈಡ್ವೇಸ್ (Sideways) ಇದ್ದಾಗ CT6E ಆಟೋಮ್ಯಾಟಿಕ್ ಆಗಿ ನ್ಯೂಟ್ರಲ್ ಸ್ಟೇಟಸ್ಗೆ (Gray/Low Vol) ಶಿಫ್ಟ್ ಆಗಿ, ಫೇಕ್ ಸಿಗ್ನಲ್ಗಳಿಂದ ನಿಮ್ಮನ್ನು ಹೇಗೆ ಕಾಪಾಡುತ್ತದೆ ಎಂದು ನೋಡಿ.
Image - 5:
Position Suit Protocol (Live Trade Management): Eliminate guesswork from your risk management. Upon a valid signal, the CT6E instantly plots visual ribbons detailing your live entry, dynamic ATR-based Stop Loss, and extreme price tracking for flawless execution.
ಲೈವ್ ಪೊಸಿಷನ್ ಸೂಟ್ (Trade Management): ನಿಮ್ಮ ರಿಸ್ಕ್ ಮ್ಯಾನೇಜ್ಮೆಂಟ್ನಲ್ಲಿ ಇನ್ನು ಅಂದಾಜು ಬೇಡ. ಸಿಗ್ನಲ್ ಬಂದ ಕೂಡಲೇ CT6E ನಿಮ್ಮ ಲೈವ್ ಎಂಟ್ರಿ, ATR-ಆಧಾರಿತ ಡೈನಾಮಿಕ್ ಸ್ಟಾಪ್ ಲಾಸ್ ಮತ್ತು ಪ್ರೈಸ್ ಟ್ರ್ಯಾಕಿಂಗ್ ಅನ್ನು ಚಾರ್ಟ್ ಮೇಲೆ 'ರಿಬ್ಬನ್' (Ribbon) ರೂಪದಲ್ಲಿ ಸ್ಪಷ್ಟವಾಗಿ ತೋರಿಸುತ್ತದೆ.
Image - 6:
The Ultimate Confluence (GCM Ecosystem): For absolute precision, pair the CT6E with our custom GCM SMI Cloud Oscillator. This dual-confirmation setup visually validates the HUD’s data, giving you the ultimate confidence to execute high-probability trades.
Link to add ‘GCM SMI Cloud Oscillator’ indicator:
ಅಲ್ಟಿಮೇಟ್ ಕನ್ಫರ್ಮೇಷನ್ (GCM Ecosystem): ನಿಮ್ಮ ಟ್ರೇಡಿಂಗ್ ನಿಖರತೆಯನ್ನು ಮತ್ತೊಂದು ಹಂತಕ್ಕೆ ಕೊಂಡೊಯ್ಯಲು CT6E ಜೊತೆಗೆ ನಮ್ಮ GCM SMI Cloud Oscillator ಅನ್ನು ಬಳಸಿ. ಈ ಡ್ಯುಯಲ್-ಸೆಟಪ್ (Dual-setup) HUD ನ ಡೇಟಾವನ್ನು ಕ್ರಾಸ್-ಚೆಕ್ ಮಾಡಿ, ಧೈರ್ಯವಾಗಿ ಟ್ರೇಡ್ ಮಾಡಲು ನಿಮಗೆ 100% ಕಾನ್ಫಿಡೆನ್ಸ್ ನೀಡುತ್ತದೆ.
‘GCM SMI Cloud Oscillator’ ಇಂಡಿಕೇಟರ್ ಲಿಂಕ್ ಇಲ್ಲಿದೆ:
"Built for precision. Executed with discipline."
"ನಿಖರತೆಗಾಗಿ ನಿರ್ಮಿಸಲಾಗಿದೆ. ಶಿಸ್ತಿನಿಂದ ಕಾರ್ಯಗತಗೊಳಿಸಲಾಗಿದೆ."
HAPPY TRADING
© uniGram | 2026 Indicador

GCM SMILE with DC ProtocolDescription:
Title: GCM SMILE with DC Protocol
Strategic Momentum. Masterful Execution. — Powered by uniGram.
Overview
The GCM S.M.I.L.E. (Stochastic Momentum Index & Logical Executor) with DC Protocol is an institutional-grade algorithmic trading suite designed to strip emotion from the charts. By fusing double-smoothed momentum tracking with volatility-adjusted risk management and spatial price mapping, the SMILE Protocol provides quantitative traders with a deterministic framework for market entry, risk evaluation, and trade management.
Unlike standard retail indicators that lag or provide isolated data points, this suite operates as a complete, real-time confluence engine. It maps market structure, identifies hidden exhaustion, and projects immediate risk parameters directly onto the price action without cluttering the visual field.
Core Architecture & Visual Engine
1. The SMI Engine (Stochastic Momentum Index)
At the heart of the system is a double-smoothed momentum oscillator designed to eradicate standard market noise.
Precision Entries: The engine isolates true directional thrusts, plotting high-contrast, pinpoint signal dots (Size: Tiny) directly on the execution candle only when critical crossovers occur.
Clean Visuals: Stripped of all unnecessary ribbons and conflicting slopes, it leaves only the purest buy/sell momentum triggers on the chart.
2. The DC Protocol (Spatial Pricing & Liquidity Zones)
Price is rarely random; it moves between Premium and Discount zones. The DC (Donchian Channel) Protocol maps these institutional boundaries in real-time using native dashed bands.
Dynamic Gradient Shading: Utilizing a mathematically locked 40%-to-100% gradient matrix, the protocol visually identifies the Premium Zone (Forest Green) for highly probable distribution areas and the Discount Zone (Deep Red) for optimal accumulation areas.
Slope-Reactive Midline: The equilibrium solid midline dynamically shifts color (Lime/Red/Gray) to indicate shifting structural balance, giving traders an immediate bias read.
3. Algorithmic Divergence Scanner
The system actively hunts for hidden institutional footprints by measuring price action against underlying momentum.
Automated Detection: It continuously scans user-defined pivot lookback windows (default 5 bars) for Regular Bullish and Bearish Divergence
Pro-Level Visual Alerts: When momentum fails to confirm a new price extreme, the protocol draws a clean dashed structural line connecting the pivots. It then plots a high-opacity (100%), soft-dark label with crisp white text to warn the trader of impending trend exhaustion without burning the retinas.
4. The Logical Executor (Volatility-Adjusted Risk)
Amateur traders use static stop losses; professionals use volatility. The Logical Executor manages the trade parameters the second a signal fires.
ATR-Driven Ribbons: Upon a signal trigger, the executor instantly calculates a customized Stop Loss based on current Average True Range (default 1.5x) and locks it in.
Future Projection: To prevent the gradient clouds from muddying your live trade data, the risk ribbons (Entry, Stop Loss, and Live Tracking lines) are projected 3 bars into the future, separating risk management visuals from the core price action.
5. Quantitative H.U.D. (Heads-Up Display)
A comprehensive, real-time data terminal overlays the chart, providing immediate quantitative feedback:
Live SMI values and contextual momentum summaries ("STRONG BULL", "BEARISH", etc.).
Volume validation dynamically checked against a 20-period SMA.
DC Zone identification (Premium vs. Discount).
Active Divergence tracking (holds state for 10 bars so you never miss a flash signal).
Live Trade Metrics: Real-time tracking of open risk (LIC), open profit (POC), equity erosion (LIP), and live Risk-to-Reward (R:R) ratios.
6. Institutional Alert Routing
Fully equipped for algorithmic deployment, the protocol contains built-in webhook-ready alerts for:
Long Crossovers & Short Crossunders.
Bullish & Bearish Divergence Detections.
The Execution Playbook
🟢 Protocol A: The Discount Strike (Long Entry)
Spatial Alignment: Price must be trading in or interacting with the Discount Zone (Red Gradient / Lower DC Band).
Momentum Trigger: Wait for a confirmed Bullish SMI Crossover (Lime Green Dot below the candle).
Volume Confirmation: Check the HUD. Volume should display 🟢.
Logical Execution: Enter Long on the close. Stop Loss is mapped by the Red ATR dashed line (LIC).
Target Matrix: Target the DC Midline for Partial TP1, and the DC Upper Band for final targets.
🔴 Protocol B: The Premium Strike (Short Entry)
Spatial Alignment: Price must be trading in or interacting with the Premium Zone (Green Gradient / Upper DC Band).
Momentum Trigger: Wait for a confirmed Bearish SMI Crossunder (Red Dot above the candle).
Volume Confirmation: Check the HUD. Volume should display 🔴.
Logical Execution: Enter Short on the close. Stop Loss is mapped by the Green ATR dashed line (LIC).
Target Matrix: Target the DC Midline for Partial TP1, and the DC Lower Band for final targets.
⚠️ Protocol C: The Exhaustion Reversal (Divergences)
When the Divergence Engine triggers a soft-colored, 100% opaque Bull Div or Bear Div label, structural exhaustion is imminent. Do not enter blindly. Use the label as advanced warning to aggressively trail stops, or wait for the very next SMI Signal Dot in the direction of the divergence to execute a high-probability reversal.
⚖️ Risk Disclaimer
For Educational and Analytical Purposes Only.
The GCM SMILE with DC Protocol is a quantitative trading tool designed to visualize mathematical formulas and historical data. It does not constitute financial advice, investment recommendations, or a solicitation to buy or sell any asset. Trading involves a substantial risk of loss and is not suitable for all investors. By using this suite, you acknowledge that you are entirely responsible for your own execution and risk management. Always trade with capital you can afford to lose.
Strategic Momentum. Masterful Execution. — Powered by uniGram.
HAPPY TRADING
________________________________________
Description in Kannada Language (ಕನ್ನಡ ವಿವರಣೆ)
Title: GCM SMILE with DC Protocol
Strategic Momentum. Masterful Execution. — Powered by uniGram.
ಅವಲೋಕನ (Overview)
GCM S.M.I.L.E. (Stochastic Momentum Index & Logical Executor) with DC Protocol ಎಂಬುದು ಚಾರ್ಟ್ಗಳಿಂದ ಭಾವನೆಗಳನ್ನು (emotions) ಹೊರಹಾಕಲು ವಿನ್ಯಾಸಗೊಳಿಸಲಾದ ಒಂದು ಇನ್ಸ್ಟಿಟ್ಯೂಷನಲ್-ಗ್ರೇಡ್ ಅಲ್ಗಾರಿದಮಿಕ್ ಟ್ರೇಡಿಂಗ್ ಸೂಟ್ ಆಗಿದೆ. ಮೊಮೆಂಟಮ್ ಟ್ರ್ಯಾಕಿಂಗ್, ವೊಲಟಾಲಿಟಿ-ಅಡ್ಜಸ್ಟೆಡ್ ರಿಸ್ಕ್ ಮ್ಯಾನೇಜ್ಮೆಂಟ್ ಮತ್ತು ಪ್ರೈಸ್ ಮ್ಯಾಪಿಂಗ್ ಅನ್ನು ಸಂಯೋಜಿಸುವ ಮೂಲಕ, ಈ ಪ್ರೋಟೋಕಾಲ್ ಟ್ರೇಡರ್ಗಳಿಗೆ ಎಂಟ್ರಿ, ರಿಸ್ಕ್ ಮತ್ತು ಟ್ರೇಡ್ ಮ್ಯಾನೇಜ್ಮೆಂಟ್ಗಾಗಿ ಒಂದು ನಿಖರವಾದ ಚೌಕಟ್ಟನ್ನು ಒದಗಿಸುತ್ತದೆ.
ಇದು ಕೇವಲ ಡೇಟಾವನ್ನು ತೋರಿಸುವ ಸಾಮಾನ್ಯ ಇಂಡಿಕೇಟರ್ ಅಲ್ಲ; ಇದು ರಿಯಲ್-ಟೈಮ್ ಕಾನ್ಫ್ಲುಯೆನ್ಸ್ ಇಂಜಿನ್ ಆಗಿ ಕಾರ್ಯನಿರ್ವಹಿಸುತ್ತದೆ. ಇದು ಮಾರುಕಟ್ಟೆಯ ರಚನೆಯನ್ನು ಮ್ಯಾಪ್ ಮಾಡುತ್ತದೆ ಮತ್ತು ಸಂಭಾವ್ಯ ರಿವರ್ಸಲ್ಗಳನ್ನು ಗುರುತಿಸುತ್ತದೆ.
ಪ್ರಮುಖ ವಿನ್ಯಾಸ ಮತ್ತು ವಿಶುವಲ್ ಇಂಜಿನ್
1. SMI ಇಂಜಿನ್ (Stochastic Momentum Index)
ಮಾರುಕಟ್ಟೆಯ ಅನಗತ್ಯ ಶಬ್ದವನ್ನು (noise) ತೆಗೆದುಹಾಕಲು ಇದನ್ನು ವಿನ್ಯಾಸಗೊಳಿಸಲಾಗಿದೆ.
ನಿಖರವಾದ ಎಂಟ್ರಿ (Precision Entries): ಕ್ರಿಟಿಕಲ್ ಕ್ರಾಸ್ಓವರ್ಗಳು ಸಂಭವಿಸಿದಾಗ ಮಾತ್ರ ಎಕ್ಸಿಕ್ಯೂಶನ್ ಕ್ಯಾಂಡಲ್ ಮೇಲೆ ಸಣ್ಣ ಸಿಗ್ನಲ್ ಡಾಟ್ಗಳನ್ನು (Size: Tiny) ಇದು ಪ್ರದರ್ಶಿಸುತ್ತದೆ.
ಕ್ಲೀನ್ ವಿಶುವಲ್ಸ್: ಚಾರ್ಟ್ನಲ್ಲಿ ಯಾವುದೇ ಗೊಂದಲವಿಲ್ಲದೆ ಕೇವಲ ಶುದ್ಧವಾದ ಬೈ/ಸೆಲ್ ಮೊಮೆಂಟಮ್ ಟ್ರಿಗ್ಗರ್ಗಳನ್ನು ಮಾತ್ರ ಇದು ತೋರಿಸುತ್ತದೆ.
2. DC ಪ್ರೋಟೋಕಾಲ್ (Spatial Pricing & Liquidity Zones)
ಬೆಲೆಯು ಯಾವಾಗಲೂ ಪ್ರೀಮಿಯಂ ಮತ್ತು ಡಿಸ್ಕೌಂಟ್ ವಲಯಗಳ ನಡುವೆ ಚಲಿಸುತ್ತದೆ. ಇದನ್ನು ಡೊಂಚಿಯನ್ ಚಾನಲ್ (DC) ಪ್ರೋಟೋಕಾಲ್ ರಿಯಲ್-ಟೈಮ್ನಲ್ಲಿ ಗುರುತಿಸುತ್ತದೆ.
ಡೈನಾಮಿಕ್ ಗ್ರೇಡಿಯಂಟ್ ಶೇಡಿಂಗ್: 40% ರಿಂದ 100% ಗ್ರೇಡಿಯಂಟ್ ಮ್ಯಾಟ್ರಿಕ್ಸ್ ಬಳಸಿ, ಇದು ಪ್ರೀಮಿಯಂ ಜೋನ್ (ಗಾಢ ಹಸಿರು - ಮಾರಾಟಕ್ಕಾಗಿ) ಮತ್ತು ಡಿಸ್ಕೌಂಟ್ ಜೋನ್ (ಗಾಢ ಕೆಂಪು - ಖರೀದಿಗಾಗಿ) ಅನ್ನು ಗುರುತಿಸುತ್ತದೆ.
ಸ್ಲೋಪ್-ರಿಯಾಕ್ಟಿವ್ ಮಿಡ್ಲೈನ್: ಮಧ್ಯದ ರೇಖೆಯು ಮಾರುಕಟ್ಟೆಯ ದಿಕ್ಕಿಗೆ ಅನುಗುಣವಾಗಿ ಬಣ್ಣವನ್ನು (Lime/Red/Gray) ಬದಲಾಯಿಸುತ್ತದೆ.
3. ಅಲ್ಗಾರಿದಮಿಕ್ ಡೈವರ್ಜೆನ್ಸ್ ಸ್ಕ್ಯಾನರ್
ಬೆಲೆ ಮತ್ತು ಮೊಮೆಂಟಮ್ ನಡುವಿನ ವ್ಯತ್ಯಾಸವನ್ನು (Divergence) ಇದು ಪತ್ತೆಹಚ್ಚುತ್ತದೆ.
ಸ್ವಯಂಚಾಲಿತ ಪತ್ತೆ: ಇದು ರೆಗ್ಯುಲರ್ ಬುಲಿಶ್ ಮತ್ತು ಬೇರಿಶ್ ಡೈವರ್ಜೆನ್ಸ್ಗಳನ್ನು ನಿರಂತರವಾಗಿ ಸ್ಕ್ಯಾನ್ ಮಾಡುತ್ತದೆ.
ವಿಶುವಲ್ ಅಲರ್ಟ್ಗಳು: ಡೈವರ್ಜೆನ್ಸ್ ಪತ್ತೆಯಾದಾಗ ಚಾರ್ಟ್ ಮೇಲೆ 'Dashed' ಲೈನ್ ಮತ್ತು 100% ಅಪಾರದರ್ಶಕ (Opaque) ಲೇಬಲ್ಗಳನ್ನು ತೋರಿಸುತ್ತದೆ.
4. ಲಾಜಿಕಲ್ ಎಕ್ಸಿಕ್ಯೂಟರ್ (Logical Executor)
ಇದು ವೊಲಟಾಲಿಟಿಗೆ ಅನುಗುಣವಾಗಿ ರಿಸ್ಕ್ ಅನ್ನು ನಿರ್ವಹಿಸುತ್ತದೆ.
ATR-ಚಾಲಿತ ರಿಬ್ಬನ್ಗಳು: ಸಿಗ್ನಲ್ ಬಂದ ತಕ್ಷಣ, ಇದು ATR ಆಧಾರಿತ ಸ್ಟಾಪ್ ಲಾಸ್ ಅನ್ನು ಲೆಕ್ಕಾಚಾರ ಮಾಡುತ್ತದೆ.
ಫ್ಯೂಚರ್ ಪ್ರೊಜೆಕ್ಷನ್: ಚಾರ್ಟ್ ಕ್ಲೀನ್ ಆಗಿರಲು, ಈ ರಿಸ್ಕ್ ರಿಬ್ಬನ್ಗಳನ್ನು ಪ್ರಸ್ತುತ ಕ್ಯಾಂಡಲ್ಗಿಂತ 3 ಬಾರ್ಗಳಷ್ಟು ಮುಂದೆ ಪ್ರದರ್ಶಿಸಲಾಗುತ್ತದೆ.
5. ಕ್ವಾಂಟಿಟೇಟಿವ್ H.U.D. (Heads-Up Display)
ಚಾರ್ಟ್ ಮೇಲೆ ಡೇಟಾ ಟರ್ಮಿನಲ್ ಆಗಿ ಕಾರ್ಯನಿರ್ವಹಿಸುತ್ತದೆ:
ಲೈವ್ SMI ಮೌಲ್ಯಗಳು ಮತ್ತು ಮೊಮೆಂಟಮ್ ಸಾರಾಂಶ ("STRONG BULL", "BEARISH", ಇತ್ಯಾದಿ).
ವಾಲ್ಯೂಮ್ ವ್ಯಾಲಿಡೇಶನ್.
ಡೈವರ್ಜೆನ್ಸ್ ಟ್ರ್ಯಾಕಿಂಗ್.
ಲೈವ್ ಟ್ರೇಡ್ ಮೆಟ್ರಿಕ್ಸ್: ರಿಯಲ್-ಟೈಮ್ ರಿಸ್ಕ್ (LIC), ಪ್ರಾಫಿಟ್ (POC), ಮತ್ತು ರಿಸ್ಕ್-ಟು-ರಿವಾರ್ಡ್ (R:R) ಅನುಪಾತಗಳು.
ಎಕ್ಸಿಕ್ಯೂಶನ್ ಪ್ಲೇಬುಕ್ (ಹೇಗೆ ಟ್ರೇಡ್ ಮಾಡಬೇಕು)
🟢 ಪ್ರೋಟೋಕಾಲ್ A: ಡಿಸ್ಕೌಂಟ್ ಸ್ಟ್ರೈಕ್ (Long Entry)
ಬೆಲೆಯು ಡಿಸ್ಕೌಂಟ್ ಜೋನ್ (ಕೆಂಪು ಗ್ರೇಡಿಯಂಟ್) ನಲ್ಲಿರಬೇಕು.
ಬುಲಿಶ್ SMI ಕ್ರಾಸ್ಓವರ್ ಸಂಭವಿಸಬೇಕು (ಕ್ಯಾಂಡಲ್ ಕೆಳಗೆ ಹಸಿರು ಡಾಟ್).
HUD ನಲ್ಲಿ ವಾಲ್ಯೂಮ್ 🟢 ಆಗಿರಬೇಕು.
4. ಲಾಜಿಕಲ್ ಎಕ್ಸಿಕ್ಯೂಟರ್ ಸೂಚಿಸುವ ಕೆಂಪು ATR ಲೈನ್ (LIC) ಅನ್ನು ಸ್ಟಾಪ್ ಲಾಸ್ ಆಗಿ ಬಳಸಿ ಎಂಟ್ರಿ ಪಡೆಯಿರಿ.
🔴 ಪ್ರೋಟೋಕಾಲ್ B: ಪ್ರೀಮಿಯಂ ಸ್ಟ್ರೈಕ್ (Short Entry)
ಬೆಲೆಯು ಪ್ರೀಮಿಯಂ ಜೋನ್ (ಹಸಿರು ಗ್ರೇಡಿಯಂಟ್) ನಲ್ಲಿರಬೇಕು.
ಬೇರಿಶ್ SMI ಕ್ರಾಸ್ಓವರ್ ಸಂಭವಿಸಬೇಕು (ಕ್ಯಾಂಡಲ್ ಮೇಲೆ ಕೆಂಪು ಡಾಟ್).
HUD ನಲ್ಲಿ ವಾಲ್ಯೂಮ್ 🔴 ಆಗಿರಬೇಕು.
ಲಾಜಿಕಲ್ ಎಕ್ಸಿಕ್ಯೂಟರ್ ಸೂಚಿಸುವ ಹಸಿರು ATR ಲೈನ್ (LIC) ಅನ್ನು ಸ್ಟಾಪ್ ಲಾಸ್ ಆಗಿ ಬಳಸಿ ಎಂಟ್ರಿ ಪಡೆಯಿರಿ.
⚖️ ಹಕ್ಕುತ್ಯಾಗ (Risk Disclaimer)
ಶೈಕ್ಷಣಿಕ ಉದ್ದೇಶಗಳಿಗಾಗಿ ಮಾತ್ರ.
GCM SMILE with DC Protocol ಎಂಬುದು ಗಣಿತದ ಸೂತ್ರಗಳನ್ನು ಆಧರಿಸಿದ ಒಂದು ಸಾಧನವಾಗಿದೆ. ಇದು ಯಾವುದೇ ಹೂಡಿಕೆ ಸಲಹೆಯಲ್ಲ. ಹಣಕಾಸು ಮಾರುಕಟ್ಟೆಯಲ್ಲಿನ ವ್ಯಾಪಾರವು ಹೆಚ್ಚಿನ ಅಪಾಯವನ್ನು ಹೊಂದಿರುತ್ತದೆ. ನೀವು ಮಾಡುವ ಯಾವುದೇ ಲಾಭ ಅಥವಾ ನಷ್ಟಕ್ಕೆ ನೀವೇ ಜವಾಬ್ದಾರರಾಗಿರುತ್ತೀರಿ. ಕಳೆದುಕೊಳ್ಳಲು ಸಿದ್ಧವಿರುವ ಹಣವನ್ನು ಮಾತ್ರ ಹೂಡಿಕೆ ಮಾಡಿ.
Strategic Momentum. Masterful Execution. — Powered by uniGram.
HAPPY TRADING
Indicador

Indicador

Probabilistic Breakout Forecaster [LuxAlgo]The Probabilistic Breakout Forecaster indicator calculates the statistical probability of price breaking out of a defined range within a specific future time horizon. Using a log-normal random walk model, it provides traders with a quantitative estimate of whether current price action is likely to exceed local highs or lows.
🔶 USAGE
The indicator is displayed in a separate pane, showing two oscillating probability lines: a bullish breakout probability (positive values) and a bearish breakout probability (negative values).
When the bullish probability line approaches or exceeds the 50% threshold, it indicates a higher statistical likelihood that the price will break above the recent range high within the specified forecast horizon. Conversely, when the bearish probability line (plotted negatively) reaches the -50% threshold, it suggests a high probability of a breakdown below the recent range low.
The tool is particularly useful for:
Identifying potential breakout candidates before the price movement occurs.
Assessing the risk of "fakeouts" by comparing price proximity to the range boundary versus the statistical probability of a sustained move.
Determining if current volatility levels are sufficient to support a trend continuation.
🔹 Dashboard
The real-time dashboard provides a concise summary of the current forecast:
Bullish/Bearish Probabilities: The exact percentage chance of a breakout within the selected horizon.
Squeeze Intensity: A metric indicating how compressed the current volatility is relative to historical averages. High squeeze intensity (above 50%) often precedes significant expansion.
Horizon: The number of bars the current forecast is looking into the future.
🔶 DETAILS
The script utilizes a Log-Normal Random Walk model to forecast price distributions. This approach assumes that price returns follow a normal distribution, allowing the script to calculate the Z-score for the distance between the current price and the range boundaries.
🔹 Breakout Probability
The probability is derived using the Normal Cumulative Distribution Function (CDF). It calculates the area under the bell curve beyond the upper and lower range boundaries, adjusted for the square root of time (Forecast Horizon) and the standard deviation of log returns (Volatility Lookback).
🔹 Volatility Squeeze
The Squeeze Intensity metric compares the current Average True Range (ATR) to its 100-period simple moving average. When the ATR is significantly lower than its historical average, the intensity increases, signaling that the market is in a period of low-volatility consolidation that often leads to a "volatility explosion."
🔶 SETTINGS
🔹 Calculation Settings
Range Length: The lookback period used to determine the highest high and lowest low that act as the breakout boundaries.
Forecast Horizon (Bars): The number of bars into the future the model is predicting. A longer horizon generally increases the probability of hitting a boundary but decreases the precision of the timing.
Volatility Lookback: The period used to calculate the standard deviation of log returns, which informs the "width" of the expected price distribution.
🔹 Visualization
Bullish/Bearish Color: Customizes the colors for the respective probability plots and fills.
Fill Transparency: Adjusts the visibility of the area between the probability lines and the zero baseline.
🔹 Dashboard
Enable Dashboard: Toggles the visibility of the on-screen information table.
Position: Moves the dashboard to different corners of the chart.
Size: Adjusts the scale of the dashboard text and cells.
Indicador
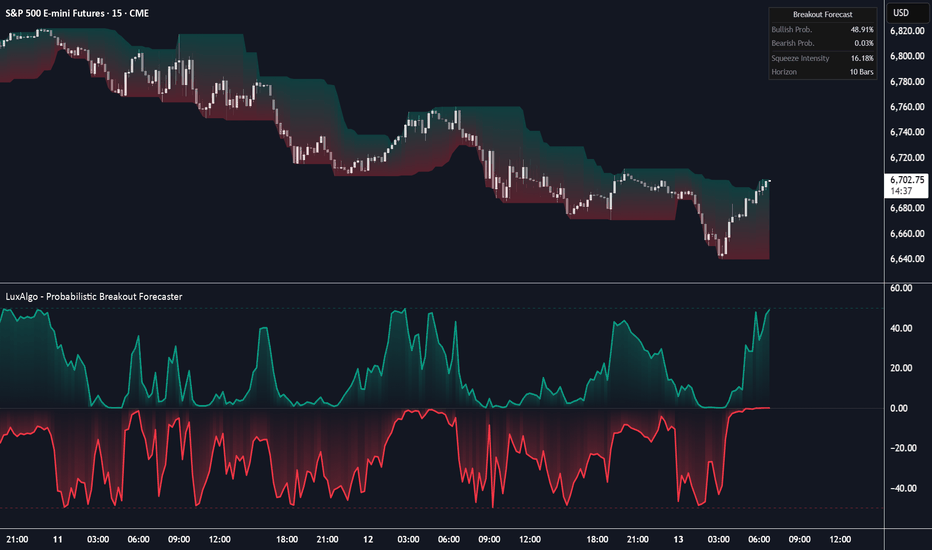
Radiant Mean Reversion Channels [Pineify]Radiant Mean Reversion Channels - HMA & ATR Normalized Oscillator with Dynamic Gradient Signals
The Radiant Mean Reversion Channels indicator is a volatility-normalized oscillator designed to detect high-probability mean reversion setups across any market and timeframe. It transforms a Hull Moving Average (HMA) based channel into a bounded 0–100 oscillator, making it easy to spot when price has stretched to statistical extremes and is likely to revert toward equilibrium. By combining the low-lag properties of HMA with the adaptive volatility measurement of ATR, this indicator provides fast, accurate overbought and oversold readings without the noise common in traditional oscillators.
Key Features
HMA-based dynamic mean for ultra-low-lag price tracking
ATR-driven volatility bands that automatically adapt to market conditions
Normalized 0–100 oscillator scale for consistent interpretation across all instruments
WMA smoothing to reduce whipsaws while preserving signal responsiveness
Dynamic gradient coloring that shifts from bearish to bullish based on oscillator value
Clearly defined overbought (80/90) and oversold (10/20) zones with visual fills
Automatic buy and sell signal generation on mean reversion crossovers
Built-in alert conditions for seamless trading automation
How It Works
The indicator follows a five-step calculation pipeline that converts raw price action into a clean, actionable oscillator:
Dynamic Mean via HMA: The center of the channel is calculated using a Hull Moving Average of the selected source over the specified channel length. HMA was chosen specifically because it dramatically reduces lag compared to SMA or EMA while maintaining a smooth curve, giving traders a more accurate real-time estimate of the current mean price.
Volatility Measurement via ATR: The Average True Range over the same lookback period measures current market volatility. This value is scaled by a user-defined Band Multiplier to create the channel width. ATR naturally adapts—widening during volatile conditions and tightening during consolidation—ensuring the channel remains contextually appropriate.
Channel Construction: The upper and lower bands are formed by adding and subtracting the scaled ATR from the HMA mean. This creates a dynamic envelope that contains most price action under normal conditions.
Normalization to Oscillator: The price position within the channel is normalized using the formula: (Price - Lower Band) / (Upper Band - Lower Band) × 100. This maps the channel into a 0–100 scale where 0 represents the lower band, 100 represents the upper band, and 50 represents the mean. Values above 100 or below 0 indicate price has exceeded the channel boundaries.
WMA Smoothing: The raw oscillator is smoothed using a Weighted Moving Average, which gives more weight to recent readings. This reduces noise and false signals while keeping the oscillator responsive to genuine shifts in momentum.
Trading Ideas and Insights
Mean reversion is a core principle in quantitative trading—prices tend to oscillate around a fair value and snap back after stretching too far. The Radiant Mean Reversion Channels quantifies this behavior by measuring exactly where price sits within its volatility envelope:
When the oscillator rises above 80, price is near the upper channel band—a statistically overbought condition where selling pressure often emerges
When the oscillator falls below 20, price is near the lower channel band—an oversold zone where buyers tend to step in
The extreme levels at 90 and 10 represent deeper extensions where reversion probability increases significantly
Signal generation occurs when the oscillator crosses back inside these zones, timing the actual beginning of the reversion move rather than trying to catch the exact top or bottom
This method excels in range-bound and mean-reverting markets. In trending markets, the signals can be used to identify pullback entry opportunities in the direction of the prevailing trend.
How Multiple Indicators Work Together
The Radiant Mean Reversion Channels integrates three distinct technical concepts into a cohesive analytical framework:
Hull Moving Average (Mean): HMA serves as the dynamic center of the channel. Its unique double-smoothed, lag-compensated formula (using nested WMAs with square root period adjustment) provides a mean line that reacts to trend changes significantly faster than traditional averages. This ensures the "fair value" baseline stays current with evolving market conditions.
Average True Range (Volatility): ATR measures real market volatility by accounting for gaps and true trading ranges—not just close-to-close changes. As the volatility component, ATR automatically adjusts the channel width. During high-volatility periods, the channel expands so that only truly extreme moves trigger signals. During low-volatility periods, it contracts to remain sensitive, preventing missed opportunities.
Weighted Moving Average (Smoothing): The WMA applied to the normalized oscillator gives heavier weight to the most recent data points. This produces a smoother output than SMA while introducing less lag than EMA for short smoothing periods, striking an optimal balance between signal clarity and timeliness.
These three components work together synergistically: HMA tracks where price should be, ATR defines how far is too far, and WMA ensures the final oscillator reading is clean and reliable.
Unique Aspects
HMA-ATR Combination: Most channel-based oscillators use Bollinger Bands (SMA + Standard Deviation). By pairing HMA with ATR, this indicator benefits from lower lag on the mean and a volatility measure that accounts for gaps and true range—producing faster and more robust channel boundaries
Dynamic Gradient Visualization: The oscillator line smoothly transitions color from bearish to bullish across the 0–100 range using a continuous gradient. This provides immediate visual feedback on market conditions without requiring traders to reference fixed levels
Dual-Zone Architecture: The indicator features both standard zones (20/80) and extreme zones (10/90) with distinct visual fills, helping traders differentiate between moderate and extreme conditions at a glance
Normalization Advantage: By converting the channel into a normalized oscillator, traders can compare readings across different assets and timeframes on a consistent scale, making it versatile for multi-market analysis
How to Use
Add the indicator to your chart—it displays as a sub-chart oscillator below the main price chart
Monitor the oscillator's position: readings above 80 indicate overbought conditions, below 20 indicate oversold conditions
Watch for buy signals (circles at the bottom) when the oscillator crosses back above 20 from oversold territory, indicating a bullish mean reversion is underway
Watch for sell signals (circles at the top) when the oscillator crosses back below 80 from overbought territory, signaling a bearish mean reversion
Use the gradient color intensity to quickly assess momentum—greener tones indicate bullish positioning while redder tones indicate bearish positioning
Combine with trend analysis: in uptrends, prioritize buy signals near the 20 level; in downtrends, prioritize sell signals near the 80 level
Enable alerts using the built-in alert conditions to receive notifications when reversion signals trigger
Customization
Channel Length (default: 21): Controls the lookback period for both the HMA mean and ATR volatility calculation. Shorter values increase sensitivity for scalping; longer values provide smoother readings for swing trading
Band Multiplier (default: 2.0): Adjusts the channel width by scaling the ATR value. Higher values create wider channels, producing fewer but higher-confidence signals. Lower values narrow the channel for more frequent signals
Oscillator Smoothing (default: 3): Controls the WMA smoothing period applied to the raw oscillator. Increase this value in choppy markets to filter out noise; decrease it in clean-trending markets for faster signals
Source (default: Close): Select the price source for all calculations. Alternatives like HL2 or HLC3 can provide smoother inputs
Bullish/Bearish/Neutral Colors: Fully customizable color scheme for the gradient, zones, and signal markers to match your preferred chart theme
Conclusion
The Radiant Mean Reversion Channels indicator offers traders a refined approach to mean reversion analysis by combining the speed of Hull Moving Average, the adaptive volatility measurement of ATR, and intelligent WMA smoothing into a single normalized oscillator. Its gradient visualization, clearly defined reversion zones, and automated signal generation make it a practical and visually intuitive tool for identifying high-probability reversal points. Whether used for timing entries in range-bound markets or catching pullbacks in trending conditions, this indicator brings clarity and precision to mean reversion trading strategies.
Indicador

Indicador

Indicador

Robrechtian Long-Medium Breakout Trend SystemRobrechtian Long–Medium-Term Breakout Trend System
A professional, rule-based trend-following strategy designed to capture large, sustained price movements using pure price action and breakouts.
This system follows long-established trend-following philosophy: no prediction, no volatility targeting, and no profit targets. Only disciplined entries, position additions, and exits driven entirely by trend structure.
Core Principles
Breakout-driven entries: Initial positions are taken only when price breaks above/below the 80-day Donchian channel, confirming a long–medium-term trend shift.
Short-term confirmation: Breakouts must also exceed the 20-day channel, reducing false positives.
Trend-direction filter: A 50-day moving average slope filter ensures alignment with the broader trend.
Explosive bar filter: Entries avoid excessively large, single-candle expansions (>2.5× ATR(20)) to prevent chasing exhaustion spikes.
Pyramiding into strength: Additional units are added only when price makes fresh 20-day breakouts in the direction of the trend. No scaling out. No adding on dips.
Exit only on trend violation: Positions are closed exclusively when price breaks the opposite 80-day channel. This preserves unlimited upside while enforcing disciplined exits.
Pure trend philosophy: No volatility targeting, no smoothing, no discretionary overrides, no optimization for short-term performance.
Intended Use
This system is designed primarily for diversified futures portfolios, where diversification across dozens of globally liquid markets creates robustness and stability. However, it may also be used on individual assets for educational and analytical purposes.
The system embraces the core trend-following logic:
Small losses, big winners, and unlimited upside when trends persist.
⚠️ WARNINGS / DISCLAIMERS
⚠️ Warning 1 — This strategy is not optimized for single stocks
The Robrechtian Trend System is designed for multi-asset futures portfolios, not single equities.
Performance on individual tickers may vary greatly due to lack of diversification.
⚠️ Warning 2 — Trend following includes substantial drawdowns
Deep drawdowns are a normal and expected feature of all long-term trend-following systems.
The strategy does not attempt to smooth returns or manage volatility.
If you seek steady, low-volatility equity curves, this system is not suitable.
⚠️ Warning 3 — No volatility targeting or risk smoothing
This system intentionally avoids volatility-based position sizing.
Trades may experience larger fluctuations than systems using risk parity or vol targeting.
⚠️ Warning 4 — Not financial advice
This script is for educational and research purposes only.
Past performance does not guarantee future results.
Use at your own risk.
⚠️ Warning 5 — TradingView backtests have known limitations
TradingView does not simulate:
futures contract roll logic
slippage
real bid/ask spreads
liquidity conditions
limit-up/limit-down behavior
Results may vary from live market execution. Estrategia

Indicador

Turtle System 1 (20/10) + N-Stop + MTF Table V7.2🐢 Description: Turtle System 1 (20/10) IndicatorThis indicator implements the original trading signals of the Turtle Trading System 1 based on the classic Donchian Channels. It incorporates a historically correct, volatility-based Trailing Stop (N-Stop) and a Multi-Timeframe (MTF) status dashboard. The script is written in Pine Script v6, optimized for performance and reliability.📊 Core Logic and ParametersThe system is a pure trend-following model, utilizing the more widely known, conservative parameters of the Turtle System 1:FunctionParameterValueDescriptionEntry$\text{Donchian Breakout}$$\mathbf{20}$Buy/Sell upon breaking the 20-day High/Low.Exit (Turtle)$\text{Donchian Breakout}$$\mathbf{10}$Close the position upon breaking the 10-day Low/High.Volatility$\mathbf{N}$ (ATR Period)$\mathbf{20}$Calculation of market volatility using the Average True Range (ATR).Stop-LossMultiplier$\mathbf{2.0} BER:SETS the initial and Trailing Stop at $\mathbf{2N}$.🛠️ Key Technical Features1. Original Turtle Trailing Stop (Section 4)The stop-loss mechanism is implemented with the historically accurate Turtle Trailing Logic. The stop is not aggressively tied to the current candle's low/high, which often causes premature exits. Instead, the stop only trails in the direction of the trend, maximizing the previous stop price against the new calculated $\text{Close} \pm 2N$:$$\text{New Trailing Stop} = \text{max}(\text{Previous Stop}, \text{Close} \pm (2 \times N))$$2. Reliable Multi-Timeframe (MTF) Status (Section 6)The indicator features a robust MTF status table.Purpose: It calculates and persistently stores the Turtle System 1 status (LONG=1, SHORT=-1, FLAT=0) for various timeframes (1H, 4H, 8H, 1D, and 1W).Method: It uses global var int variables combined with request.security(), ensuring the status is accurately maintained and updated across different bars and timeframes, providing a reliable higher-timeframe context.3. VisualizationsChannels: The 20-period (Entry) and 10-period (Exit) Donchian Channels are plotted.Stop Line: The dynamic $\mathbf{2N}$ Trailing Stop is visible as a distinct line.Signals: plotshape markers indicate Entry and Exit.MTF Table: A clean, color-coded status summary is displayed in the upper right corner. Indicador
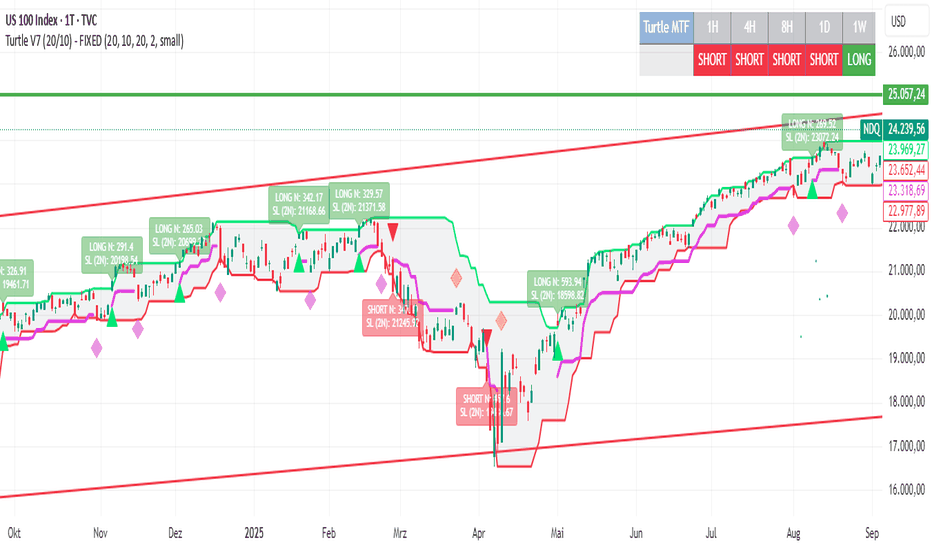
Turtle System 2 (55/20) + N-Stop + MTF Table V7.2🐢 Description: Turtle System 2 (55/20) IndicatorThis indicator implements the trading signals of the Turtle Trading System 2 based on the classic Donchian Channels, supplemented by a historically correct, volatility-based Trailing Stop (N-Stop) and a Multi-Timeframe (MTF) status overview. The script was developed in Pine Script v6 and is optimized for performance and robustness.📊 Core Logic and ParametersThe indicator is based on the rule-based trend-following system developed by Richard Dennis and William Eckhardt, utilizing the more aggressive Entry/Exit parameters of System 2:FunctionParameterValueDescriptionEntry$\text{Donchian Breakout}$$\mathbf{55}$Buy/Sell upon breaking the 55-day High/Low.Exit (Turtle)$\text{Donchian Breakout}$$\mathbf{20}$Close the position upon breaking the 20-day Low/High.Volatility$\mathbf{N}$ (ATR Period)$\mathbf{20}$Calculation of market volatility using the Average True Range (ATR).Stop-LossMultiplier$\mathbf{2.0} BER:SETS the initial and Trailing Stop at $\mathbf{2N}$.🛠️ Technical Implementation1. Correct Trailing Stop (Section 4)In contrast to many flawed implementations, the Trailing Stop is implemented here according to the Original Turtle Logic. The stop price (current_stop_price) is not aggressively tied to the current low or high. Instead, at the close of each bar, it is only trailed in the direction of the trade (math.max for long positions) based on the formula:$$\text{New Trailing Stop} = \text{max}(\text{Previous Stop}, \text{Close} \pm (2 \times N))$$This ensures the stop is only adjusted upon sustained positive movement and is not prematurely triggered by short-term, deep price shadows.2. Reliable Multi-Timeframe (MTF) Logic (Section 6)The MTF section utilizes global var int variables (mtf_status_1h, mtf_status_D, etc.) in conjunction with the request.security() function.Purpose: Calculates and persistently stores the current Turtle System 2 status (LONG=1, SHORT=-1, FLAT=0) for the timeframes 1H, 4H, 8H, 1D, and 1W.Advantage: By persistently storing the status using the var variables, the critical error of single-update status is eliminated. The states shown in the table are reliable and accurately reflect the Turtle System's position status on the respective timeframes.3. Visual ComponentsDonchian Channels: The entry (55-period) and exit (20-period) channels are drawn with color highlighting.N-Stop Line: The dynamically calculated Trailing Stop ($\mathbf{2N}$) is displayed as a magenta line.Visual Signals: plotshape markers indicate Entry and Exit points.MTF Table: A compact status summary with color coding (Green/Red/Gray) for the higher timeframes is displayed in the upper right corner. Indicador
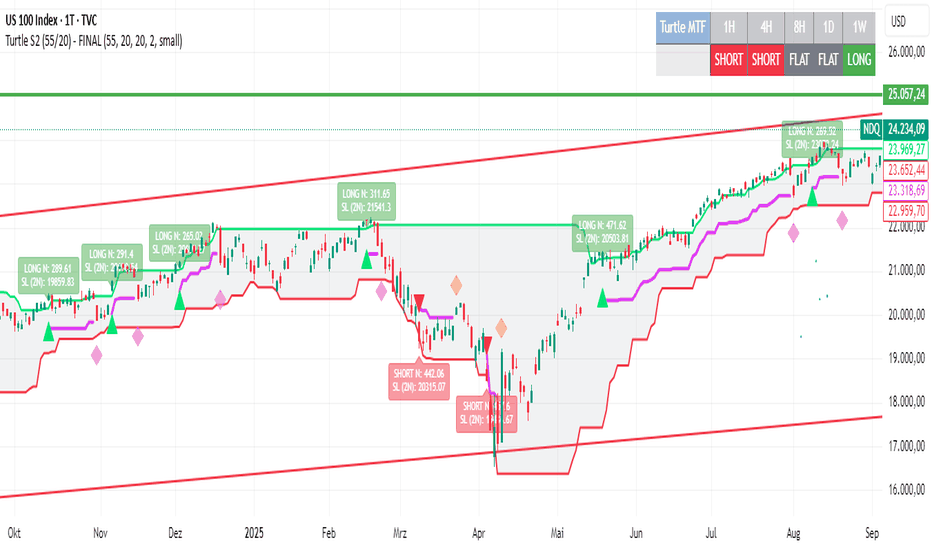
Indicador
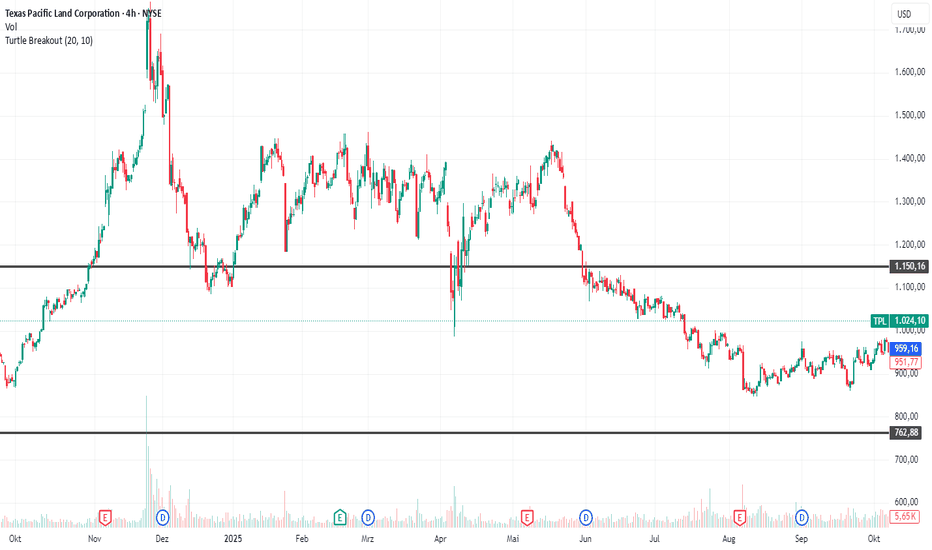
Indicador