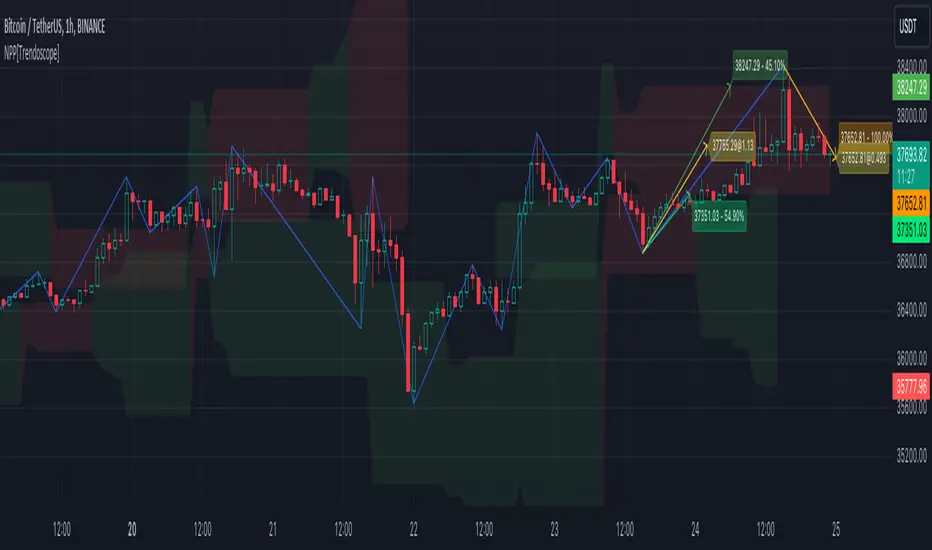
Next Pivot Projection [Trendoscope]Still experimental. Extending further on the divergence backtest results - in this script we try to project next 2 pivots (including one unconfirmed pivot)
🎲 Previous experiments
1. Divergence-Backtester
2. Divergence-Backtester-V2
🎲 Additions
Apart from collecting the stats on number of occurrences of HH, HL, LH, LL - this script also keeps track of average ratio for each levels and average bars.
Based on these data, we try to calculate the next pivot projections including possib
Indicadores y estrategias
Equity Bond Currency DashboardDepicts demand-flow between Equities, Bonds and Currencies of 6 countries. Useful in tracking the flow of smart money and checking the dynamics of inter-connected markets.
Principle:
DXY lies at the heart of the diagram with usd-currency pairs of 5 countries connected to it. When demand for a currency increases it strengthens against Dollar. This is depicted by a line from DXY to the currency indicating demand flow from Dollar to the currency (DXY is only an indicative symbol for Dollar, the c
Volume Profile Volume Delta OI Delta [Kioseff Trading]Hello!
This script serves to distinguish volume delta for any asset and open interest delta for Binance perpetual futures.
The image above provides further explanation of functionality and color correspondence.
The image above shows the indicator calculating volume at each tick level and displaying the metric.
The label color outline (neon effect) is configurable; the image above is absent the feature.
The image above shows Open Interest (OI) Delta calculated - similar to how
Minervini QualifierThe Minervini Qualifier indicator calculates the qualifying conditions from Mark Minervini’s book “Trade like a Stock Market Wizard”.
The condition matching is been shown as fill color inside an SMA 20day envelope curve.
If the envelope color is red, current close price is below the SMA20 and when blue, current close price is above the SMA20. The fill color can be transparent (not matching qualifying conditions), yellow (matching all conditions except close is still below SMA50), green (all con
Time & volume point of control / Flowly IndicatorsWhat are TPOC & VPOC?
TPOC (time point of control) and VPOC (volume point of control) are points in price where highest amount of time/volume was traded. This is considered key information in a market profile, as it shows where market participant interest was highest. Unlike full fledged market profile that shows total time/volume distribution, this script shows the points of control for each candle, plotted with a line (time) and a dot (volume). The script hides your candles/bars by default a
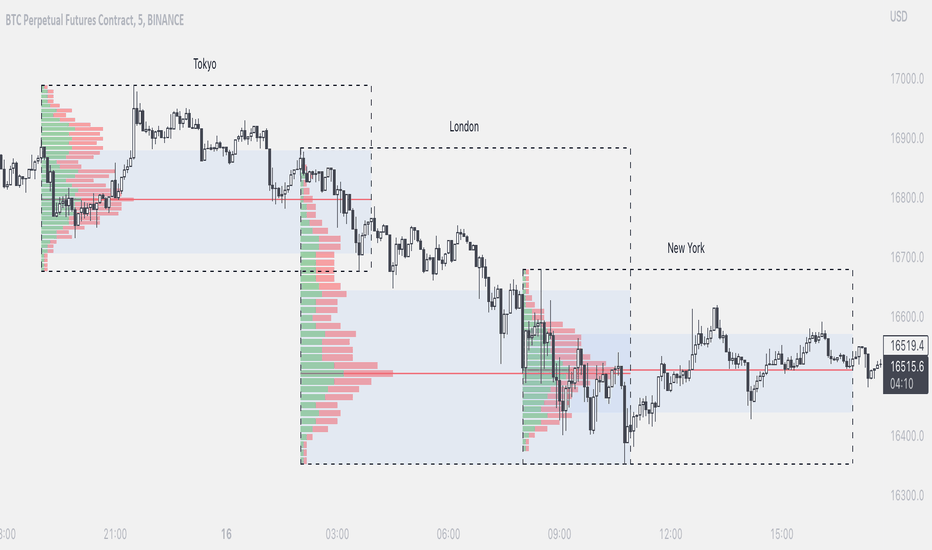
Market sessions and Volume profile - By LeviathanThis script allows you to keep track of Forex market sessions (Tokyo, London and New York), as well as Daily, Weekly and Monthly sessions. All of them are accompanied by Volume Profile options where you can view VP Histogram, Point of Control, Value Area High and Value Area Low.
Colors, lines and other design preferences are fully customizable.
* Volume Profile of shorter sessions (eg. Tokyo, London, New York) works better when using lower timeframes such as 15min, 5min, etc.
** Use timefram
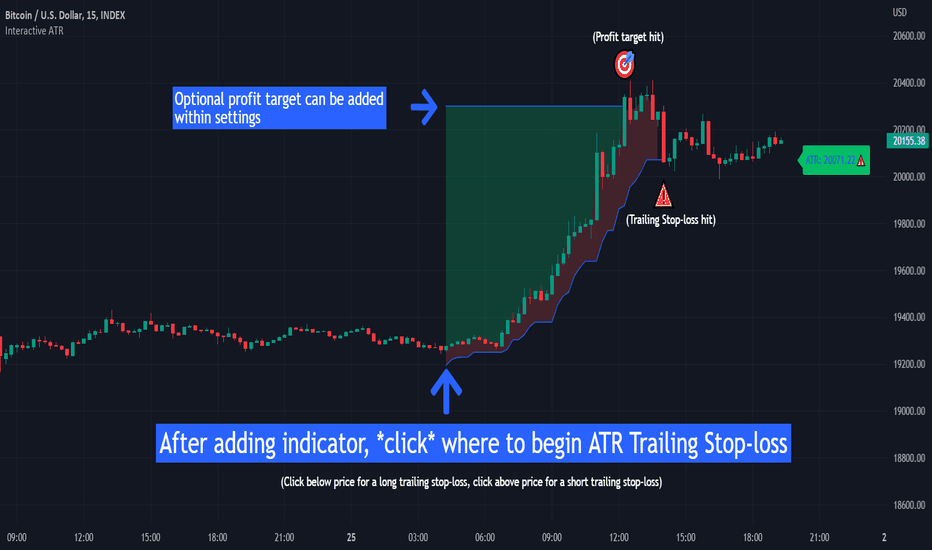
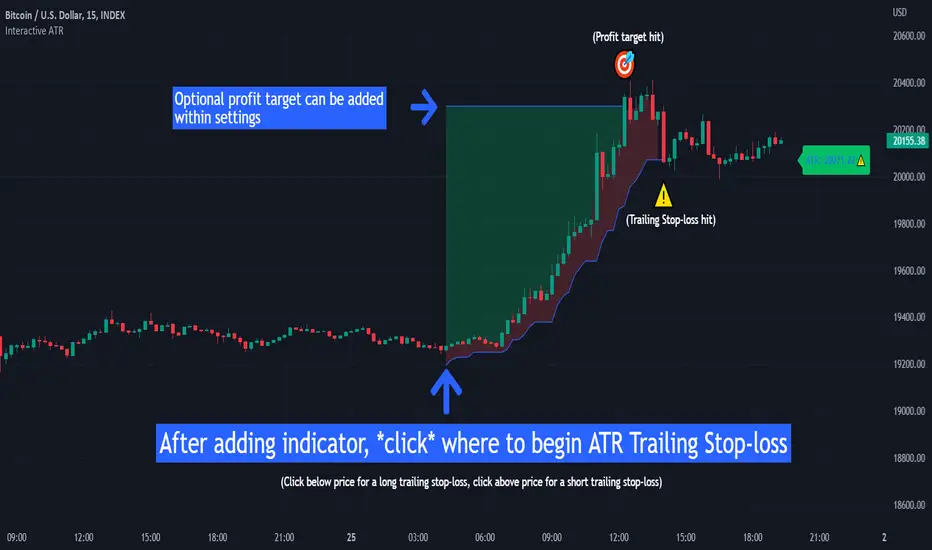
Interactive ATR Stop-Loss [TANHEF]This indicator is "Interactive" which means some inputs can are manually added through the first click after adding the indicator to the chart (ATR Trailing Stop-loss start point). See images below for more explanation.
Why use a trailing stop-loss?
A trailing stop-loss provides an exit when price moves against you but also enables you to move the exit point further into profit when price is moving in the desired direction of a trade. The ATR (Average True Range) which is used to measure vola
Extreme Trend Reversal Points [HeWhoMustNotBeNamed]Using moving average crossover for identifying the change in trend is very common. However, this method can give lots of false signals during the ranging markets. In this algorithm, we try to find the extreme trend by looking at fully aligned multi-level moving averages and only look at moving average crossover when market is in the extreme trend - either bullish or bearish. These points can mean long term downtrend or can also cause a small pullback before trend continuation. In this discussion
Oscillator Workbench — Chart [LucF]█ OVERVIEW
This indicator uses an on-chart visual framework to help traders with the interpretation of any oscillator's behavior. The advantage of using this tool is that you do not need to know all the ins and outs of a particular oscillator such as RSI, CCI, Stochastic, etc. Your choice of oscillator and settings in this indicator will change its visuals, which allows you to evaluate different configurations in the context of how the workbench models oscillator behavior. My hope is that by
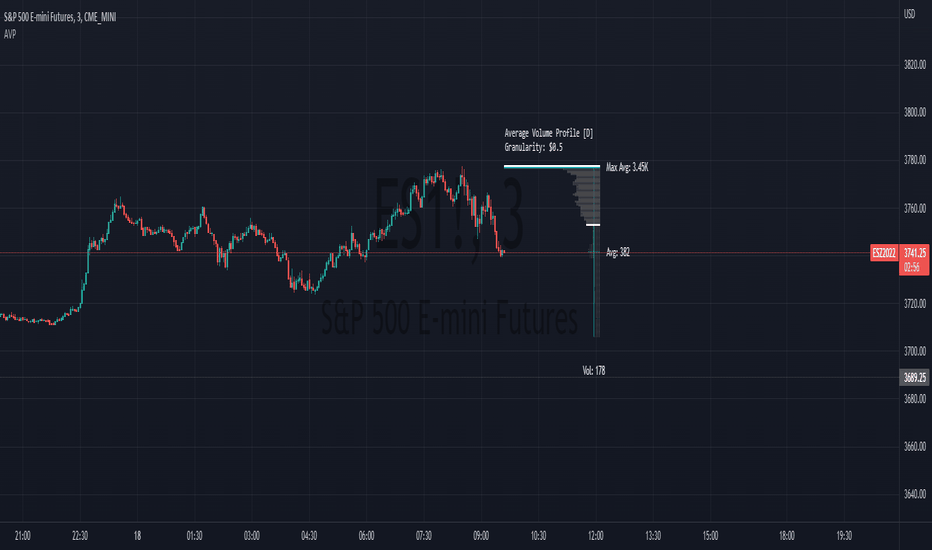
Average Volume ProfileAverage Volume Profile is an abstract based on a user suggestion.
The information displayed could be summed up as a volume profile divided by a market profile.
This indicator is a profile which displays the average volume of an area (of price).
It also calculates and displays the highest average volume point (HAV) and the relating value zones (calculated in the similar fashion to a volume profile).
Most of the code is directly from my "Volume/Market Profile" Indicator
I am not entirely sure
Sector RotationThis script is attempt to create and observe the real-time and historical performance of the all major sectors of Indian Market in one screen.
for Data Presentation I used Short sector names so that I can manage to get space and efficient presentable data.
Short Names and Actual Sector Names
BNF : CNX-BANKNIFTY
IT : CNX-IT
PRMA : CNX - PHARMA
FMCG : CNX-FMCG
AUTO : CNX-AUTO
MTAL : CNX-METAL
MDIA : CNX-MEDIA
RLTY : CNX-REALTY
IFRA : CNX-INFRA
ENGY : CNX-ENERGY
PSU-B : C
HH-LL ZZAnother ZigZag, yes...
I believe though this concerns another angle/principle, therefore I wanted to share
How does it work?
Given:
source for level breach -> close
X breaches -> 3
Let's say this is the latest found 'lower low' (LL - blue dot under bar):
This bar has been triggered because 3 bars closed under low of previous 'trigger bar' (TB )
The high and low of this new TB will act as triggers
(aqua blue lines, seen in image above)
Then t
Black Scholes Option Pricing Model w/ Greeks [Loxx]The Black Scholes Merton model
If you are new to options I strongly advise you to profit from Robert Shiller's lecture on same . It combines practical market insights with a strong authoritative grasp of key models in option theory. He explains many of the areas covered below and in the following pages with a lot intuition and relatable anecdotage. We start here with Black Scholes Merton which is probably the most popular option pricing framework, due largely to its simplicity and ease in term
TPO Market Profile [Kioseff Trading]REPOST; SCRIPT WORKS!!
Due to technical error, this script was republished! Thank you for your support (:
Hello!
This indicator comprises a real time TPO Market Profile!
The script works on any timeframe 1 second or greater - the script calculates relative to the timeframe selected for your chart.
The image above shows the 1-minute BTCUSD chart; 650 +/- tick levels are set.
To see the script in full functionality - try using bar replay on a cryptocurrency 1-minute chart (start at the b
Tick StatisticsTick Statistics:
I have seen many questions/queries related to tick data in TV telegram channels. This script will help pine scripts to understand how ticks work, how to capture and process tick data.
This is an educational indicator script for pine scripters.
The indicator shall work only on real time candles. Tick data capture is initiated as soon as indicator is loaded on the chart. You might not get correct statistics on 1st candle in case indicator is loaded when real time candle is in
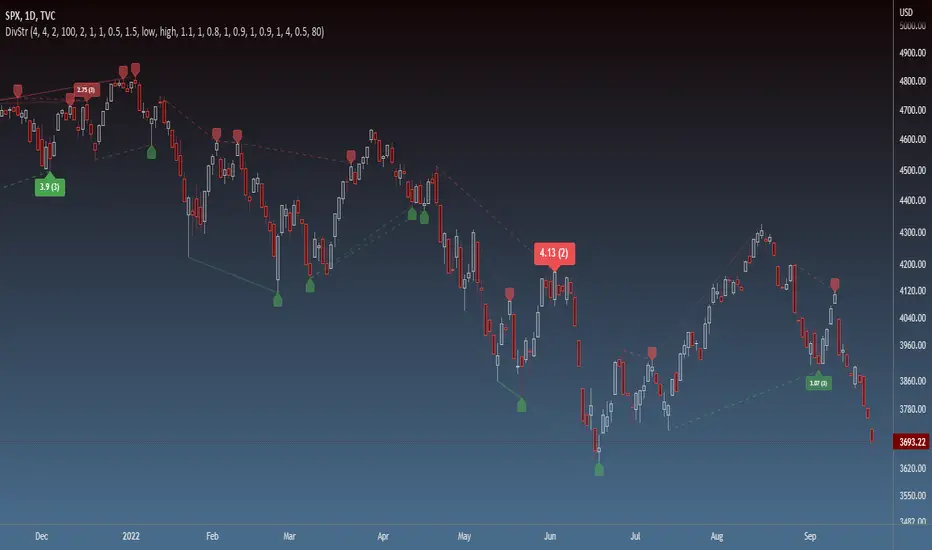
Strength of Divergence Across Multiple IndicatorsOverview:
One-stop shop for all your divergence needs, including:
(1) A single metric for divergence strength across multiple indicators.
(2) Labels that make it easy to spot where the truly strong divergence is by showing the overall divergence strength value along with the number of divergent indicators. Hovering over the label shows a breakdown of each divergent indicator and its individual divergence strength value.
(3) Fully customizable, including inputs for pivot lengths, divergen
RSI Past Can Turn RSI Into a Directional ToolThe Relative Strength Index was created by J. Welles Wilder to measure overbought and oversold conditions. It’s also found popularity as an overall measure of direction because upward-trending stocks often hit overbought conditions. The opposite can be true with underperformers.
Today’s custom script, RSI Past, attempts to capture this secondary use of RSI as a directional indicator.
RSI Past achieves this by comparing how many bars have passed since RSI's most recent overbought and oversold
ABC 123 Harmonic Ratio Custom Range Interactive█ OVERVIEW
This indicator was designed based on Harmonic Trading : Volume One written by Scott Carney.
This is about harmonic ratios which expanded through retracement and projection.
Derivation is pretty much explained here such as Primary, Primary Derivation, Secondary Derivation and Secondary Derivation Extreme.
Derivation value depends on minimum retracement or maximum projection.
This derivation value utilize Fibonacci value which later expand to Harmonic Ratio.
█ INSPIRATION
Inspired
Machine Learning: kNN (New Approach)Description:
kNN is a very robust and simple method for data classification and prediction. It is very effective if the training data is large. However, it is distinguished by difficulty at determining its main parameter, K (a number of nearest neighbors), beforehand. The computation cost is also quite high because we need to compute distance of each instance to all training samples. Nevertheless, in algorithmic trading KNN is reported to perform on a par with such techniques as SVM and Random
Delta Volume Channels [LucF]█ OVERVIEW
This indicator displays on-chart visuals aimed at making the most of delta volume information. It can color bars and display two channels: one for delta volume, another calculated from the price levels of bars where delta volume divergences occur. Markers and alerts can also be configured using key conditions, and filtered in many different ways. The indicator caters to traders who prefer chart visuals over raw values. It will work on historical bars and in real time, using int
HSV and HSL gradient Tools ( Built-in Drop-in replacement )Library "hsvColor"
HSV and HSL Gradient Tool Alternatives and helpers. Demo'd is built-in in the middle with HSL/HSV gradients on top/bottom
TODO: Solve for #000000 issue
rgbhsv(_col)
RGB Color to HSV Values
Parameters:
_col : Color input (#abc012 or color.name or color.rgb(0,0,0,0))
Returns: values
rgbhsv(_r, _g, _b, _t)
RGB Color to HSV Values
Parameters:
_r : Red 0 - 255
_g : Green 0 - 255
_b : Blue 0 - 255
_t : Transp 0 - 100
Returns:
STD-Filtered, N-Pole Gaussian Filter [Loxx]This is a Gaussian Filter with Standard Deviation Filtering that works for orders (poles) higher than the usual 4 poles that was originally available in Ehlers Gaussian Filter formulas. Because of that, it is a sort of generalized Gaussian filter that can calculate arbitrary (order) pole Gaussian Filter and which makes it a sort of a unique indicator. For this implementation, the practical mathematical maximum is 15 poles after which the precision of calculation is useless--the coefficients for
Portfolio PerformanceThis indicators will help you to compute portfolio performance and display results with a stats table and a nice monthly chart.
In this script you can do following:
Compose portfolio with up to 15 instruments
Change Initial capital / date range / rebalancing period
Compare portfolio performance with a benchmark
Compute basic stats
Compute instruments contribution
Display monthly performance of portfolio and benchmark
Change style for almost everything you see on your chart
Weighted percentile nearest rankYo, posting it for the whole internet, took the whole day to find / to design the actual working solution for weighted percentile 'nearest rank' algorithm, almost no reliable info online and a lot of library-style/textbook-style solutions that don't provide on real world production level.
The principle:
0) initial data
data = 22, 33, 11, 44, 55
weights = 5 , 3 , 2 , 1 , 4
array(s) size = 5
1) sort data array, apply the sorting pattern to the weights array, resulting:
data = 11,