Adaptive Trend Finder (log)In the dynamic landscape of financial markets, the Adaptive Trend Finder (log) stands out as an example of precision and professionalism. This advanced tool, equipped with a unique feature, offers traders a sophisticated approach to market trend analysis: the choice between automatic detection of the long-term or short-term trend channel.
Key Features:
1. Choice Between Long-Term or Short-Term Trend Channel Detection: Positioned first, this distinctive feature of the Adaptive Trend Finder
LOGARITHMIC
Logarithmic CVD [IkkeOmar]The LCVD is another Mean-Reversion Indicator. it doesn't detect trends and does not give a signal per se. However the logarithmic transformation is made to visualize the direction of the trend for the volume. This allows you to see if money is flowing in or out of an asset.
What it does is tell you if we have a flashcrash based on the difference in volume.
Think of this indicator like a form of a volatility index.
Smoothing input:
The only input is an input for the smoothing length of the l
Indicador
Logarithmic Volatility Direction Index [IkkeOmar]The LVDI is a Mean-Reversion Indicator. it doesn't detect trends and does not give a signal per se.
What it does is tell you if we have a flashcrash based on the price action and volume that is available. It is not always easy to see with the naked eye, so this indicator can help you DCA into an asset in a smarter way, if you couple it with other trend systems.
Think of this indicator like a form of a volatility index.
Inputs:
len and lenWMA are integers representing different lengths for calc
Indicador
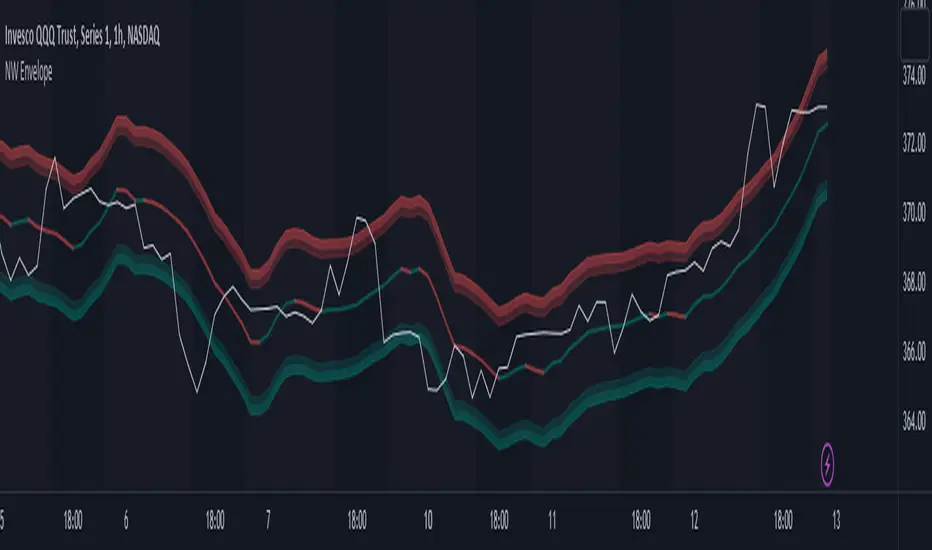
Nadaraya-Watson Envelope Strategy (Non-Repainting) Log ScaleIn the diverse world of trading strategies, the Nadaraya-Watson Envelope Strategy offers a different approach. Grounded in mathematical analysis, this strategy utilizes the Nadaraya-Watson kernel regression, a method traditionally employed for interpreting complex data patterns.
At the core of this strategy lies the concept of 'envelopes', which are essentially dynamic volatility bands formed around the price based on a custom Average True Range (ATR). These envelopes help provide guidance on p
Estrategia
Adaptive Price Channel (log scale)The field of technical analysis is consistently expanding, with numerous indicators used for market forecasting. Amongst them, a novel indicator dubbed the Adaptive Price Channel (log scale), inspired by the renowned Nadaraya-Watson Envelope (LuxAlgo) from LuxAlgo, is gaining traction for its distinctive features and versatility. Unlike its predecessor, the Adaptive Price Channel (log scale) is applicable on a logarithmic scale, thereby allowing it to be utilized on both smaller and larger timef
Indicador
Nadaraya-Watson Envelope (Non-Repainting) Logarithmic ScaleIn the fast-paced world of trading, having a reliable and accurate indicator can make all the difference. Enter the Nadaraya-Watson Envelope Indicator, a cutting-edge tool designed to provide traders with valuable insights into market trends and potential price movements. In this article, we'll explore the advantages of this non-repainting indicator and how it can empower traders to make informed decisions with confidence.
Accurate Price Analysis:
The Nadaraya-Watson Envelope Indicator operat
Indicador
Linear Regression Channel (Log)The Linear Regression Channel (Log) indicator is a modified version of the Linear Regression channel available on TradingView. It is designed to be used on a logarithmic scale, providing a different perspective on price movements.
The indicator utilizes the concept of linear regression to visualize the overall price trend in a specific section of the chart. The central line represents the linear regression calculation, while the upper and lower lines indicate a certain number of standard deviat
Indicador
Weighted Bollinger Band (+ Logarithmic)ENG)
Weighted BB is more responsive to price changes than original Bollinger Bands.
the calculation formula uses a weighted method based on the current price.
Instead of using a standard deviation, I used a weighted standard deviation that weights the current price, and instead of a simple moving average, I used a weighted moving average.
Also included is a formula to log the Bollinger Bands for users who view charts on a logarithmic scale.
KOR)
원본 볼밴보다 가격변화에 대한 반응성이 높습니다.
계산식에는 현재가격에 가
Indicador
Hussarya Volume cumulated. Buy Sell.
Volume frome curent chart or cumulated volume from Binance, Bybit Kraken, Ftx and Coinbase.
You can chose also. log scale on simple or cumulated volume.
Colors:
Grey. total volume
Red. sell Volume
Green. Buy volume
Red or green shows only bigger value
Indicador
L'MACD GUNHi all!
I would like to present you my universal MACD module.
In addition to the standard functions I have added several improvements:
Source Selection.
In addition to the standard calculation of the moving average "EMA", in the parameter "MA Type" I have added 52 more methods for calculating the MA! :
ADXMA, AHMA, ALF, ALMA, ARI, ARSI, BlackFilter, CTI, DoubleEma, DTA, DWMA, EEO, EHMA, ELA, EMARSI, EREA, HEMA, hma, HWMA, JAMA, KA, KAMA, LSMA, LWMA, McGinley_2, MNMA, PAW, RE
Indicador
Bitcoin Best Value CorridorHere is my interpretation of the "Best Time To Buy" Bitcoin over its lifetime using a logarithmic regression trendline. The upper and lower lines are 10% deviations from the centre line. I calculated the trendline in excel and then coded my results into pine script.
Indicador
Bitcoin Inflation-Adjusted Support and Resistance5year breakeven inflation rate fitted for log BTC chart as Support and Resistance
Indicador
Logarithmic Bollinger BandsLogarithmic Bollinger Bands
Published by Eric Thies on January 14, 2022
Summary
In this script I have taken the standard Bollinger band pinescript and made efforts to eliminate the behavior experienced in periods of high volatility in which we see the bands disappear completely off the chart by adding exponential plotting and logarithmic sourcing to the tool.
This tool will also show periods of Bearish and Bullish Expansion for users to see when volatility is running high in the market
Indicador
Universal logarithmic growth curves, with support and resistanceLogarithmic regression is used to model data where growth or decay accelerates rapidly at first and then slows over time. This model is for the long term series data (such as 10 years time span).
The user can consider entering the market when the price below 25% or 5% confidence and consider take profit when the price goes above 75% or 95% confidence line.
This script is:
- Designed to be usable in all tickers. (not only for bitcoin now!)
- Logarithmic regression and shows support-resistance l
Indicador
JC Log($/SMA)Simple script with user-definable:
• SMA denominator days.
• A handy and subtle smoothing function for the numerator, in EMA days. Set to 0 to just use the standard current price. (Defaults to 3 for barely noticeable lag and smoothing.)
• User-definable time resolution, independent of the chart. (Or you can set to use the same as the chart.)
Indicador
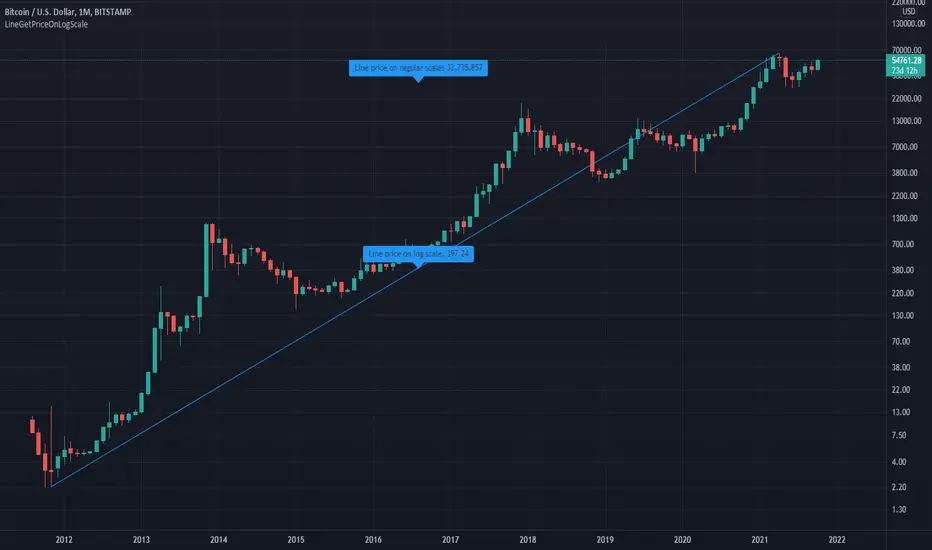
LineGetPriceOnLogScaleLibrary "LineGetPriceOnLogScale"
This library provides a way to calculate the y-coordinate of a line on a specified bar when the chart scale is Log.
The built-in `line.get_price()` function only works with linear scale and gives incorrect results when the chart is in Log scale.
The library only works with `bar_index` values and `xloc.bar_index`-based lines, `time`-based lines will cause errors to appear.
coordGetPriceLog(x1, y1, x2, y2, xi) Calculates the y-coordinate on the specified bar
Biblioteca
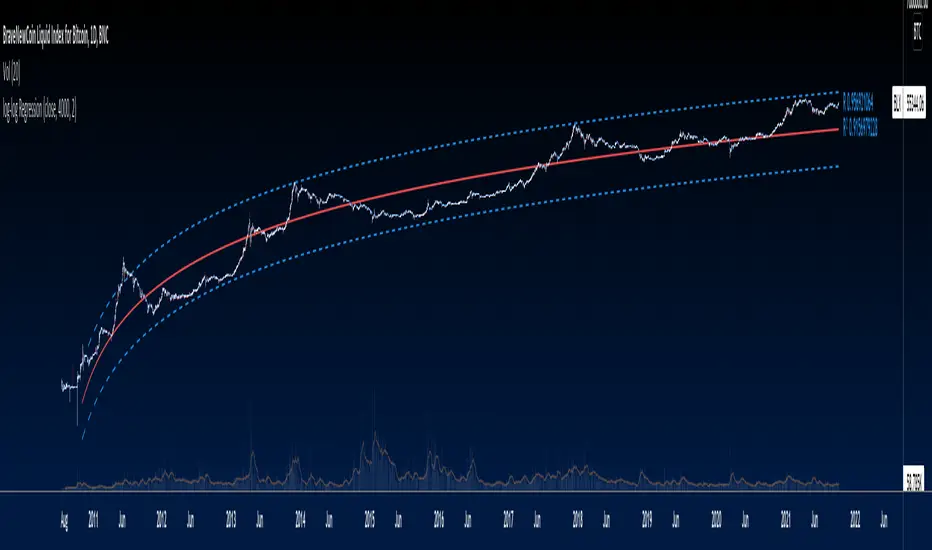
log-log Regression From ArraysCalculates a log-log regression from arrays. Due to line limits, for sets greater than the limit, only every nth value is plotted in order to cover the entire set.
Indicador
Auto Phivots S/R [DM]Greetings colleagues
Today I share the classic pivot points indicator
Added options:
Standard levels
Fibonacci levels "up to 261'8"
Logarithmic scale option
//Pivot Points Standard
//Pivot Points Standard — is a technical indicator that is used to determine the levels
//at which price may face support or resistance. The Pivot Points indicator consists of
//a pivot point (PP) level and several support (S) and resistance (R) levels.
//
//Calculation
//PP, resistance and support values are calc
Indicador
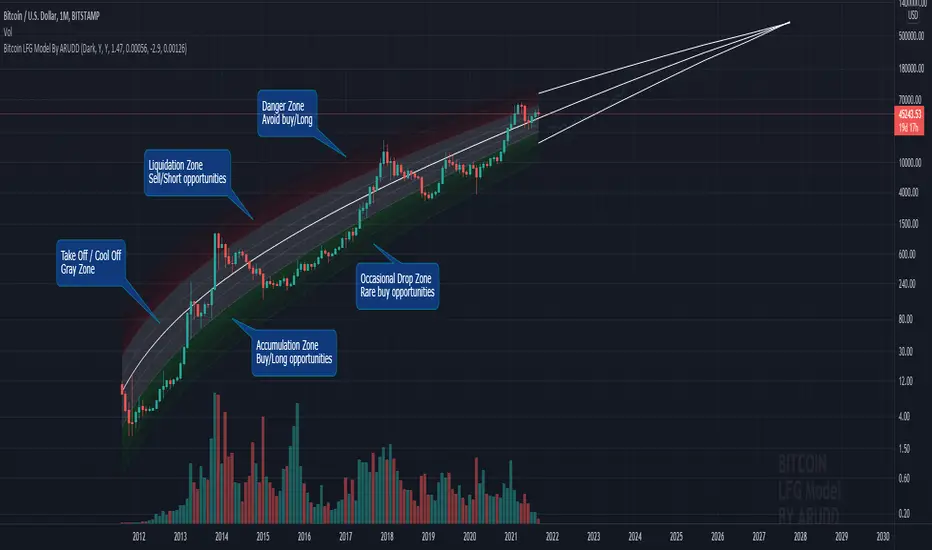
Bitcoin Logarithmic Fractal Growth Model By ARUDDThis model, which I'm calling the Logarithmic Fractal Growth Mode (L.F.G) , uses Bitcoin's mathematical monetary policy to evaluate the future possible price valuation.
It takes into account fractal (and logarithmic) growth as well as how those who hold bitcoins might react to certain events such as changes in supply and demand. It also shows that it is mathematically logical that someday it must become stable.
The information gained from knowing this helps people make more informed decisio
Indicador
Log Scale Linear RegressionThis indicator is basically the standard linear regression but adjusted to be suitable for log scale.
You can use 2 different standard deviation values, choose the data source and lookback length.
The colors are chosen directly on the main menu.
Enjoy!
Indicador
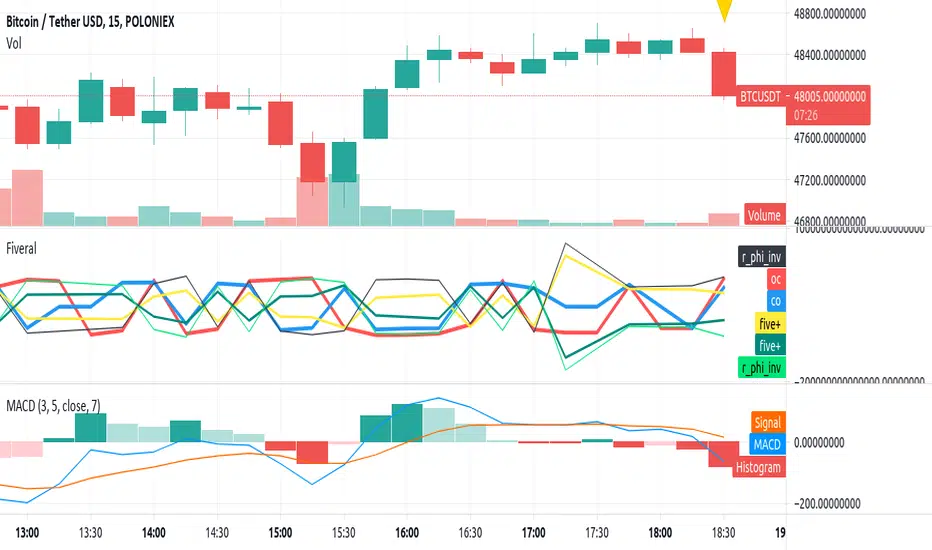
Fiveral: Repulsion/Golden Radio HackAnother in a series of experimental indicators using logarithmic scale visualisation.
This one extends into some work on I've been doing on 'the cube', but Pine isn't liking multiple log lines even when the equations are included for each plotted variable, meaning, no variables used in the definition of a variable, as is done here. As a result, accuracy of this indicator can't be guaranteed between scales, or during use.
Have at it, and enjoy!
Indicador
Repulsion: Price & Volume 1Repulsion: Price & Volume 1
www.quantamagazine.org
Proof of concept using the above link and comparisons of price and volume, and one of a series stemming from the so-called Repulsion Engine, now also open sourced, and other indicators from the workbench.
Traffic lights are not accurate.
Like it if you use it, drop a line if you update it -- or if you have comments about how to improve it.
Indicador
Log MACDThis is just a MACD indicator using the log of the closing price rather than the normal closing price. Useful for exponentially growing stocks and cryptocurrency.
Indicador
Indicador