Indicador
Indicador

Squeeze M + ADX + TTM (Trading Latino & John Carter) by [Rolgui]About this indicator:
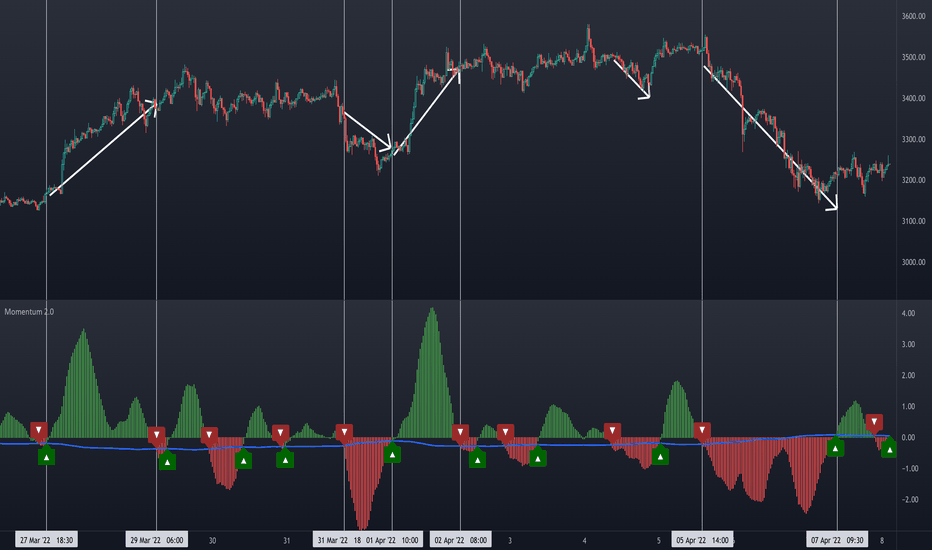
This indicator aims to combine two good performing strategies, which can be used separately or together, mainly for investment positions, although it can also be used for intraday trading.
Strategy 1) Squeeze Oscillator and Average Directional Index:
This strategy is taught by Jaime Aibsai, which determines market entries based on reading the direction of the price movement (Directionality of the Oscillator) along with the strength of the Oscillator (Slope of the ADX).
Both tools are configured according to Jaime Abisai's strategy, by default (note that point 23 of the ADX is represented by point 0 on the panel, to make reading easier, its interpretation is not affected). Anyway you can adjust the input data according to your interest.
*You can see this setting in the first panel.
Strategy 2) Squeeze Momentum and Trade The Market Waves:
This strategy can be consulted either in John F. Carter's books or on his website.
This market reading is based on Price Volatility (Bollinger Bands and Keltner Channels interaction) and its Trend (Exponential Moving Averages), showing entries at times when price volatility is low and taking filtering active trend using T.T.M. Waves.
To configure the indicator in the same way that Carter does, it would be enough to turn off the ADX, turn on the Squeeze Momentum signals along with the T.T.M. Waves, and importantly, change the Linear Momentum value to 12 (this configuration can be found in his book).
*You can see this setting in the second panel.
Why this indicator?
I've added and removed the above flags as I needed to query them (which became tedious for me). The main objective of having merged them into one is to make their reading more agile and comfortable and thus improve the decision-making capacity of the trader who wishes to use them.
Credits and Acknowledgments:
I would like to give credits to other authors, for the sections of code that I have used to make this technical indicator. Thanks to @LazyBear, @matetaronna, @jombie and @joren for contributing to the community and keeping their code open. It is priceless!
Feel free to combine and practice your trading with both strategies, personally, they improved my profitability and this is why I recommend researching more about them. I've been using it for crypto investing, let me know if it's worth for you on stock market!
If you have any questions or suggestions you can leave it in the comments!
Greetings! Indicador

Indicador
Indicador

Indicador

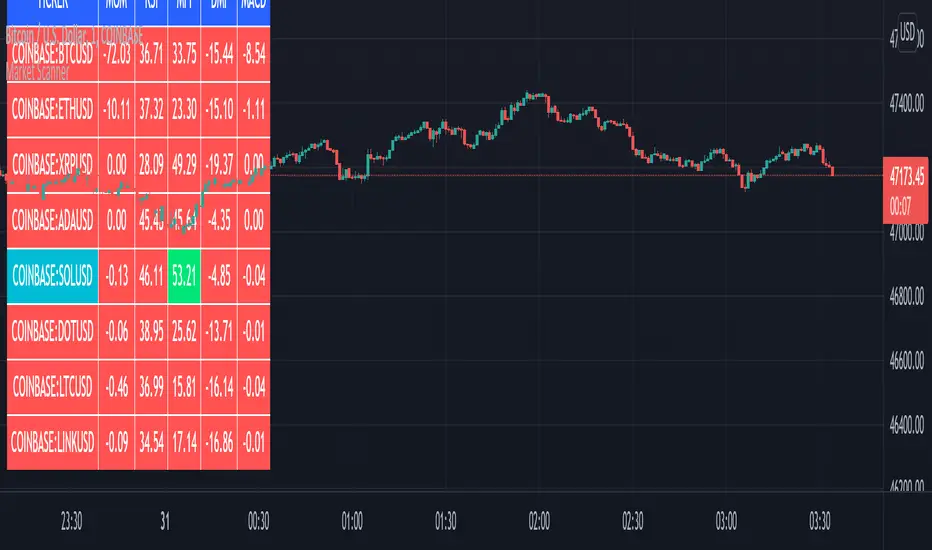
Market Sector Scanner/Screener With MOM + RSI + MFI + DMI + MACDMARKET SECTOR SCANNER/SCREENER MOM + RSI + MFI + DMI + MACD FOR STOCKS CRYPTO & FOREX
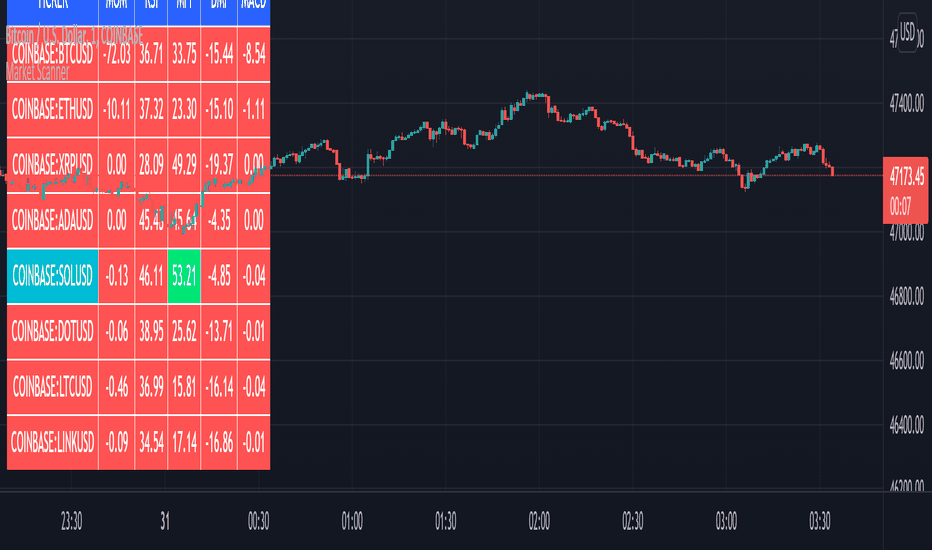
This script scans 9 markets constantly and returns the values of 5 different popular indicators.
This indicator helps you see when one of your favorite stocks is bullish or bearish when you are not watching that chart so you can always catch the big moves as they happen.
***HOW TO USE***
A great way to use this market screener is to set up separate chart layouts for each sector you like to trade. Such as the top 9 stocks in the S & P 500, top 9 stocks in the XLF etf, etc. Make sure to set up separate chart layouts in Tradingview so you don’t have to change the symbols constantly. This will give you a good idea in real time if that entire sector is bullish, bearish or mixed. When the entire grid goes red or green, those are very strong signs of market direction across that entire sector, so trades in the corresponding direction are quite safe.
This can be done for crypto as well, using the top 9 cryptocurrencies by market cap. Watch the grid and wait for the entire lot to turn green or red and then take a position in that direction.
You can also use this with a variety of your favorite tickers so you can see when specific markets are looking strong in either direction, instead of constantly changing charts or missing good opportunities because you weren’t watching that specific chart.
This grid can also be used to determine how long to hold a position as well. If the entire grid is still green or red, according to your trade direction, you can usually expect price to continue in that direction until you see some conflicting colors start to pop up on the grid. As it starts to give mixed signals, you can expect the market to be indecisive or reverse which is a good time to get out.
If you have your scanner setup to show similar markets in one sector, be careful taking trades when the grid is very mixed in color. This shows signs of indecision and will likely have choppy price action until the market decides a direction so make sure to use caution when the grid is mixed. It is best to wait for the entire grid to turn green or red and then take position.
***COLOR MEANINGS***
When each indicator value is in bullish territory, the background of that value will turn green.
When each indicator value is in bearish territory, the background of that value will turn red.
When each indicator value is in neutral territory, the background of that value will turn blue.
When all 5 indicators for a ticker are bullish, the ticker background will turn green.
When all 5 indicators for a ticker are bearish, the ticker background will turn red.
When there is a mixture of bullish and bearish values, the ticker background will turn blue.
***CUSTOMIZATION***
You can customize which tickers are in your scanner including stocks, crypto, futures and forex, the source of the indicators, the length of the indicator settings and the smoothing parameters.
***INDICATORS USED***
The indicators used for each ticker are as follows:
Momentum(MOM) - Default length is 14. Bullish is above zero, bearish is below zero.
Relative Strength Index(RSI) - Default length is 14. Bullish is above 50, bearish is below 50.
Money Flow Index(MFI) - Default length is 14. Bullish is above 50, bearish is below 50.
Directional Movement Index(DMI) - Default length is 14 and smoothing is 14. Calculated by subtracting di minus from di plus. If the value is positive, it is bullish. If the value is negative, it is bearish.
Moving Average Convergence & Divergence(MACD) - Default settings are 12, 26, 9. If the short line is greater than the long line, then it is bullish. If the short line is less than the long line, it is bearish.
***MARKETS***
This market scanner can be used as a signal on all markets, including stocks, crypto, futures and forex.
***TIMEFRAMES***
This scanner can be used on all timeframes and pulls data from other tickers using the same timeframe as what your current chart is set to.
***TIPS***
Try using numerous indicators of ours on your chart so you can instantly see the bullish or bearish trend of multiple indicators in real time without having to analyze the data. Some of our favorites are Trend Friend Scalp & Swing Signals, Auto Fibonacci, Directional Movement Index, Volume Profile With Buy/Sell Pressure, Auto Support And Resistance and Money Flow Index in combination with this Scanner. They all have real time Bullish and Bearish labels as well so you can immediately understand each indicator's trend.
Indicador
Indicador

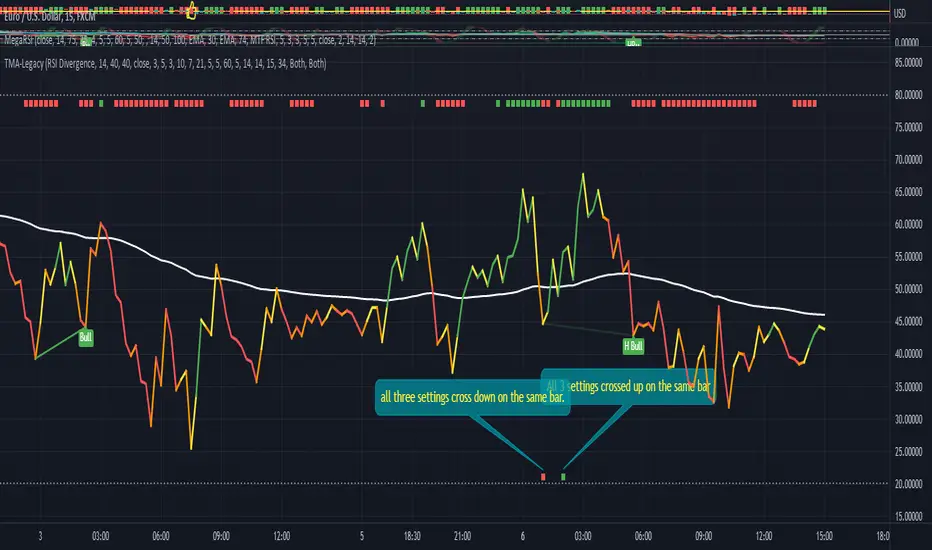
MFI + RSI + MOM With Bull & Bear Trend LabelMOMENTUM + MONEY FLOW INDEX + RELATIVE STRENGTH INDEX WITH BULL & BEAR LABELS
This is a combination of 3 popular indicators. Momentum(MOM), Money Flow Index(MFI) and Relative Strength Index(RSI) along with color changing labels that tell you each indicator's current trend.
The middle white line shows the level that each indicator needs to stay above to be bullish and below for bearish. Watch for all three indicators to cross and hold above or below the mid line for big moves.
It is important to note that these indicators do not need to be going up to be bullish or down to be bearish. They just need to hold above or below the mid line to understand the overall trend.
The momentum indicator is the most relevant in my opinion. If it is holding above the mid line steadily, usually the overall trend will continue upwards so look to buy the dips if the momentum cloud is staying above the white line and vice versa.
It is also important to note that the default settings for this indicator are the 100 period as I find it to be super relevant across most charts but these numbers can be changed in the indicator settings.
Since momentum swings wildly past the normal 0-100 range, it is important to note that the momentum line has been “normalized” to stay within this same range as the rsi and mfi. So if you look at a normal momentum indicator side by side with this indicator it will not look the same however, I find it to be a very good indicator of overall direction so I know the current market sentiment even when price is diverging from the indicator directions.
All of the colors, sources and lengths can be easily customized in the indicator settings input tab.
***HOW TO USE***
When Momentum is above the mid line, it is bullish. When Momentum is below the mid line, it is bearish.
A label on the right side will update in real time to tell you if momentum is Bullish or Bearish for faster recognition of the trend.
When RSI is above the mid line, it is bullish. When Momentum is below the mid line it is bearish.
A label on the right side will update in real time to tell you if RSI is Bullish or Bearish for faster recognition of the trend.
When MFI is above the mid line, it is bullish. When MFI is below the mid line it is bearish.
A label on the right side will update in real time to tell you if MFI is Bullish or Bearish for faster recognition of the trend.
This indicator was built to help you quickly identify the Bullish or Bearish nature of the current trend with a live color changing label so you can glance at the label and understand it's direction without analyzing the indicator data.
***MARKETS***
This indicator can be used as a signal on all markets, including stocks, crypto, futures and forex.
***TIMEFRAMES***
This mom + mfi + rsi indicator can be used on all timeframes.
***TIPS***
Try using numerous indicators of ours on your chart so you can instantly see the bullish or bearish trend of multiple indicators in real time without having to analyze the data. Some of our favorites are our Auto Fibonacci, Directional Movement Index, Volume Profile, Auto Support And Resistance and Money Flow Index in combination with this indicator. They all have real time Bullish and Bearish labels as well so you can immediately understand each indicator's trend.
Indicador

Indicador

Indicador

Indicador

Indicador

RedK Momentum Bars (RedK Mo_Bars)Momentum Bars (Mo_Bars) offers a different way to visualize (relative) momentum - and uses some simple TA concepts to provide a different perspective into how we read momentum changes and incorporate that in our trading.
The idea here (and the script itself) is really super simple, and is (very loosely) inspired by Elder's Impulse System (EIS) - then evolved to leverage some other concepts, and to become less cluttering and "easier to read".
The construction of the Mo_Bars
---------------------------------------------
The base concept utilizes 3 moving average lines :
the first line is a relatively fast MA with a short length - acts as the main price tracking line
the second line is slightly slower than the main line - 2 to 3 bars longer length - and will by default use the open value as source - this works better to identify when the closing price starts to move faster than the open (as in, bars more frequently close higher than they open) - this line acts as the signal line - there's an added setting for an additional delay that utilizes regular WMA smoothing - the delay acts to magnify the relative displacement between the 2 MAs
for both these MA's, i choose to use the RSS MA (Lazy Line) - other MA types can be used, but the reason i used that MA type specifically is that it moves "gracefully" - and 2 Lazy Lines moving together minimizes whipsaws from small price swings - i tested with other MA types and found that the RSS has an advantage there.
the third line is a much slower MA (length 5 to 6 x the fast line) - and acts as a filter or a baseline. When we're above that line, we should favor long positions - we're in bull territory. When we're below that line we favor short positions, and we're in bear territory. Adjust this line as it suits your trading style and time frame.
(I choose to use WMA as the MA type for the filter line .. and there's a good reason for that - which i'll skip for now - but in future versions, we can add other selectable MA types. )
Using Mo_Bars
----------------------------
at a very broad level, we can use Mo_Bars similar to how we use a MACD - both are centered and unrestricted oscillators - note the difference that Mo_Bars is based on 3 MA's rather than 2.
the Mo_Bar bar length reflects the distance between the main MA and the signal MA - plotted relative to the baseline (filter line) - that means that the length of the bar represents the relative momentum between the 2 MA's - The Mo_Bars are then colored in a way that reflects increase or decrease in the value of that momentum (the visual here may have been inspired by another indicator recently published by one of our esteemed wizards - it worked perfectly - so due credits here :)
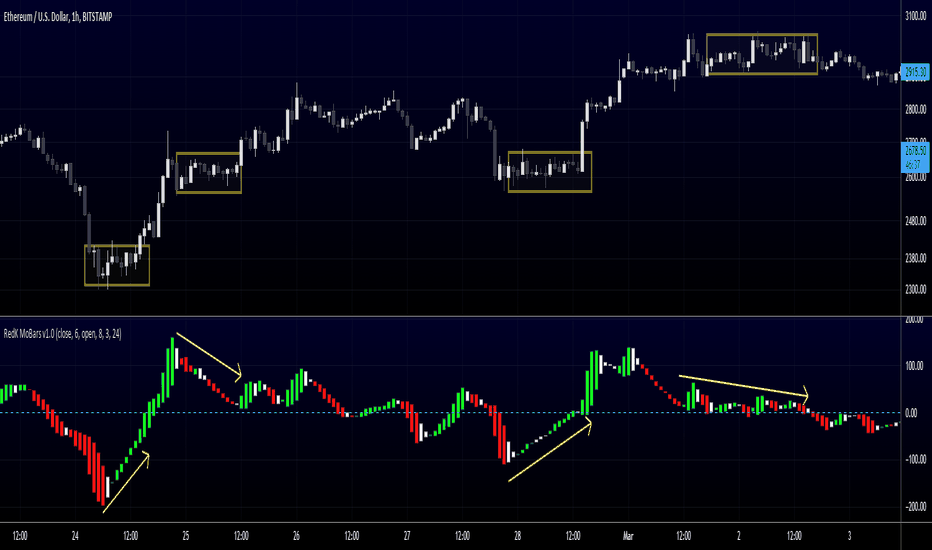
-- in simple terms, if the main MA is below the signal MA, the bar is red - and when the main MA is above the signal MA, the bar is green - a white bar usually shows up when there's a detected change of relative momentum direction (note that this is not the same as the trend direction - and that's what helps show and exploit convergence and divergence - similar to a MACD)
* in the chart above, i noted few examples of how visualizing relative momentum in this way exposes areas of chop (Mo_Bars above zero but are in red or moving down, or when Mo_Bars are below zero and green or moving up) - convergence / divergence with price - and how this can act to expose the possibility of potential changes in price action or trend.
* there's so much more to play around with this setup - and maybe if there's enough interest there can be future dedicated posts on how utilize or even to evolve it further - there's a lot of potential here, to add more filters (maybe volume based), alerts, signals...etc - so let's see the interest :)
Here's the detailed (top chart) setup that Mo_Bars is based on -- The settings for the MA's on the price charts have been matched / sync'ed with the Mo_Bars settings on the lower panel to demonstrate how the script works and how it translate the MA action on the price chart to what we see below.
As always, please play around with the indicator to get used to how it works - use it in tandem with other indicators to get proper confirmations and adjust settings to suit your own trading style, time frame, and instruments
Feedback and thoughts are always welcome --- good luck! Indicador
Indicador

Indicador

Indicador

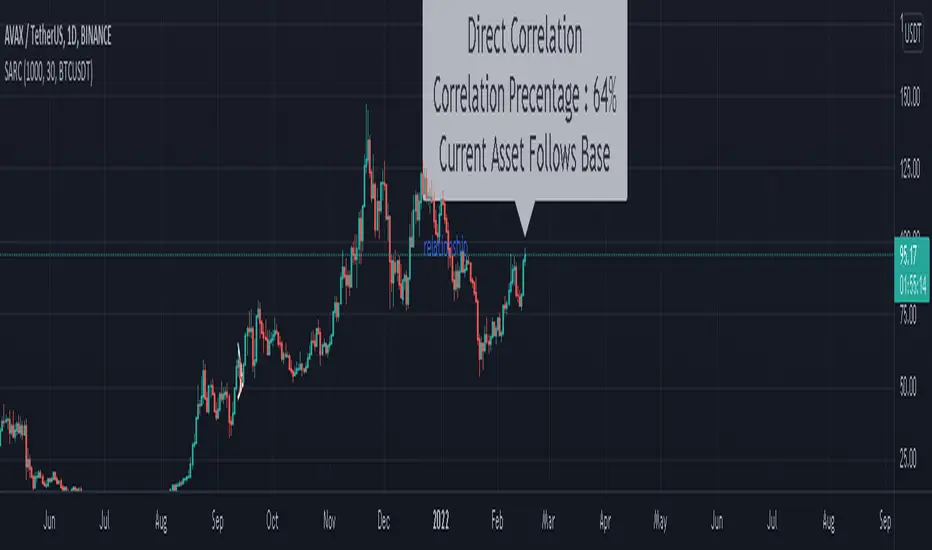
SARCThis indicator aims to indicate the correlation between two assets(Current and Base), it does NOT show entries or help your chart analysis directly.
The main features of this Correlation indicator is :
Correlation type : Direct Correlation | Inverse Correlation | No Correlation
Correlation Percentage : as its name, it calculate the Correlation Percentage between Current and base assets if exist
Correlation Leader : If there is a correlation , it indicates which asset follows the other (Current Asset Follows Base | Base Follows Current Asset)
Correlation bars : if the box (Show Correlation Candles) on the settings was True, it will show GREEN lines above candles which have direct correlation and RED lines above candles which have inverse correlation
How to use: Chose the base asset (default: bitcoin) and open any other chart to be the other -Current- asset
inputs:
Max Lookback length : how many candles will be included in the scan.
Correlation Factor : how stronger the correlation should be to include the candle(E.g. if set to 50, if any candle correlation was less than 50 it will be ignored), If you are confused leave it as its default.
Base Asset : The base asset to calculate the current asset correlation with.
Show Correlation Candles : (True | false) explained above on the main features.
Note: this indicator uses every single candle and compare it to the base same time candle, after some time I will post another similar indicator, BUT the new one will use the whole direction of the assets instead of each candle alone, I hope one of them can help you.
For any notes on the indicator to be edited, or for another indicator ideas please comment.
Indicador

Estrategia

Indicador

Indicador

Indicador

Indicador