TRENDLINE V1Hello all ... this is the source trendline of the three pivots with adjustable resolution and length function to find a breakout or breakdown Indicadorpor nicoakimActualizado 6337
CPR WITH BREAKOUTCPR with 10-30 mins Breakout This indicator includes CPR with 15-30 mins breakout, resistance, support, previous day low, previous day high, day low and day high etc, please backtest before use regards The Malayali Trader Indicadorpor manojmpanicker140
Pivot + 7 EMA + ichimoku [by hot]Pivot, moyenne mobile et ichimoku dans 1 indicateurIndicadorpor Temata987488
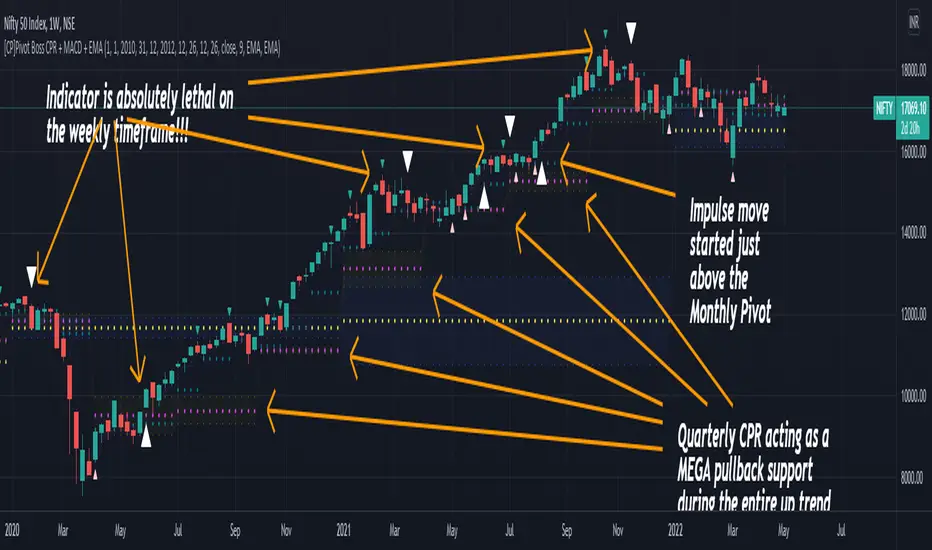
[CP]Pivot Boss Multi Timeframe CPR Inception with MACD and EMAINTRODUCTION: This indicator combines multi-timeframe CPR bands with MACD Momentum and EMA trend, all projected on the candlestick chart through a novel visualization. If you have seen my other indicators on TradingView, you would know that I use floor pivots a lot and “Secrets of a Pivot Boss” is my favorite book. While using floor pivots, time and again I have noticed an interesting price behavior, Trending moves in price typically start from around the Central Pivot Range (CPR). The CPR Indicadorpor pranjalchaubey16619
Pivot Points High Low Multi Time FrameHello All, There are built-in and published Pivot Point High Low indicators in Public Library but as far as I see none of them is for Higher Time frames. so I decided to write & publish this script. I hope it would be useful while trading or developing your own scripts. I also did this to use in one of my future projects (we will see it in a few weeks/months ;) ). I tried to make all settings optional, so you can play with them as you wish. P.S. There is no control mechanism if the chart Indicadorpor LonesomeTheBlueActualizado 106 14.3 K
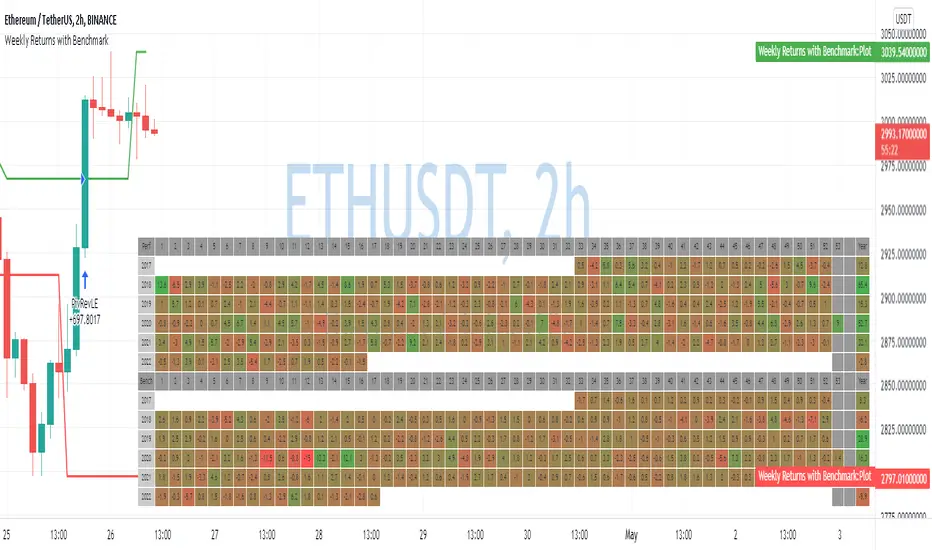
Weekly Returns with BenchmarkSome time ago I published Monthly returns table. Now It's time for weekly one. To get it work you need a pretty big screen, but I hope it will be useful for some of you. Features of this table includes: Display weekly returns of your strategy, benchmark, and alpha over this benchmark. Select benchmark to be another instrument Select the date from which you want to compute monthly returns Show/hide benchmark and alpha Choose colors for gradient for gain/loss values Use it with Estrategiapor QuantNomad13302
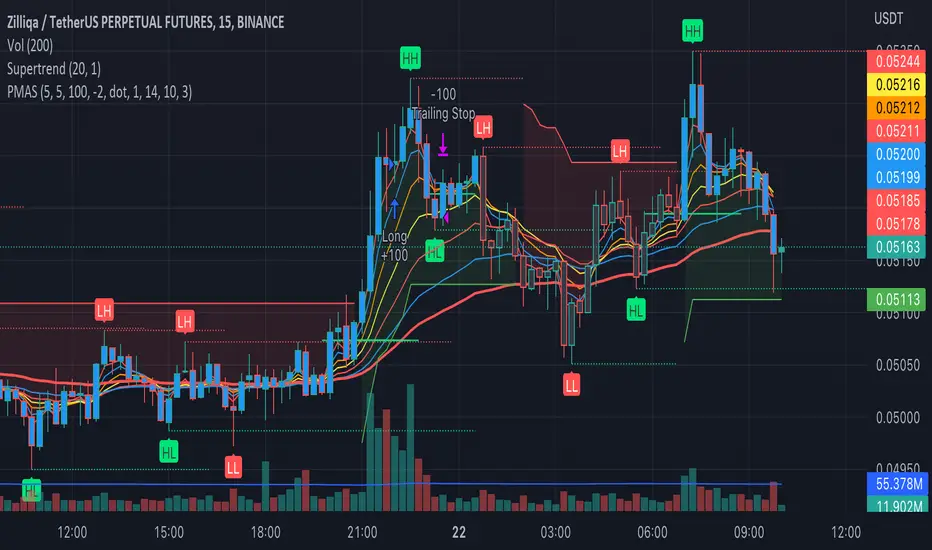
Pivot Moving Average steteggythis Pivot Moving Average steteggy works best on a chart --->>Above 100$ crypto Sniper is very profitable in terms of% good trades It will perform very well on 1-5X Leverage (Solid leverage, not variable depending on the volume ) TP: 0.9 % SL : 5.5 %Estrategiapor prakashbariya333Actualizado 9385
CPR with Developing Pivot RangeThis Developing Pivot Range(DPR) made by Saravanan_Ragavan based on Pivot Boss Developing Pivot Range Concept. This indicator will show how the CPR is developing during the day. Also it shows how trend developing. range fills with green and widening in up trend, wise versa range fills with red and widening in down trend. Pivot Boss described as following about this indicator: The Developing Pivot Range (DPR) indicator dynamically calculates the central pivot range in real time as new data entIndicadorpor R_Saravanan_TE10528
RSI Local TrendA simple indicator using two RSIs. Conditions for buy: RSI(slow) < RSI(fast) and RSI(slow) < long_trigger Conditions for sell: RSI(slow) > RSI(fast) and RSI(slow) > short_trigger It is recommended to use in small timeframes for scalping. Recommended settings: slow = 3 fast = 14 long_trigger = 30 short_trigger = 70 In markets where there is very high volatility, it is recommended to change the trigger parameters: long_trigger = 20 short_trigger = 80Indicadorpor azathatamowActualizado 5192
3EMA + Boullinger + PIVOTTRES EMAS + BANDAS DE BOLLINGER + PIVOTE INDICADOR 1: TRES EMAS (MEDIA MOVIL EXPONENCIAL) Con este indicador puede visualizar el promedio de precios con mayor peso a los datos mas recientes. Se calculan y dibujan tres medias móviles exponenciales: 8, 20 y 200 últimas velas. -Rápida EMA1 = 8 -Media EMA2 = 20 -Lenta EMA 3 = 200 INDICADOR 2: BANDAS DE BOLLINGER Con este indicador podrá ver la fuerza y la tendencia del mercado, es decir la mide la volatilidad del precio del activo. Si el preciIndicadorpor JCMR7615892
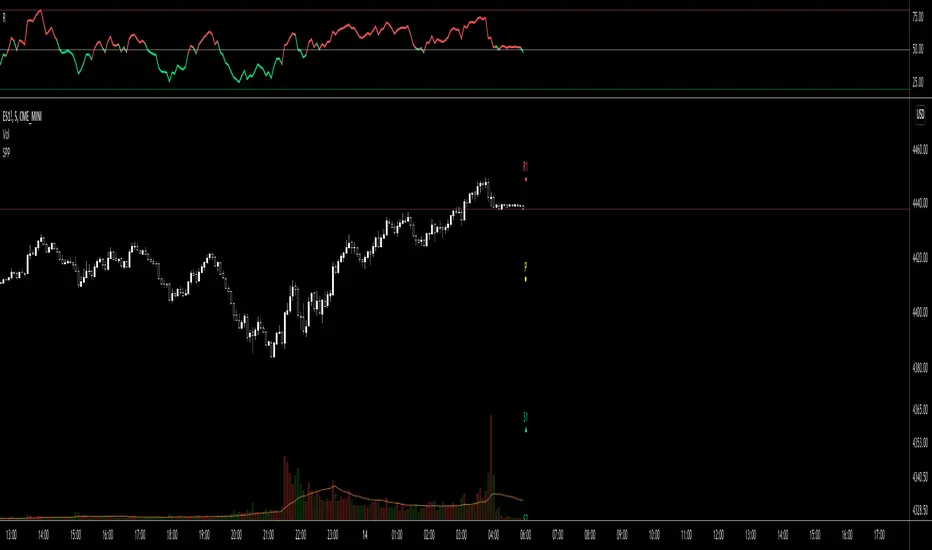
Simple Pivot Points with dots, not lines(automatic setup)1. Why Pivot Point is popular Because unlike most indicators, it's not lagging! It is forward-looking, it's real-time, it's just right there. 2. Why this script is created? I don't like many indicator lines crossing my screen everywhere, just as some Pivot Point indicators did. So I wrote this script to keep my screen as clean/neat as possible. 3. About the other “manual setup” version. I'm a E-mini S&P500 future trader, and I found the close prices on Daily chart is different from the oIndicadorpor yeungshawn88
Simple Pivot Points with dots, not lines(manual setup)1. Why Pivot Point is popular? Because unlike most indicators, it's not lagging! It is forward-looking, it's real-time, it's just right there. 2. Why this script is created? I don't like many indicator lines crossing my screen everywhere, just as some Pivot Point indicators did. So I wrote this script to keep my screen as clean/neat as possible. 3. MUST READ before you add this “manual setup” version to your chart I'm a E-mini S&P500 future trader, and I found the close prices on Daily cIndicadorpor yeungshawn50
Zigzag MatrixNothing fancy. Just converted the new matrix library of zigzags ( mZigzag ) into indicator as I sensed it can be useful as indicator. On top of the standard zigzag, the indicator also tracks given oscillators, moving average and volume indicators on each pivots. More indicators can be added programmatically - but it will take up space in chart. Hence, so far I have only added option to add one per each type (moving average, oscillator and volume) Settings are as below Indicadorpor TrendoscopeActualizado 13799
Bank Zone V2This indicator finds the current price and dynamically plots bank zone levels that's incremented by 50 or 100 pips. Levels are displayed on all time frames and will work for ALL forex pairs and indices. How to use this indicator. Select Pair - Choose a pair that's in your watchlist Increment By - Plots lines in increments of 50 or 100 pips Indicadorpor PhilWill167Actualizado 9510
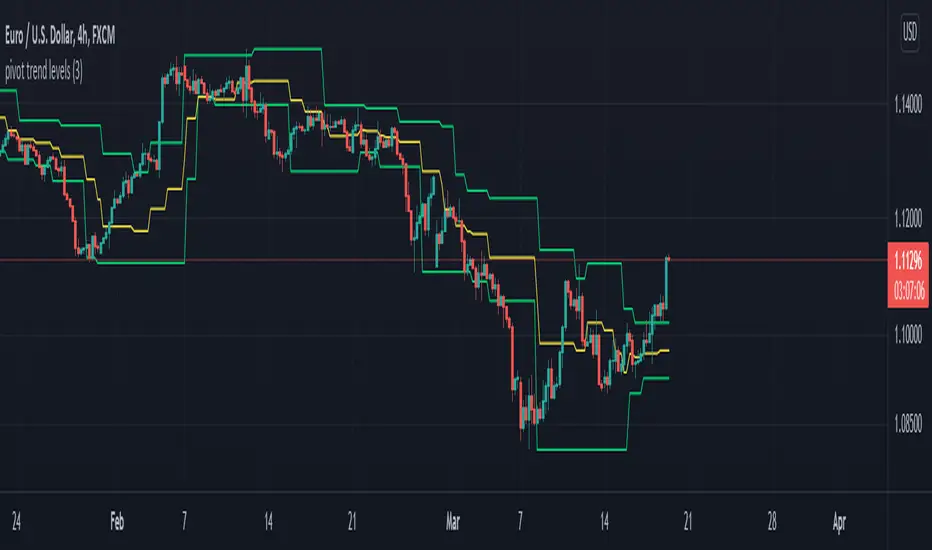
Pivot Trend LevelsYou can use this indicator to detect the levels and trend. I used the highest of the two last highest pivots and the lowest of the two last lowest pivots to calculate "max" and "min" or high level or low level. I also calculate the average of the 4 values to reach the average line which could be a trend detector in higher lengths. Default length is 3 but using 10 or 20 as length is really good as trending detector. I need help to upgrade a trend detector system. please read the script for moIndicadorpor AliSignals2167
[GarufiCommunity] Multi Indicator: VWAPs, MA, Pivot PointsThis script provides a collection of indicators to help traders look at multiple trends while maintaining a consistent configuration, even when jumping around different timeframes and symbols. Additionally, this collection is particularly useful when trading decisions involve looking at dozens of indicators and analyzing, in aggregate, their confluence. With this collection of indicators you can configure anchored VWAPs, MA, and Pivot Points: - Anchored VWAPs: For each you define a fixed timeIndicadorpor rafael.ulhoaActualizado 3203
SuperTrendSHey! By using this script you can choose between the Regular SuperTrend and Pivot Point SuperTrend. Pivot Point SuperTrend differs in calculation from the regular SuperTrend and as the name suggests, Pivot Points are used instead of ATR. I made this script to make it easier to switch and compare between one another. Also included Jurik RSX as a Momentum Indicator. SuperTrend changes color to purple when it's a bear trend and RSX is in an overbought state. And orange when it's a bull trend Indicadorpor lucidreamer15Actualizado 636
Pivot Based Trailing Maxima & Minima [LuxAlgo]This indicator returns trailing maximums/minimums and the resulting average, each resetting on the occurrence of a pivot point high/low, thus allowing to highlight past and current support and resistance levels. Note that the user has the option to make the indicator subject to backpainting or not. Backpainting would offset the indicator output to the past and as such would be less suited for real-time applications. 🔶 USAGE 🔹 Non Backpainting The indicator can highlight points of supIndicadorpor LuxAlgoActualizado 118 8.3 K
Nareshraju CPRHi friends this is Cpr indicator which means central pivot range. it contains supports and resistances to take perfect entry.Indicadorpor Nareshraju7132
ORB with Price TargetsThe ORB with Price Targets Script will display the Opening Range (15 minutes of the open session by default) High and Low. It will then render upper and 2 lower Price Target Levels based on 50% and 100% profit targets of the Opening Range. The opening range is customizable in the settings, where you can choose from 5 minute, 15 minute, or 30 minute Opening Ranges. Many stock tickers tend to follow the Opening Range, and sees continuation after a break of that range. This is a common strategy uIndicadorpor getthatcashmoneyActualizado 78 4.4 K
Pivot Support/ResistanceThis indicator displays immediate Pivot Highs/Lows compared to the current price as lines on the chart. It can be useful to identify support/resistance.Indicadorpor ncy12Actualizado 132
Camarilla Pivot Points L3/4 D/W with Labels AlertsThis version of the camarilla pivot points will provide daily or weekly S3, S4, R3 and R4 Levels. This release is intended to help you declutter your charts by not having too many lines but still getting the benefit of clearly seeing where the key camarilla levels are, which can help with identifying market structure and potential market extremes. It has the option to show or hide the lines to help unclutter your charts. The lines can also be hidden by the user line transparency input, in whichIndicadorpor mobester16Actualizado 3432
Bias Pivot PointA simple indicator that uses Pivot Points as a filter and to generate a Directional Bias . How to use this indicator? 1. Directional Bias Bullish => Closing Price > Pivot Point Bearish => Closing Price < Pivot Point 2. Support / Resistance Each Pivot Points can be used as Support or Resistance 3. Take Profit Targets Each Pivot Points can be used as targets for taking profitIndicadorpor Botnet1017 1.8 K