Lorentzian Classifier AI - Prediction Accuracy [Dots3Red]🧭 LORENTZIAN CLASSIFIER AI - PREDICTION ACCURACY TRACKER
Lorentzian distance is a way of measuring how similar two market states are that doesn't let a single outlier feature dominate the comparison. This script uses it to find historical moments that genuinely resembled right now, has them vote on direction — and then keeps an honest, running record of whether those votes have actually been right.
✨ WHY THIS MATTERS
Most similarity-based classifiers measure "how alike" two moments are using plain squared differences — the market equivalent of a ruler. The problem: if one feature briefly spikes (a volatility burst, a momentum blow-off), a ruler-based measurement can wrongly flag two genuinely similar moments as very different, just because of that one temporary outlier.
Lorentzian distance compresses that effect. Two market states that matched closely overall still get recognized as similar, even when one feature happened to spike on one of them. The practical result is a comparison method that's less easily fooled by noise.
📊 Accuracy: 58% (n=214)
It's a scoreboard. Out of 214 predictions this classifier has made on this specific chart, 58% turned out correct. It updates continuously as more predictions resolve.
⚙️ HOW IT WORKS
📐 Four features — RSI, CCI, a directional strength measure (from DMI), and a momentum reading (ROC), each normalized to a comparable scale. Every bar's combination of these four values is treated as a "market state."
🔍 Lorentzian comparison — instead of squared Euclidean distance, similarity between the current state and every past state is measured using log-space differences: log(1 + |difference|) per feature, summed. This is the mechanism that reduces the influence of any single feature being temporarily far apart.
🗳️ K-nearest-neighbor vote — the most similar historical states (configurable count) vote on what happened next: did price rise or fall over the following bars? The vote split becomes the current lean, shown as a percentage.
🎯 Rolling, honest grading — every prediction is stored at the exact moment it's made and only graded once its outcome window has fully closed, using the vote as it stood at that time — never recalculated afterward with the benefit of hindsight. This is what makes the accuracy stat trustworthy rather than circular.
🔒 Non-repainting — predictions and their grading both happen strictly on confirmed bars.
🧭 HOW TO USE
1️⃣ Wait for the training sample to build. Early on a fresh chart, the dashboard shows "Training…" instead of a vote — the classifier needs a real base of past states before comparisons mean anything.
2️⃣ Check the Accuracy stat before weighting any single vote. A 65% accuracy over 200+ predictions is meaningfully different from 65% over 15 — the sample size tells you how much to trust the number itself.
3️⃣ Use Min Vote Confidence to filter noise. Labels only appear when the vote split is sufficiently lopsided (60%+ by default) — a near-coin-flip 52% lean isn't flagged, since that's not a meaningful signal either direction.
4️⃣ Treat the vote as a lean, not a forecast. It's an answer to "what happened after similar past moments," not a guarantee about this specific one.
5️⃣ Let the accuracy stat itself guide your confidence in the tool. If it's tracking meaningfully above 50% over a large sample, the method is finding something real on this chart. If it's hovering near 50%, that's honest information too — this particular market state may not carry much predictive signal here.
⏱️ WHICH TIMEFRAMES WORK BEST
This method needs a genuinely large history of past market states to compare against, which makes 15-minute through 4-hour the most effective range.
On very short timeframes (1-3 minute), the training sample grows quickly, but each individual state is closer to noise — indicator readings barely settle before the next bar arrives. On daily or higher timeframes, the states themselves are more meaningful, but building even a modest training sample takes considerably longer in real time. 15-minute to 4-hour balances the two: enough distinct market conditions cycle through regularly to build a genuine sample within a reasonable window, while each state still reflects settled, meaningful market behavior.
🛠️ SETTINGS
📐 Features — independent lengths for RSI, CCI, DMI, and ROC
📊 Lorentzian Engine
• Prediction Horizon — how many bars ahead each prediction looks, and the outcome used to grade it
• K Neighbors — how many similar past states vote on the current one
• Max / Min Training Samples — memory cap and the minimum before votes display
• Min Vote Confidence to Signal — how lopsided the vote must be before a label appears
🎨 Visualization — prediction labels, optional background tint by current lean, independent bullish/bearish colors
🖥️ Dashboard — show/hide, position — current vote split, training sample progress, accuracy with sample size, prediction horizon, and K neighbor count
📝 NOTES
The accuracy stat is specific to this chart, this timeframe, and these settings — it does not transfer to other instruments or configurations. A classifier that performs well on one chart may perform differently on another; the honest way to know is to let it run and check the accuracy stat for the specific setup you're using.
⚠️ DISCLAIMER
This is an analytical and visualization tool. It does not generate trade signals and does not constitute financial advice. Historical prediction accuracy does not guarantee future performance. Indicador

Momentum Rotor | Basket Breakout & Leadership RotationWhat it does
Momentum Rotor ranks a basket of correlated symbols (default: AAPL, MSFT, NVDA, GOOGL, AMZN, META, TSLA, AVGO — fully user-editable) by N-bar rate-of-change momentum, recalculated every bar via request.security(). It only opens a long position on the chart's own symbol when that symbol is simultaneously the strongest performer in the basket (rank #1 by momentum) and breaking its own N-bar price high. If the held symbol later loses the #1 rank to another basket member, the strategy closes the position — it "rotates out" of a fading leader rather than holding through a reversal.
Core features
Live leaderboard table — ranks the full basket by momentum every bar, with gradient-colored scores and trend glyphs (↑/↓) so you can see who's strengthening or fading at a glance
Regime/leadership dashboard — shows your symbol's current rank, how many bars the leader has held the top spot, and basket-wide breadth (% of symbols with positive momentum) as a quick risk-on/risk-off gauge
Risk-based position sizing — position size is calculated from a fixed % of equity risked against an ATR-based stop distance, not a fixed share count
ATR stop + R-multiple take-profit — stop distance and profit target both scale with volatility instead of using static price offsets
Optional rotation-confirmation filter — require the leader to lose #1 rank for N consecutive bars before exiting, to reduce whipsaw from brief rank flickers
Optional regime filter — require price above a long SMA before taking new entries, to avoid trading breakouts in a broader downtrend
Realistic backtest defaults — includes commission, slippage, and margin settings out of the box rather than assuming frictionless, infinite-leverage fills
How the strategy works
Each bar, the script pulls the N-bar ROC (rate of change) for every symbol in the basket and sorts them from strongest to weakest. Your chart's symbol only becomes eligible to trade when it holds rank #1 and closes above its own N-bar high — combining a relative-strength filter with an absolute breakout trigger, so entries require both "stronger than its peers" and "breaking out on its own chart" to align. Exits are twofold: an ATR stop/target pair from the entry, and a rotation exit that closes the trade the moment (or, with the confirmation filter on, N bars after) another basket member overtakes it in the momentum ranking.
What makes it distinct
Most retail breakout scripts evaluate a single symbol in isolation. Momentum Rotor brings relative-strength rotation — a concept used by institutional sector/factor rotation strategies — into a single-chart script by polling an entire basket with request.security() and gating trade eligibility on relative rank, not just absolute price action. The live leaderboard turns that ranking process into something visible and auditable on the chart itself, rather than a black-box filter.
Tips for use
Chart the strategy on one of the basket's own symbols (or add your target symbol to the basket inputs) — the "am I #1" check only works when your chart's ticker matches a basket entry
This instance only manages a position on its own chart's symbol; it does not automatically route orders to whichever symbol becomes the new leader. To rotate capital across the whole basket, run separate instances on each symbol
Momentum/breakout systems are inherently prone to false breakouts and whipsaws in choppy markets — the optional regime filter and rotation-confirmation delay are there to dampen that; test both on/off for your instrument and timeframe
Sector ETFs (lower dispersion, steadier trends) and mega-cap tech names (higher dispersion, sharper momentum swings) behave differently in this framework — adjust lenMom/lenBreak accordingly
Backtest results depend heavily on commission, slippage, and margin assumptions set in Properties — review and adjust these to match your actual broker before drawing conclusions
Limitations
This is an educational strategy template, not a production-ready system or financial advice. It has not been optimized or validated for any specific instrument, timeframe, or market regime. Past performance in this backtest does not indicate future results. Estrategia

Estrategia

Participation-Adjusted Momentum [TradeDots]Participation-Adjusted Momentum
Summary
This indicator computes a momentum oscillator that has been adjusted by participation quality . Raw momentum (standardized rate-of-change) is multiplied by a quality blend derived from volume percentile, close-location alignment within the bar, and range-per-volume efficiency. The intent is to differentiate strong momentum supported by participation from moves that look impressive on price alone but occur on thin volume or wide ranges with little net travel. The histogram is colored by one of five interpretable states (Strong Bull, Strong Bear, Thin, Quiet Accumulation, Noisy) so users see at a glance whether to trust a momentum reading.
What is original here
Momentum oscillators (rate-of-change, MACD, RSI) and volume oscillators (volume percentile, MFI) are widely available. This script's contribution is the deliberate combination into a single adjusted reading, plus the five-state classification that maps raw-momentum / participation combinations to labelled regimes. The "Quiet Accumulation" state (low momentum but rising volume percentile) and the "Thin" state (strong momentum but low participation) are specifically called out because they are the most actionable readings — both indicate that the price reading and the order-flow reading disagree, and that disagreement deserves a label.
How it works
Each bar, the following quantities are computed.
Raw momentum. Rate-of-change of close over a configurable length, then z-scored (subtract the mean, divide by the standard deviation) over the normalization lookback. The result is approximately bounded but can exceed plus or minus 3 in extreme moves.
EMA slope. A 50-period EMA's change over a configurable lookback, min-max normalized to 0-100. Used as a secondary directional bias (computed and exposed as a hidden plot, but not directly added to the displayed oscillator).
Volume percentile. Volume rank over the normalization lookback (typically 100 bars).
Close-location value. Where the close sits within the bar's high-low range, expressed as a percentage. For an upward-direction reading, a close near the bar's high indicates buyers won the bar; for a downward-direction reading, a close near the bar's low indicates sellers won.
Participation. Volume percentile (divided by 100) multiplied by direction-aligned close-location value (also normalized to 0-1). Result is in ; higher means "good participation".
Range per volume. Bar range divided by volume. High range per volume means a wide candle moved on thin flow — typical of news spikes, illiquid prints, or false moves. The percentile rank of range-per-volume is inverted (low range-per-volume gives a high "efficiency score") and used as a quality factor.
Quality blend. A weighted combination: 0.4 * participation + 0.4 * range_efficiency + 0.2. The +0.2 floor ensures that even with zero participation and zero efficiency, the adjusted momentum retains 20% of the raw signal so the oscillator does not flatline completely.
Adjusted momentum = raw momentum × quality blend.
State classification (mutually exclusive):
Strong Bull : raw momentum at or above +threshold and participation at or above 0.55
Strong Bear : raw momentum at or below −threshold and participation at or above 0.55
Thin : absolute raw momentum at or above threshold and participation below 0.35 — momentum without volume, a warning state
Quiet Accumulation : absolute raw momentum below the quiet threshold and volume percentile above the quiet-volume floor — flat price but rising participation
Noisy / Low Quality : the catch-all when none of the above apply
The histogram bar color reflects the current state.
Repainting and data integrity
All factors are computed on confirmed bar values; alerts are gated by barstate.isconfirmed. No request.security() calls are made — the script operates entirely on the chart timeframe.
How to read the chart
The primary plot is the adjusted-momentum histogram, colored by state.
A thin overlay line shows the same value with continuous color for easy zero-line reading.
Reference lines at zero and at ±1 standard deviation provide context for how extreme the current reading is.
Hidden plots expose raw momentum, participation, volume percentile, and direction so they are available in the Data Window.
The dashboard panel shows the current state in the header, then numeric readings for raw momentum (in z-units), adjusted momentum, volume percentile, participation, range efficiency, and the quality blend.
Inputs
Inputs are grouped into three sections.
Core Settings : ROC length, percentile / z-score lookback, EMA slope length, slope lookback bars, strong-momentum z-threshold, quiet-accumulation maximum z, quiet-accumulation minimum volume percentile.
Visual Settings : zero-line toggle, ±1σ band toggle, dashboard toggle, panel position and size, panel background color.
Any Alert() function call conditions : per-alert toggles.
Alerts
Four alert conditions are provided, each firing on the first bar the state is entered:
Strong Bull Momentum
Strong Bear Momentum
Quiet Accumulation Detected
Momentum Without Volume (the "Thin" warning state)
Each is declared via alertcondition() and is fired programmatically through alert() when the corresponding input toggle is enabled, with alert.freq_once_per_bar_close. Alert messages include {{ticker}} and {{interval}} placeholders.
How to use this script
This is a confirmation indicator. It does not generate entries on its own.
When considering an entry on price strength alone, check this indicator. A Strong Bull or Strong Bear state confirms that volume and close location support the move.
The "Thin" state is a warning. A breakout that prints during a Thin reading should be treated more cautiously than the same breakout during Strong Bull.
The Quiet Accumulation state can identify periods of base-building before a move and is useful as a "watchlist" signal.
Use alongside a setup-specific indicator for entry timing.
Limitations and honest caveats
Volume quality varies dramatically between markets. On crypto exchanges, wash-trading and bot-driven order flow can produce misleading volume percentile readings. Apply with awareness.
Z-score normalization requires the lookback to contain a representative variety of states. On instruments with strong regime changes, early-bar z-scores may be unreliable until the lookback fills.
The close-location alignment factor reads single-bar close behavior. On gappy markets or after market closes, the alignment may not reflect intraday order flow.
The script does not signal direction independently; it adjusts and labels momentum that is already present.
The +0.2 floor in the quality blend is a design choice to avoid flat-lining the oscillator. Users who want a strict "zero adjustment when participation is zero" reading can set the participation weights higher and adjust the floor by modifying the source code.
Disclaimer
This script is published for informational and educational purposes. It is not investment advice and is not a recommendation to buy or sell any instrument. Adjusted momentum is a descriptive measure, not a prediction of future price. Users are solely responsible for their own trading decisions and risk management.
Indicador

Indicador
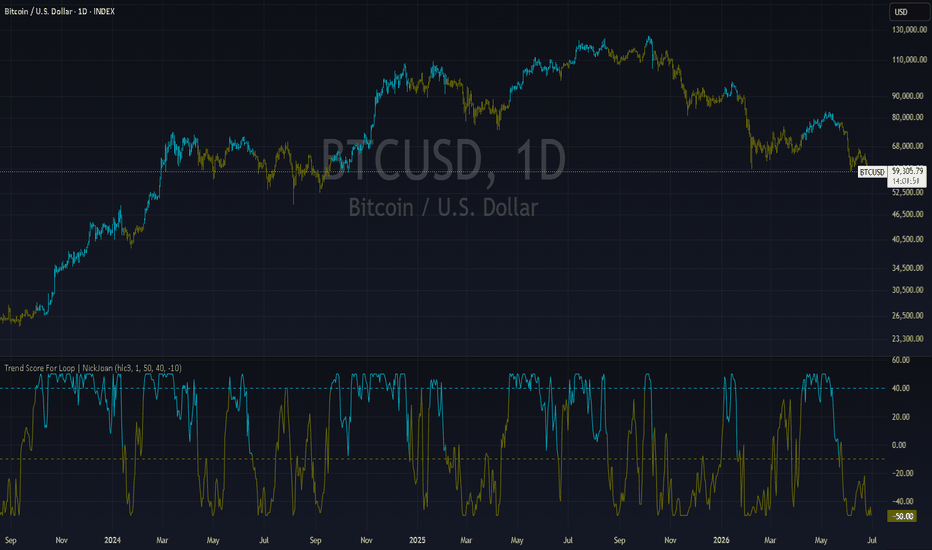
Indicador

Sector Power & Market RegimeThe Sector Power & Market Regime Indicator is a multi-asset dashboard designed to quantify market dynamics through the lens of volatility-adjusted momentum. Unlike standard price-action indicators, this tool uses statistical normalization to compare the 11 major S&P 500 sectors, a benchmark (SPY), and custom equities on a leveled playing field.
1. The Rationale: Quantifying Market Behavior
The core philosophy of this indicator is that markets do not just move "up" or "down"—they move through different behavioral archetypes.
Statistical Normalization: By utilizing a Z-Score Window (defaulted to 252 days, or one trading year), the script calculates how an asset’s current performance deviates from its historical mean
. This allows a high-volatility sector like Technology (XLK) to be compared directly to a lower-volatility sector like Utilities (XLU)
.
Volatility Adjusted Momentum: By dividing price momentum (ROC) by the asset's current volatility (ATR), the script ensures that a high-volatility stock doesn't automatically look "stronger" than a stable one. It measures how much an asset is moving relative to its typical daily range.
Z-Scored X-Axis: This ROC/ATR value is then Z-scored over a 252-bar window (one trading year)
. This identifies how many standard deviations the current volatility-adjusted momentum is from its one-year mean.
Volatility Disorder (Z-Scored TR Dispersion):
The script evaluates the standard deviation of True Range relative to average True Range, then z-scores that value over the historical window. This quantifies how unusually dispersed or unstable volatility is versus the asset’s normal behavior, allowing the indicator to distinguish between smooth/trending price action and noisy/chaotic conditions.
. It essentially asks: Is this move backed by sustainable strength, or is it becoming dangerously erratic?
2. Understanding the Four Market States
The indicator categorizes every asset into one of four color-coded regimes
:
Efficient (Green): Characterized by strong, steady momentum with manageable volatility. This represents a healthy, sustainable trend where trend-following strategies typically thrive.
Explosive (Red): This state occurs during high-velocity breakouts or parabolic moves. While highly profitable, these are often "hot" zones that require active trade management.
Chaotic (Orange): Signals high volatility or trend exhaustion. Price action is often unpredictable here, suggesting a "hands-off" approach or a transition to a different regime.
Stable (Blue): Indicates consolidation or low-volatility environments. These are "quiet" periods where the asset is building energy for its next major move.
3. Key Metrics: Power & Age
Power (X-Value): This is the numerical strength of the asset
. A higher number indicates stronger relative momentum. Traders use this to rank sectors from strongest to weakest at a single glance.
Age (d): This tracks how many bars (days) the asset has remained in its current state
.
Fresh Trends: An asset in the Efficient state with an age of "2d" suggests a brand-new trend.
Overextended Trends: An asset in the Explosive state with an age of "20d" suggests the move may be nearing a climax.
--------------------------------------------------------------------------------
How to Use This in Your Trading Strategy
A. Alpha Generation (Relative Strength) Compare your Custom Stocks to the SPY benchmark
. If SPY is in a "Stable" (Blue) state but your stock is "Efficient" (Green) with higher "Power," your stock is showing significant relative strength and is a prime candidate for a long position.
B. Sector movement Tracking Monitor the 11 sectors to see where "Big Money" is moving
. If you see the "Defensive" sectors (XLU, XLP, XLV) moving into Efficient states while "Growth" sectors (XLK, XLY) move into Chaotic states, it is a strong signal of a defensive market shift.
C. Risk Management & Exit Timing The "Age" metric is your primary tool for timing exits
. If a sector you are holding moves from Efficient to Chaotic or stays in Explosive for an extended period, the "Age" will alert you that the trend is maturing, signaling it may be time to trail your stops tighter or harvest profits.
D. Customization Traders can input their own specific watchlist (e.g., MU, STX, BIIB) to see exactly how their personal portfolio is performing relative to the broader market sectors Indicador

ROC Regime Filter [HYPR-run]DESCRIPTION:
A reliable universal regime filter across all assets, all timeframes. Rate of change filter that classifies price action into regime states. A suite of smoothed EMAs feeds a layered ROC engine that detects when fast momentum aligns with, or diverges from, slow structure. The filter measures; it doesn't predict. When all ROC layers stack in the same direction (parallel alignment), the trend is confirmed by arithmetic. When fast ROC diverges from slow, the regime shifts. The lag is the cost of certainty. Sweet spot is 1hr to 1D; lower timeframes get noisy.
DISCOVERING EDGE
In order to gain a persistent, mechanical edge in which trades are permitted and which are filtered out, we explored a more meaningful expression of regime classification using layered multiple ROC periods to detect when fast momentum aligns with or diverges from slow structure. This resilient regime filter has been the backbone for our automated strategies since 2021.
LAYERED ROC vs SINGLE-INDICATOR REGIME
A single RSI or ADX reading flattens the market into binary (trending/not trending). Layered ROC alignment separates six distinct states, each with different permissible trade types, so the filter matches the complexity of what the market is actually doing. Six regime states gate every decision; the combination of regime color + ROC slope is the trade filter, not either one alone. Phase transitions (green to yellow, orange to green) are the actionable signals; static states just confirm what's already happening. Webhook alerts fire on macro pivots (accumulation/distribution inflections) at the regime transition, not after the move has run.
FEATURES
- Six regime states from layered ROC alignment (see color legend below)
- Early trend detection when all layers accelerate in parallel
- ROC 200 line with regime-colored gradient fill
- Macro pivot detection: strong trend exhausting into sideways, scored by where ROC 200 sits relative to its all-time range
- Accumulation/distribution context in dashboard
- ROC 200 pivot high/low divergence markers on main chart
- Consolidation markers with conviction scoring (normal vs extreme)
- Gradient candle overlay (ROC Sticks; toggle on/off)
- Two-row dashboard: row 1 = macro context (accumulation/distribution), row 2 = current regime state with directional qualifier and slope
- Dashboard dark/light theme toggle for any chart background
- Full ROC stack in data window for manual analysis
- Webhook alerts on macro pivots (accumulation/distribution)
HOW IT WORKS
ROC alignment is the core signal. When all layers stack in the same direction, that's strong trend territory (green). When fast ROC diverges from the slower layers while slow structure still holds, the engine reclassifies from strong trend to sideways (yellow), flagging a pullback rather than trend failure. Deeper corrections where intermediate layers fall below the structural anchor fire orange, indicating a correction within the primary trend. Macro pivots fire at the inflection: strong trend exhausting into sideways for the first time. The consolidation score layers this with where ROC 200 sits in its all-time range. Consolidation at extreme ROC readings (bright green/red dots) is the highest-conviction signal for reversal.
HOW TO USE
Read the regime color, not the price. Green = strong trend long, red = strong trend short, orange = deeper correction, yellow = short pullback, white = directionless. Use regimes as a directional gate: longs during green, shorts during red. Yellow flags a pullback within trend; wait for resolution back to green/red before re-entering. Orange is a deeper correction; patience or fade with confirmation from other tools. The highest-edge signals come from regime transitions, not static states. Watch for: green breaking into yellow (macro pivot, potential reversal), extended yellow resolving back to green (continuation re-entry), and the ROC slope within a regime (slope rising in orange = trend about to resume). The data window shows the full ROC stack across all layers. When fast ROC diverges from slow, that signals continuation or reversion.
MACRO CONTEXT (Dashboard Row 1)
REGIME COLOR LEGEND (Dashboard Row 2)
ALERTS
Macro pivot long fires when accumulation is detected (bull inflection). Macro pivot short fires when distribution is detected (bear inflection). Create alert: condition = this indicator, "Any alert() function call". Paste your webhook URL, set Open-ended, create. Alert payload is built into the script; works with any webhook receiver.
CREDITS
Advance/Decline gradient function: LucF Indicador

Volatility-Adjusted Rate of Change [QuantAlgo]🟢 Overview
The Volatility-Adjusted Rate of Change (VA-ROC) is a momentum oscillator that normalizes price changes against current market volatility, helping traders identify meaningful momentum shifts, spot overbought/oversold extremes, and filter out noise caused by changing volatility regimes. By measuring how large a price move is relative to what's normal for the instrument, this indicator reveals genuine directional pressure that raw momentum readings often obscure.
🟢 How It Works
The indicator begins by calculating the single-bar price change and dividing it by the Average True Range over a configurable lookback period. This normalization step ensures that the same oscillator reading carries equal significance whether applied to a low-volatility blue chip or a highly volatile cryptocurrency, a concept absent from traditional rate of change indicators.
price_momentum = ta.change(close) / ta.atr(atr_length)
When price rises by an amount that is large relative to recent volatility, the normalized momentum produces a strong positive reading. Conversely, a decline that is modest in absolute terms but significant relative to the current ATR environment will register appropriately. This volatility-adjustment prevents the oscillator from generating inflated signals during high-volatility regimes or muted signals during quiet markets.
A sensitivity multiplier then scales the normalized value, allowing traders to compress or amplify the oscillator's range to suit their instrument and timeframe:
va_roc = calc_ma(price_momentum * sensitivity, ma_length, ma_type)
The scaled momentum is then smoothed using a configurable moving average (supporting SMA, EMA, WMA, RMA, HMA, VWMA, DEMA, and TEMA), which filters bar-to-bar noise while preserving the shape of genuine momentum waves. The smoothed output is the final VA-ROC value, plotted against a system of four threshold levels that define bullish, bearish, neutral, and extreme zones.
Momentum state is determined by the oscillator's position relative to these thresholds:
is_bullish = va_roc > upper_threshold
is_bearish = va_roc < lower_threshold
Crossings into bullish or bearish territory, zero-line crosses, and entries into extreme zones each generate distinct signals and corresponding alerts.
🟢 Key Features
The indicator is built around a threshold-based momentum framework with gradient-colored visualization, preset configurations, and a full alert system, all designed to give traders immediate clarity on momentum conditions without manual tuning.
1. Volatility Normalization: Unlike traditional ROC or momentum oscillators that produce raw price differences, VA-ROC divides every price change by the ATR, creating a dimensionless reading that remains consistent across instruments, timeframes, and volatility regimes. A reading of +1.0 always means "price moved one ATR's worth in a single bar", whether you're trading forex, equities, or crypto. This eliminates the need to recalibrate threshold levels when switching between assets.
2. Adaptive Threshold Zones: Four configurable levels (Upper Extreme, Upper Threshold, Lower Threshold, and Lower Extreme) divide the oscillator into five distinct momentum zones. The neutral zone between the upper and lower thresholds represents normal market fluctuation. Crossings above the upper threshold confirm bullish momentum, while crossings below the lower threshold confirm bearish momentum. The extreme levels mark climactic conditions where momentum is unusually powerful, often coinciding with exhaustion points or the early stages of a strong trend continuation.
3. Preset Configurations: Three built-in presets automatically optimize the sensitivity, ATR lookback, MA type, and smoothing length for different trading styles. Default provides balanced readings suited for swing trading on 4H and daily charts. Fast Response amplifies small moves with minimal smoothing for intraday scalping. Smooth Trend compresses the oscillator and applies heavier smoothing to highlight only significant directional moves for position trading.
4. Built-in Alert System: Comprehensive alerts covering all key momentum events, including bullish and bearish momentum confirmation, zero-line crossovers in both directions, and entries into upper and lower extreme zones. A combined momentum direction change alert is also included. All alerts carry exchange, ticker, and interval placeholders for seamless integration with notification workflows.
5. Visual Customization: Choose from 5 color presets (Classic, Aqua, Cosmic, Cyber, Neon) or create a fully custom color scheme using individual bullish, bearish, and neutral color pickers. Optional price bar coloring overlays the oscillator's momentum colors directly onto your main chart candles, tinting bars bullish or bearish based on the current threshold state while leaving neutral bars uncolored, providing instant trend confirmation without switching panels.
Indicador

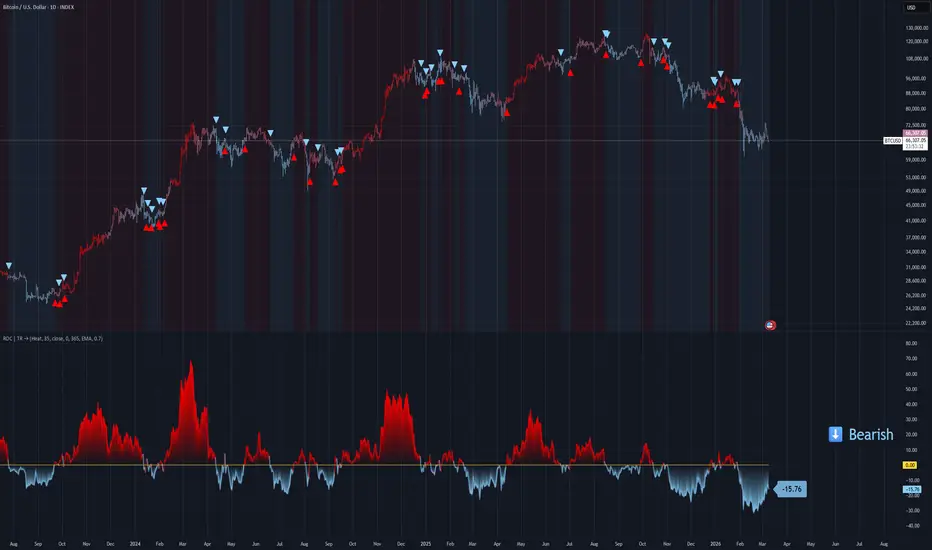
Rate of Change - ROC | TR🎯 Overview
Rate of Change - ROC | TR is a classic momentum oscillator that measures the percentage change in price over a specified period. Developed by Tiagorocha1989, this enhanced version of the traditional Rate of Change indicator offers dual-mode operation with moving average customization and comprehensive visual features, helping traders identify the speed of price movements, momentum shifts, and potential reversal points with clarity and precision.
🔧 How It Works
The Rate of Change indicator calculates the percentage difference between the current price and the price from a specified number of periods ago. This measurement reveals whether price is accelerating (increasing ROC) or decelerating (decreasing ROC).
Core Calculation Logic:
The indicator calculates ROC using the standard formula:
ROC = × 100
Where n is the user-defined Length ROC
The resulting oscillator fluctuates around zero, with:
Positive ROC values indicating that prices are higher than they were n-periods ago (upward momentum)
Negative ROC values indicating that prices are lower than they were n-periods ago (downward momentum)
Zero line representing no net change over the period
The magnitude of the value indicates momentum strength:
Large positive values → Strong upward momentum
Large negative values → Strong downward momentum
Values approaching zero → Weakening momentum or consolidation
The indicator compares ROC to a reference line that can be either:
The traditional zero level
A user-defined moving average of ROC itself (ROC MA mode)
✨ Key Features
🔹 Dual Operating Modes
Zero Line Mode: Classic ROC implementation where signals occur when ROC crosses above or below the zero line
ROC MA Mode: Enhanced version where signals occur when ROC crosses its own moving average, providing smoother, filtered entries
🔹 Flexible Moving Average Selection
Choose from six MA types for the ROC MA mode:
EMA (Exponential Moving Average) for responsive signals
SMA (Simple Moving Average) for smoother readings
RMA (Rolling Moving Average) for weighted recent data
WMA (Weighted Moving Average) for customizable weighting
VWMA (Volume-Weighted Moving Average) incorporating volume
HMA (Hull Moving Average) for reduced lag
🔹 Customizable ROC Parameters
Length ROC: Lookback period for ROC calculation (default 35)
Source ROC: Price source for calculations (default Close)
🔹 Extended Range Visualization
The indicator includes gradient fills at +/-40, providing reference points for extreme momentum readings, though actual overbought/oversold levels vary by instrument.
🔹 Customizable Color Themes
Eight distinct color schemes to match your charting preferences:
Classic – Green for bullish, Red for bearish
Modern – White for bullish, Purple for bearish
Robust – Amber for bullish, Maroon for bearish
Accented – Violet for bullish, Pink for bearish
Monochrome – Light gray for bullish, Dark gray for bearish
Moderate – Green for bullish, Red for bearish
Aqua – Blue for bullish, Orange for bearish
Cosmic – Pink for bullish, Purple for bearish
🔹 Comprehensive Visual Feedback
Colored ROC Line: Changes color based on position relative to the reference line
Signal Line: Yellow line showing zero or MA reference
Gradient Fill Zones: Clear visualization of extreme momentum readings
Dynamic Zone Fills: Semi-transparent fills showing when ROC is above or below the reference line
Color-Coded Candles: Bars reflect current ROC bias (above or below reference)
Signal Markers: Triangle up/down symbols at crossover points
Live Value Display: Current ROC value shown in a floating label
Trend Table: Bullish/Bearish status displayed on the chart
🔹 Ready-to-Use Alerts
Built-in alert conditions trigger LONG signals on bullish crossovers and SHORT signals on bearish crossunders across both operating modes.
⚙️ Settings Summary
Color Choice: Select from eight visual themes (Default: Classic)
Length ROC: Lookback period for ROC calculation (Default: 35)
Source ROC: Price source for calculations (Default: Close)
Entry/Exit Signal: Choose between zero line or ROC MA mode (Default: Zero Line)
Length MA: Moving average period for ROC MA mode (Default: 365)
ROC MA Type: Moving average method for signal line (Default: EMA)
📈 Practical Applications
🔹 Trend Direction Identification
The ROC line's position relative to zero indicates trend direction:
ROC above zero → Bullish trend
ROC below zero → Bearish trend
The steepness of the slope indicates momentum strength
🔹 Zero Line Crossovers
In Zero Line mode, crossovers provide momentum signals:
Crossover above zero → Bullish momentum strengthening, potential trend reversal up
Crossunder below zero → Bearish momentum strengthening, potential trend reversal down
These are among the simplest and most intuitive trading signals
🔹 Signal Line Crossovers
In ROC MA mode, crossovers between ROC and its moving average provide filtered signals:
ROC crosses above its MA → Bullish signal
ROC crosses below its MA → Bearish signal
These signals reduce whipsaws in choppy markets
🔹 Divergence Trading
ROC is excellent for spotting divergences:
Bullish Divergence: Price makes lower low, ROC makes higher low → Potential upside reversal
Bearish Divergence: Price makes higher high, ROC makes lower high → Potential downside reversal
Divergences are most significant when occurring at extreme levels
🔹 Momentum Confirmation
The slope and magnitude of ROC confirm trend strength:
Rising ROC values → Strengthening bullish momentum
Falling ROC values → Strengthening bearish momentum
Flattening ROC → Momentum slowing, potential trend change
🔹 Centerline Rejections
When ROC approaches zero but reverses before crossing, it can signal trend continuation:
ROC pulls back toward zero but reverses up → Bullish continuation
ROC rallies toward zero but reverses down → Bearish continuation
🔹 Multiple Timeframe Analysis
Compare ROC readings across different timeframes:
Higher timeframe ROC confirms primary trend direction
Lower timeframe ROC identifies entry timing and short-term momentum shifts
🎯 Ideal For
✅ Trend Traders seeking to confirm trend direction and strength
✅ Momentum Traders wanting to measure the rate of price change
✅ Divergence Traders looking for early reversal signals
✅ Swing Traders capturing medium-term momentum shifts
✅ System Developers needing simple, reliable crossover logic
✅ Beginner Traders starting with one of the most intuitive indicators
📌 Key Takeaways
Percentage-Based Measurement: ROC expresses momentum as a percentage, making it comparable across different price levels and instruments
Dual-Mode Flexibility: Choose between classic zero-line crossovers for simplicity or MA-smoothed signals for filtered entries
Unbounded Nature: Unlike RSI or Stochastic, ROC has no upper or lower limits, making it suitable for strongly trending markets
Comprehensive Visualization: Color themes, gradient fills for extreme readings, candles, and labels provide immediate market awareness
Divergence Capability: Excellent for spotting both regular and hidden divergences
Alert-Ready: Built-in alerts for both LONG and SHORT signals across both operating modes
⚠️ Important Notes
Because ROC is unbounded, the scale will vary significantly between different instruments and timeframes. The gradient fills at +/-40 are arbitrary reference points and may not represent actual overbought/oversold conditions for all instruments. The default length of 35 provides a medium-term perspective; shorter lengths (9-14) provide more responsive signals, while longer lengths identify longer-term trends. The 365-day MA default in ROC MA mode is designed for longer-term trend context on daily charts. Divergences are most reliable when they occur after extended trends. Always combine with proper risk management and additional confirmation for best results.
Disclaimer: This indicator is provided for educational and informational purposes only. Past performance is not indicative of future results. Always conduct thorough testing and align with your risk management strategy before live deployment. Indicador

TRIX | TR🎯 Overview
TRIX | TR is a sophisticated momentum oscillator that applies triple smoothing to price data to filter out insignificant price movements and identify meaningful trend changes. Developed by Tiagorocha1989, this enhanced version of Jack Hutson's classic TRIX indicator offers dual-mode operation with customizable moving averages and comprehensive visual features, helping traders identify trend direction, momentum shifts, and potential reversal points with reduced noise and greater precision.
🔧 How It Works
The TRIX indicator applies triple exponential smoothing to price data, then calculates the percentage rate of change of this smoothed series. This process eliminates short-term cycles and noise while highlighting the underlying trend and momentum.
Core Calculation Logic:
The indicator follows a multi-step smoothing process:
Logarithmic Transformation: The price source is converted to its natural logarithm (math.log), which helps normalize percentage changes and makes the indicator responsive to proportional price movements.
Triple Smoothing: The log price undergoes three consecutive smoothing operations using a user-selectable moving average:
First smoothing (ma1): Applied to the log price
Second smoothing (ma2): Applied to ma1
Third smoothing (ma3): Applied to ma2
Rate of Change Calculation: TRIX is calculated as the percentage rate of change of the triple-smoothed series:
TRIX = 10000 × (ma3 - ma3 )
The multiplication by 10000 scales the values for better visibility
The resulting oscillator fluctuates around zero, with:
Positive TRIX values indicating upward momentum
Negative TRIX values indicating downward momentum
Zero line crossovers signaling potential trend changes
The indicator compares TRIX to a reference line that can be either:
The traditional zero level
A user-defined moving average of TRIX itself (TRIX MA mode)
✨ Key Features
🔹 Dual Operating Modes
Zero Line Mode: Classic TRIX implementation where signals occur when TRIX crosses above or below the zero line
TRIX MA Mode: Enhanced version where signals occur when TRIX crosses its own moving average, providing smoother, filtered entries
🔹 Flexible Moving Average Selection
Choose from six MA types for both the triple smoothing and the signal line:
EMA (Exponential Moving Average) for responsive signals
SMA (Simple Moving Average) for smoother readings
RMA (Rolling Moving Average) for weighted recent data
WMA (Weighted Moving Average) for customizable weighting
VWMA (Volume-Weighted Moving Average) incorporating volume
HMA (Hull Moving Average) for reduced lag
🔹 Customizable TRIX Parameters
Length TRIX: Lookback period for the moving averages (default 18)
Source TRIX: Price source for calculations (default Close)
MA Type: Moving average method used for all three smoothing steps
🔹 Logarithmic Processing
By applying TRIX to log prices rather than raw prices, the indicator responds proportionally to percentage changes, making it more consistent across different price levels and instruments.
🔹 Customizable Color Themes
Eight distinct color schemes to match your charting preferences:
Classic – Green for bullish, Red for bearish
Modern – White for bullish, Purple for bearish
Robust – Amber for bullish, Maroon for bearish
Accented – Violet for bullish, Pink for bearish
Monochrome – Light gray for bullish, Dark gray for bearish
Moderate – Green for bullish, Red for bearish
Aqua – Blue for bullish, Orange for bearish
Cosmic – Pink for bullish, Purple for bearish
🔹 Comprehensive Visual Feedback
Colored TRIX Line: Changes color based on position relative to the reference line
Signal Line: Yellow line showing zero or MA reference
Gradient Fill Zones: Clear visualization of extreme readings (+100 to -100)
Dynamic Zone Fills: Semi-transparent fills showing when TRIX is above or below the reference line
Color-Coded Candles: Bars reflect current TRIX bias (above or below reference)
Signal Markers: Triangle up/down symbols at crossover points
Live Value Display: Current TRIX value shown in a floating label
Trend Table: Bullish/Bearish status displayed on the chart
🔹 Ready-to-Use Alerts
Built-in alert conditions trigger LONG signals on bullish crossovers and SHORT signals on bearish crossunders across both operating modes.
⚙️ Settings Summary
Color Choice: Select from eight visual themes (Default: Classic)
Length TRIX: Lookback period for the triple smoothing (Default: 18)
Source TRIX: Price source for calculations (Default: Close)
Entry/Exit Signal: Choose between zero line or TRIX MA mode (Default: Zero Line)
MA Type: Moving average method for all smoothing steps (Default: EMA)
Length MA TRIX: Moving average period for TRIX MA mode (Default: 365)
📈 Practical Applications
🔹 Trend Direction Identification
The TRIX line's position relative to zero indicates trend direction:
TRIX above zero → Bullish trend
TRIX below zero → Bearish trend
The steepness of the slope indicates momentum strength
🔹 Zero Line Crossovers
In Zero Line mode, crossovers provide momentum signals:
Crossover above zero → Bullish momentum strengthening, potential trend reversal up
Crossunder below zero → Bearish momentum strengthening, potential trend reversal down
These signals often lead traditional moving average crossovers
🔹 Signal Line Crossovers
In TRIX MA mode, crossovers between TRIX and its moving average provide filtered signals:
TRIX crosses above its MA → Bullish signal
TRIX crosses below its MA → Bearish signal
These signals reduce whipsaws in choppy markets
🔹 Divergence Trading
TRIX is excellent for spotting divergences:
Bullish Divergence: Price makes lower low, TRIX makes higher low → Potential upside reversal
Bearish Divergence: Price makes higher high, TRIX makes lower high → Potential downside reversal
Divergences are most significant when occurring at extreme levels
🔹 Momentum Confirmation
The slope and magnitude of TRIX confirm momentum:
Steeply rising TRIX → Strong bullish momentum
Steeply falling TRIX → Strong bearish momentum
Flattening TRIX → Momentum slowing, potential trend change
🔹 Cycle Identification
The triple smoothing process removes short-term cycles, helping identify medium to longer-term cycles and trends:
Default length 18 is suitable for identifying intermediate-term cycles
Shorter lengths for shorter-term cycles
Longer lengths for major trend identification
🔹 Multiple Timeframe Analysis
Compare TRIX readings across different timeframes:
Higher timeframe TRIX confirms primary trend direction
Lower timeframe TRIX identifies entry timing and short-term momentum
🎯 Ideal For
✅ Trend Traders seeking to identify and follow established trends with reduced noise
✅ Momentum Traders wanting to measure the acceleration of price movements
✅ Divergence Traders looking for early reversal signals
✅ Swing Traders capturing medium-term momentum shifts
✅ Cycle Analysts identifying underlying price cycles
✅ System Developers needing reliable, smoothed momentum signals
📌 Key Takeaways
Triple Smoothing: The three-stage smoothing process eliminates insignificant price movements, revealing the underlying trend
Logarithmic Processing: Using log prices makes TRIX responsive to percentage changes, providing consistency across different price levels
Dual-Mode Flexibility: Choose between classic zero-line crossovers for traditional signals or MA-smoothed signals for filtered entries
Comprehensive Visualization: Color themes, gradient fills for extreme zones, candles, and labels provide immediate market awareness
Divergence Capability: Excellent for spotting both regular and hidden divergences that signal trend reversals or continuations
Alert-Ready: Built-in alerts for both LONG and SHORT signals across both operating modes
⚠️ Important Notes
TRIX is a smoothed indicator, meaning it will be slower to react than single-smoothed oscillators. This makes it better suited for identifying intermediate to longer-term trends rather than short-term entries. The default length of 18 provides a balance between responsiveness and smoothness. The multiplication by 10000 scales the values for better visibility but does not change the signal logic. The 365-day MA default in TRIX MA mode is designed for longer-term trend context on daily charts. Divergences are most reliable when they occur after extended trends. Always combine with proper risk management and additional confirmation for best results.
Disclaimer: This indicator is provided for educational and informational purposes only. Past performance is not indicative of future results. Always conduct thorough testing and align with your risk management strategy before live deployment. Indicador

Gold/Spread AlgoXAUUSD 1-Minute RSI Scalping Strategy – Mean-Reversion with Fixed Exits
This open-source strategy is a high-frequency, counter-trend scalping system designed specifically for **XAUUSD (Gold)** on the 1-minute timeframe.
Core Logic
The strategy uses classic RSI(14) to identify short-term overextension:
- Long entry when RSI drops below oversold (default 30) → expects quick snap-back
- Short entry when RSI rises above overbought (default 70) → expects quick pullback
Entries are taken only when flat (no pyramiding). Exits are fixed in pips and set immediately on entry:
- Take Profit: +10 pips (0.10 in XAUUSD price)
- Stop Loss: –5 pips (0.05 in XAUUSD price)
- Built-in Risk:Reward = 1:2
This fixed structure gives the system positive mathematical expectancy even with moderate win rates (≈55–65% before costs), provided gold continues to exhibit frequent mean-reversion behavior on 1-minute charts.
Why this simple approach?
Gold is one of the most volatile and momentum-driven instruments on very short timeframes. Pure RSI extremes often capture quick exhaustion moves after news spikes, order flow imbalances, or session transitions — especially during London/NY overlap. Fixed pip targets prevent over-optimization and mimic real broker execution more closely than dynamic trailing or percentage-based exits.
Important Realism & Backtesting Notes
To produce non-misleading results, use these settings when publishing/testing:
- Initial Capital: $10,000 – $30,000 (realistic retail size)
- Position sizing: fixed 0.10–0.30 lots or 1–3% equity per trade
- Commission: 5–8 USD round-turn per lot (typical ECN/raw-spread)
- Slippage: 3–8 ticks (≈0.03–0.08 in price) — gold spreads widen during volatility
- Minimum dataset: 12–36 months of 1-minute data (aim for 800–2000+ trades)
- Risk per trade: usually 0.5–1.5% with defaults — never exceeds sustainable levels
Results vary significantly:
- Strongest in ranging or mildly trending sessions
- Weaker during strong directional moves or major news (NFP, FOMC, geopolitics)
- Expect drawdowns during trending regimes — this is NOT a trend-following system
Visual & Dashboard Elements
- RSI line + fill (blue/orange background) + overbought/oversold zones
- BUY/SELL triangles at entry points
- Professional top-right dashboard showing:
- Net Profit & Loss
- Total Trades / Win Rate / Profit Factor
- Winning / Losing Trades
- Current RSI value
- Position status (LONG / SHORT / FLAT)
- TP:SL ratio
Alerts
- 🟢 LONG ENTRY – RSI oversold
- 🔴 SHORT ENTRY – RSI overbought
How to Use
1. Apply to XAUUSD 1-minute chart only
2. Use realistic commission/slippage in Strategy Tester
3. Trade primarily during London & New York sessions for best liquidity
4. Avoid major news events or widen stops manually
5. Forward-test on demo for 2–3 months minimum
6. Always size conservatively — never risk more than 1–2% per trade
Publish Recommendation
- Use a clean chart: only this strategy, no extra indicators/drawings
- Show realistic tester results with commission/slippage applied
- Screenshot during active session with visible entry signals + dashboard
Educational tool — open-source for learning and testing. Not financial advice. Gold 1-minute trading is extremely volatile and carries high risk of loss. Trade responsibly. Estrategia

Normalized ROC - Two Security SpreadThis is my exploratory script for comparing the movement of two securities: the one that is studied is compared to some benchmark (like QQQ etc.). The movements of both are measured as ROC(t) normalized with each others own ATR. Normalized ROCs are then subtracted to create a "spread".
The plot draws both securities' NormROC as lines and the spread as a histogram. So, histogram shows green, when the stock is stronger than the benchmark even in their normalized terms, indicating strong momentum, and vice versa as red. Furthermore, the indicator marks with triangles so called hidden strength and hidden weakness. Hidden strength occurs when Benchmark (e.g. QQQ) is weak, but the stock is not. The assumption is that when the benchmark turns positive the stock is ready to run faster. Respectively, hidden weakness is when Benchmark is strong, but the stock does not follow. Of course, there will be many false signals, these are just potential indications of strength and weakness.
Parameters can be adjusted, length of ROC and the line smoothing EMA. Also alerts can be set for histogram level and the hidden strength/weakness levels.
DISCLAIMER: Indicator has not been tested. Use with caution and own responsibility. As always, be aware of false signals. Never make decisions with one indicator only. Indicador

Rate of Change - ROC🎯 Overview
This is an advanced Rate of Change - ROC indicator that measures percentage price movement over time, combined with dynamic moving average filtering. Unlike basic ROC implementations, this version features gradient momentum zones, multiple color themes, and a clear signal dashboard for precise momentum velocity identification.
🧩 Core Components
1. ⚙️ Technical Foundation
📊 Primary Calculation: Uses TradingView's built-in ta.roc() function which calculates percentage change between current price and price N periods ago
📈 Dual Analysis Components:
ROC Line: Percentage change oscillator
MA Filter: Customizable moving average acting as momentum trend line
Momentum Zones: Gradient fills for strong positive and strong negative momentum
⚡ Velocity Measurement: Unique ability to quantify the speed of price movement as a percentage
2. 🎛️ Configuration Parameters
📏 ROC Length: Default 35 periods (optimized for momentum detection)
🔄 MA Filter Settings:
Length: Customizable (default 365 periods)
Type: 6 options available (EMA, SMA, RMA, WMA, VWMA, HMA)
🎨 Color Themes: 5 visual schemes consistent with your indicator suite:
Classic, Modern, Robust, Accented, Monochrome
📊 Signal Interpretation:
🟢 BULLISH: ROC > MA Filter (momentum accelerating upward)
🔴 BEARISH: ROC < MA Filter (momentum accelerating downward)
🚀 STRONG BULLISH: ROC > 40% (extreme positive momentum)
📉 STRONG BEARISH: ROC < -20% (extreme negative momentum)
3. 🎨 Visual Elements
🚨 Gradient Zones:
Strong Bullish zone : Green gradient intensifying toward higher percentages
Strong Bearish zone : Red gradient intensifying toward lower percentages
📋 Dashboard Display: Top-right status indicator showing "⬆️ Bullish" or "⬇️ Bearish"
📊 Dynamic Coloring: ROC line changes color based on position relative to MA
⚡ Zero Line Reference: Natural equilibrium at 0% change
⚡ Trading Applications
📈 Primary Uses:
🎯 Momentum Velocity Measurement:
ROC > MA = Accelerating bullish momentum
ROC < MA = Accelerating bearish momentum
💪 Momentum Strength Quantification:
Higher positive percentages = Stronger uptrend acceleration
Lower negative percentages = Stronger downtrend acceleration
Measures rate of change rather than just direction
🚨 Extreme Momentum Signals:
Strong Bullish: (rapid price appreciation)
Strong Bearish: (rapid price depreciation)
📊 Zone Analysis:
🟢 Strong Bullish Zone :
Green gradient fills
Indicates rapid price acceleration upward
Often precedes consolidation or pullback
🔴 Strong Bearish Zone :
Red gradient fills
Indicates rapid price acceleration downward
Often precedes bounce or reversal
🟡 Equilibrium: Yellow MA line acts as momentum trend filter
🎨 Customization Options
👁️ Display Features:
📊 Dual Components: Always shows both ROC line and MA filter
🎨 Gradient Visualization: Automatic fill for extreme momentum conditions
📋 Status Dashboard: Clear bullish/bearish momentum acceleration indication
📈 Customizable MA: Choose from 6 different moving average types
📏 Adjustable Thresholds: 40% and -20% levels optimized for ROC analysis
🎨 Visual Themes: (Consistent suite)
🎨 Classic: Green/Red (traditional momentum colors)
🚀 Modern: Cyan/Purple (contemporary)
💪 Robust: Amber/Deep Purple (high contrast)
🌈 Accented: Purple/Magenta (vibrant)
⚫⚪ Monochrome: Light Gray/Dark Gray (minimalist)
🔔 Alert System
🟢 LONG Alert: Triggers when ROC crosses above MA
🔴 SHORT Alert: Triggers when ROC crosses below MA
📧 Format: Includes ticker symbol for tracking
⚡ Key Advantages
✅ Strengths:
🎯 Velocity-Based Analysis: Measures speed of price movement, not just direction
💪 Percentage-Based: Provides intuitive understanding of momentum strength
👁️ Trend Acceleration Identification: MA filter shows when momentum is accelerating/decelerating
🔄 Flexible Timeframes: 35-period default optimized for momentum detection
📊 Professional Dashboard: Immediate momentum acceleration status
📊 Optimal Settings:
⚡ Short-term Momentum: ROC Length 10-20, MA Length 20-50
📊 Medium-term Momentum: ROC Length 20-35, MA Length 50-100
📈 Long-term Momentum: ROC Length 35-50, MA Length 100-365
🏆 Unique Features:
🎯 Percentage-Based Measurement: Shows exact rate of price change
📊 Asymmetric Thresholds: 40% bullish / -20% bearish (reflects typical market asymmetry)
🎨 Consistent Design: Matches your indicator family aesthetics
📋 Momentum Dashboard: Quick visual confirmation of acceleration/deceleration
🔧 Speed Analysis: Focuses on velocity rather than just position
🔄 Trading Strategies
1. Momentum Acceleration Strategy:
Go LONG when ROC crosses above MA with ROC > 0%
Go SHORT when ROC crosses below MA with ROC < 0%
Strong signals when crossing occurs in extreme zones
2. Velocity Divergence:
Price makes higher high, ROC makes lower high → Momentum divergence (trend weakening)
Price makes lower low, ROC makes higher low → Momentum divergence (downtrend losing steam)
3. Trend Acceleration Detection:
Rising ROC above MA = Uptrend accelerating
Falling ROC below MA = Downtrend accelerating
Flat ROC near MA = Trend consolidation
📈 Performance Tips
Context Matters: High ROC during strong trends is normal, during ranges may signal exhaustion
Zero Line Cross: ROC crossing 0% often signals trend change
Extreme Readings: ROC > 40% often precedes consolidation, ROC < -20% often precedes bounce
Timeframe Alignment: Use consistent periods across charts for comparable readings
Confirmation: Combine with price structure and volume for highest probability trades
This enhanced ROC indicator provides professional-grade momentum velocity analysis with intuitive visualization, allowing traders to quantify the speed of price movements, identify acceleration/deceleration phases, and filter signals through the customizable moving average for precise momentum-based trading decisions! 📊⚡ Indicador

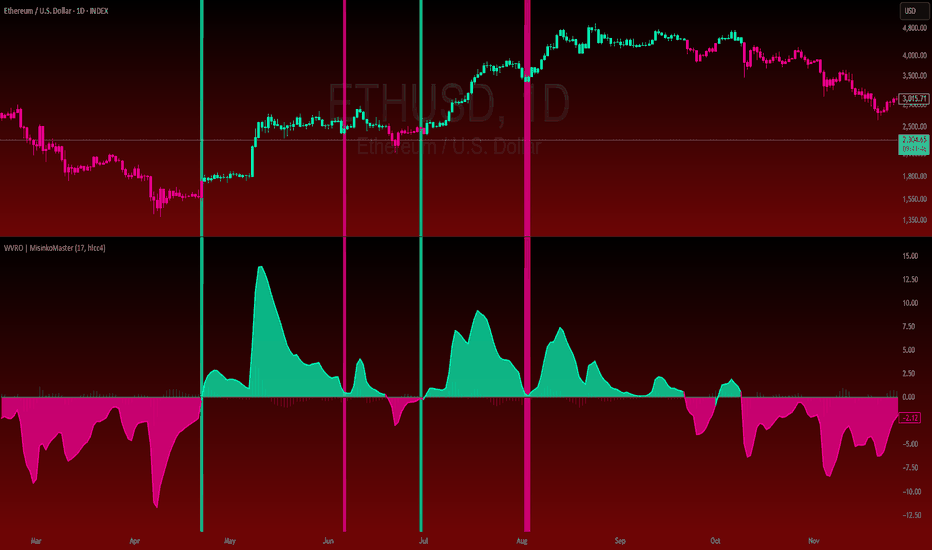
Weighted Volume ROC OscillatorWeighted Volume ROC Oscillator (WVRO | MisinkoMaster)
The Weighted Volume ROC Oscillator is a sophisticated trend-following tool that leverages a volume-weighted Rate of Change (ROC) calculation on a double-smoothed source. Designed to capture both trend direction and strength with minimal noise, this oscillator also highlights potential reversal points, making it an effective tool for fast-moving markets like ETHUSD.
By combining volume weighting with advanced smoothing techniques, the WVRO provides a responsive yet stable indicator to help traders make more informed decisions during trending conditions.
🔍 Concept & Idea
The core idea behind the WVRO is to develop a high-speed oscillator capable of smoothly following trends while remaining sensitive to rapid changes. The ROC is a natural choice for momentum measurement, but raw ROC alone can be noisy.
To improve stability and responsiveness:
The input source is smoothed twice using Weighted Moving Averages (WMA) with a length proportional to the square root of the user-defined length, reducing noise while preserving fast reactions.
The ROC is then weighted by volume to emphasize price movements during high-volume periods, increasing the significance of meaningful trades.
Finally, a volume-weighted average of the ROC is calculated to normalize the signal.
This combination balances smoothness and speed, improving signal clarity in trending markets.
⚙️ How It Works
Double WMA Smoothing of Source:
First, apply a WMA with length √len to the selected source to filter noise but retain responsiveness.
Apply a second WMA with the same length to the first smoothed series for additional smoothing.
Volume-Weighted ROC Calculation:
Calculate ROC on the double-smoothed source over one bar.
Multiply the ROC by the current volume, weighting price changes by trading activity.
Normalization and Oscillator Computation:
Calculate an Exponential Moving Average (EMA) of the volume-weighted ROC over the full length.
Divide by the sum of volume over the same length to normalize, then scale to a range centered near zero.
Trend Logic:
Positive WVRO values indicate bullish momentum (trend up).
Negative values indicate bearish momentum (trend down).
Momentum Divergence:
The difference between the current WVRO and its prior value is smoothed with EMA and plotted as a histogram to help identify potential momentum shifts and reversals.
🧩 Inputs Overview
Oscillator Length – Controls the main smoothing and lookback length of the oscillator (default 17).
Source – The price source used for calculation, defaulting to the average of high, low, close, and close (hlcc4).
📌 Usage Notes
Responsive Yet Smooth: The double WMA smoothing ensures the oscillator is less prone to noise but remains quick to react to market changes.
Volume Weighting: Emphasizes price moves on higher volume bars, improving signal reliability in volatile markets.
Trend Identification: Positive and negative readings provide clear trend signals, while divergence histograms highlight potential turning points.
Visual Clarity: Color-coded plots and background highlighting assist quick interpretation.
Optimized for ETHUSD: Especially effective in high-liquidity, high-volatility assets like Ethereum.
Complement with Other Tools: Use alongside price action or other indicators to confirm trends and entry/exit points.
Backtest and Validate: Always validate settings on your chosen asset and timeframe before live use.
⚠️ Disclaimer
This indicator is for educational and analytical purposes only and does not constitute financial advice. Trading involves significant risk, and users should perform due diligence before trading.
Enjoy enhanced trend following with the Weighted Volume ROC Oscillator! Indicador
Indicador

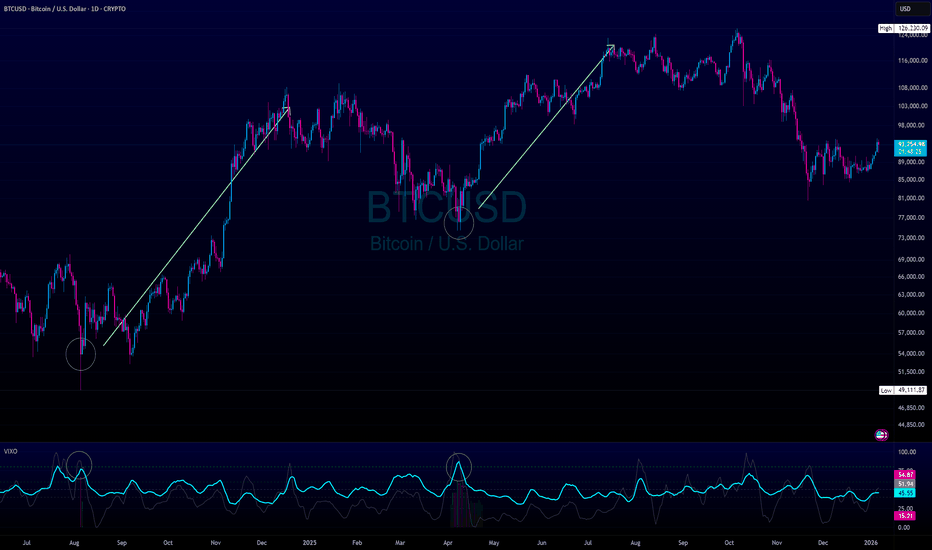
VIXO - VIX OscillatorVIXO (VIX Oscillator) is a volatility oscillator built from the CBOE Volatility Index (symbol: TVC:VIX). It helps visualize volatility regime shifts by combining a smoothed VIX RSI with a normalized VIX momentum component, plus a VIX histogram that becomes more/less prominent depending on how far VIX is from its moving average. It helps you assess whether market conditions may be approaching rare but powerful squeeze phases.
WHAT THIS INDICATOR PLOTS
1) VIX RSI (cyan line)
- RSI is calculated on the VIX close and then smoothed (SMA) to reduce noise.
- Use it to observe short-term momentum in volatility rather than price.
2) VIX Normalized Momentum (gray line)
- Momentum is measured as ROC (rate of change) of the VIX close.
- That ROC is normalized to a 0–100 scale using a rolling lookback window:
- 50 is the midpoint of the recent momentum range (neutral within the selected window).
- Values near 0/100 indicate momentum near the low/high of that lookback window.
3) VIX Value Bars (histogram)
- Histogram shows the raw VIX value.
- Bar visibility is dynamically adjusted (transparency changes) based on the ratio of VIX to its 21-period SMA:
- When VIX is close to its MA, bars are more transparent.
- When VIX deviates more from its MA (within a capped range), bars become more visible.
- If VIX High is below 30, the script intentionally keeps bars fully transparent to reduce visual clutter.
LEVELS (REFERENCE ONLY)
The horizontal levels are visual guides to help segment oscillator zones. They are not guarantees and should not be treated as standalone trade signals:
- 80: “Panic of Market”
- 60: “VIX says BUY” (label only; not financial advice)
- 50: “Neutral / Momentum Mid”
- 40: “Get Ready”
HOW TO USE
- Apply VIXO to any chart. The indicator always pulls TVC:VIX data, regardless of the chart symbol.
- Typical interpretation:
- Rising VIX RSI and/or rising normalized momentum can indicate increasing volatility pressure.
- Falling readings can indicate volatility easing.
- Compare changes in VIXO with your chart’s price structure, trend filters, or risk management framework.
INPUTS
- RSI Length: RSI period on VIX close (smoothed afterward).
- Momentum Length: ROC period on VIX close.
- Momentum Normalization Lookback: window used to scale ROC into 0–100.
DATA & BEHAVIOR NOTES
- Data source: request.security("TVC:VIX", timeframe.period, OHLC).
- The script does not use lookahead to access future data.
- On realtime bars, values can update while the current bar is forming; historical bars remain fixed once closed.
- Availability of TVC:VIX data depends on your TradingView data access.
IMPORTANT DISCLAIMER
This indicator is provided for educational and informational purposes only and does not constitute financial, investment, or trading advice. It does not predict the future, does not guarantee results, and should not be used as the sole basis for any trading decision. Always validate signals with additional analysis and use appropriate risk management.
Indicador
Indicador

Indicador

Indicador
DNSE VN301!, ADX Momentum StrategyA statistical momentum breakout strategy for VN30F1M futures. Rather than fixed thresholds, it measures how unusual current momentum and price behavior are relative to their own recent history, using the IQR (Interquartile Range) as a dynamic, self-adjusting boundary, visible directly on the indicator panel as the strategy runs.
________________________________________________________________
1. Component breakdown: ADX, +DI, -DI, and the DI Acc Change IQR
The Directional Movement System (ADX/+DI/-DI) measures buying pressure vs. selling pressure:
+DI rises when today's close is higher than yesterday's, tracking the strength of upward pressure.
-DI rises when today's close is lower than yesterday's, tracking the strength of downward pressure.
ADX is derived from how far apart +DI and -DI are, measuring trend strength regardless of direction. In this script ADX is plotted for reference only and is not used as a trade filter; the signal logic runs entirely on +DI and -DI individually.
The strategy does not trade on +DI/-DI directly, it trades on how fast they are changing, built up in two steps:
- Slope equals DI minus its own EMA(10), a 1st-derivative proxy showing whether DI is currently running above or below its short-term trend.
- Acceleration equals Slope minus the EMA(10) of that slope, a 2nd-derivative proxy showing whether the slope itself is speeding up or slowing down.
Acceleration Change equals today's acceleration minus yesterday's, and this is the actual number compared against the threshold, calculated separately for +DI and -DI.
This is where the IQR table's "DI Acc Change (IQR)" row comes from.
The script takes the last 1,000 bars of +DI Acceleration Change and -DI Acceleration Change and calculates the IQR (25th-to-75th percentile spread) of each series independently, shown as the "+DI Acc Change" and "-DI Acc Change" columns. These two are then averaged into "Avg IQR," which is the single number a live acceleration-change reading must exceed to count as a breakout. In other words, ADX/DI tells you pressure exists, slope tells you its trend, acceleration tells you if that trend is speeding up, and the DI Acc Change IQR tells you whether today's speed-up is statistically large enough to matter.
________________________________________________________________
2. Component breakdown: what IQR is and the Close Gap IQR
IQR (Interquartile Range) is a standard statistical measure of typical spread in a dataset. Sort the data, find the value at the 25th percentile (Q1) and the value at the 75th percentile (Q3), and take the difference (Q3 minus Q1). This deliberately excludes the top and bottom 25% of the data, the extreme values, before measuring spread. IQR stays anchored to what normal bars look like, regardless of how extreme a handful of recent bars have been.
The script applies this same IQR calculation to a second, separate series: Close Bar Gap (current's bar close minus last bar's close), over the last 250 bars. That gives Close Gap Q1 and Close Gap Q3, and their difference is the "Close Gap (IQR)" row in the table, shown as one repeated value across all three columns since, unlike DI, there's only one gap series rather than one split by direction. A reading of 8.6, for example, means a single bar's close-to-close move needs to exceed 8.6 points to be considered volatile rather than routine.
________________________________________________________________
(3). How to read the IQR Table and use this strategy:
Exit filter: an exit is only considered when the current bar's close gap itself exceeds this IQR value, meaning the market is currently making an unusually large move rather than just drifting.
Stop-loss distance: when a stop-loss is armed, it's placed exactly Close Gap IQR points away from the entry price, rather than a fixed point value. In calm markets this value shrinks and the stop tightens; in volatile markets it expands and the stop widens automatically.
How to read the chart, step by step:
This table shows the current statistical thresholds the strategy is measuring every bar against. The DI Acc Change (IQR) row shows the normal range of momentum acceleration change, split into +DI and -DI, averaged into Avg IQR. A reading such as +DI 2.39, -DI 1.98, Avg 2.18 means that, on average, day-to-day acceleration changes larger than about 2.18 are statistically unusual.
The Close Gap (IQR) row shows the normal range of bar-to-bar close price movement, for example 8.6, where moves larger than this are considered volatility spikes. These two numbers are the actual trigger levels for that moment, updating continuously as new bars form, so they will not stay fixed at the value shown at any one time.
Next, watch the oscillator panel for the breakout signal. The purple flat line is the current Average DI IQR threshold, and the green flat line is the current Close Gap IQR threshold, the same numbers as the table, drawn so live price and momentum lines can be seen interacting with them. The yellow line (+DI Acceleration Change) and orange line (-DI Acceleration Change) are the momentum signal; when either spikes above the purple line, momentum has broken out of its normal range, which is the entry trigger. The blue and red lines above them are the raw +DI/-DI Acceleration values, showing the trend of momentum rather than the breakout trigger itself, useful for seeing which direction pressure is building before a spike happens.
Then confirm direction on the price panel. A DI breakout alone doesn't say which way to trade, so the strategy also checks whether the current bar closed higher or lower than the previous one. A breakout with a higher close signals Long; a breakout with a lower close signals Short. The arrows on the price panel mark exactly where both conditions lined up.
Watch the white line for exit and stop conditions. The white line (Close Bar Gap) is the raw bar-to-bar price movement. When it spikes past the green Close Gap IQR line, that bar's price move is itself abnormal, and combined with RSI turning against the position and a DI breakout still active, this arms a stop-loss sized to the current Close Gap IQR value rather than a fixed number.
Finally, RSI, plotted as the purple line in the price-panel oscillator, confirms fade rather than entry. RSI is only used at exit, rising or falling relative to the prior bar, to confirm momentum is actually fading on the side the position is on, rather than duplicating the entry signal.
In short: the table numbers are today's thresholds. The yellow or orange line crossing the purple line is a momentum breakout and the entry trigger. Price direction determines which side to trade. The white line crossing the green line, combined with RSI turning and a still-active breakout, arms the stop-loss, sized to the current Close Gap IQR rather than a fixed point value.
________________________________________________________________
4. Strategy settings and configuration:
Chart timeframe: recommended 30-minute
Position size: 4 contracts
Initial capital: 100,000,000 VND
Commission: 5,250 VND per contract, excluding tax
Slippage: 3 ticks
ADX / DI length: 14
RSI length: 14
DI slope/acceleration smoothing: 10
DI acceleration IQR lookback: 1,000 bars
Close gap IQR lookback: 250 bars
Stop loss: dynamic, sized to Close Gap IQR
Take profit: disabled
Trading session: 09:00–11:30, 13:00–14:30
End-of-day auto close: 14:30
Long entry — all of the following must be true:
in trading session
+DI acceleration change ≥ Avg DI IQR OR -DI acceleration change ≥ Avg DI IQR
close > previous close
no open position
Long exit — reversal:
close Long immediately if Short entry conditions become true
Long exit — stop-loss arms when all of the following are true:
in trading session
+DI acceleration change ≥ Avg DI IQR OR -DI acceleration change ≥ Avg DI IQR
RSI < previous RSI
close gap ≥ Close Gap IQR
close < previous close
stop level = entry price − Close Gap IQR
Short entry — all of the following must be true:
in trading session
+DI acceleration change ≥ Avg DI IQR OR -DI acceleration change ≥ Avg DI IQR
close < previous close
no open position
Short exit — reversal:
close Short immediately if Long entry conditions become true
Short exit — stop-loss arms when all of the following are true:
in trading session
+DI acceleration change ≥ Avg DI IQR OR -DI acceleration change ≥ Avg DI IQR
RSI > previous RSI
close gap ≥ Close Gap IQR
close > previous close
stop level = entry price + Close Gap IQR
All positions force-close at 14:30, overriding every other condition.
----------------------------------
*Figure examples, using table values Avg DI IQR = 2.18 and Close Gap IQR = 8.6:
Both IQR values recalculate every bar from a rolling 1,000-bar window (DI) and 250-bar window (close gap), so the 2.18 and 8.6 figures above are illustrative snapshots, not fixed constants.
Long entry example: +DI acceleration change reads 2.7, above the 2.18 threshold. Close prints 1,642.0 versus a prior close of 1,639.5. Both conditions true with no open position, so Long opens at 1,642.0.
Long exit example: while Long is open, a bar shows a breakout still active, RSI falling from the prior bar, a close gap of 9.1 points which exceeds 8.6, and close at 1,633.0 below the prior close. Stop arms at 1,642.0 − 8.6 = 1,633.4.
Short entry example: -DI acceleration change reads 2.5, above the 2.18 threshold. Close prints 1,636.0 versus a prior close of 1,639.5. Short opens at 1,636.0.
Short exit example: while Short is open, a bar shows a breakout still active, RSI rising from the prior bar, a close gap of 8.9 points which exceeds 8.6, and close at 1,644.9 above the prior close. Stop arms at 1,636.0 + 8.6 = 1,644.6.
Risk disclaimer:
Futures trading involves a high level of risk and prices can move sharply. This script is provided for reference, research, and backtesting purposes only. Users should fully understand derivatives trading, their own risk tolerance, and the strategy logic before applying it to live trading.
All investment decisions are the responsibility of the user. This strategy is not responsible for any losses arising from its use in real trading. Past performance does not guarantee future results.
Estrategia

Indicador

Shock Detector: Price Jerk with Std-Dev BandsDetect sudden shocks in market behaviour
This indicator measures the jerk of price – the third derivative of price with respect to time (rate of change of acceleration). It highlights sudden accelerations and decelerations in price movement that are often invisible with standard momentum or volatility indicators.
Per-bar or time-scaled derivatives (choose whether calculations are based on bars or actual seconds).
Features
Log-price option for more stable readings across different price levels.
Optional smoothing with EMA to reduce noise.
Line or column view for flexible visualization.
Standard deviation bands (±1σ and ±2σ), centered either on zero or the rolling mean.
Auto window selection (1 day to 4 weeks), adaptive to chart timeframe.
Color-coded jerk: green for positive, red for negative.
Optional filled bands for easy visual context of normal vs. extreme jerk moves.
How to Use
Use jerk to identify sudden shifts in market dynamics, where price movement is not just changing direction but changing its acceleration.
Bands help highlight when jerk values are statistically unusual compared to recent history.
Combine with trend or momentum indicators for potential early warning of breakouts, reversals, or exhaustion.
Why it’s useful
Most indicators measure price, velocity (returns), or acceleration (momentum). This goes one step further to look at jerk, giving you a tool to spot “shock” movements in the market. By framing jerk within standard deviation bands, it’s easy to see whether current moves are ordinary or exceptional.
Developed with the assistance of ChatGPT (OpenAI). Indicador