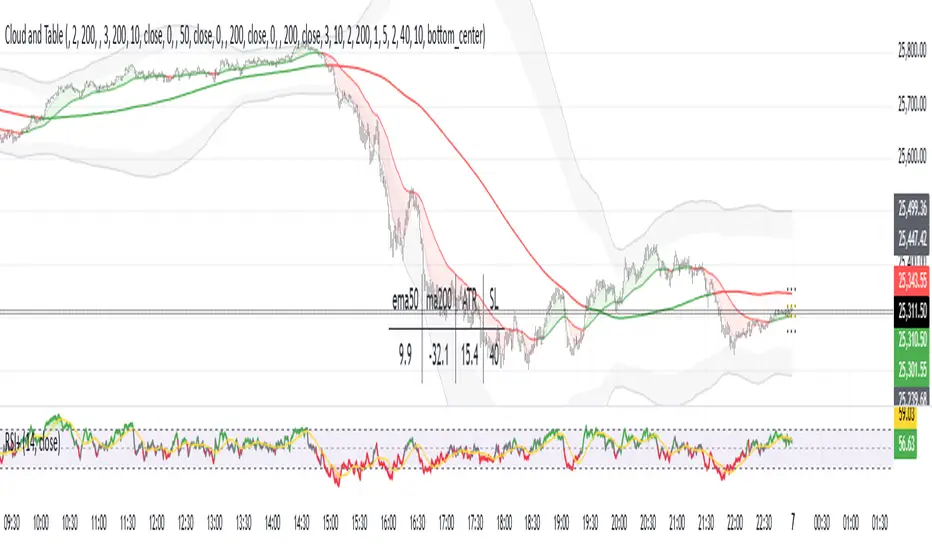
3-Minute RSI and EMA Crossover Strategy 3-Minute RSI and EMA Crossover Sell Strategy with Exit Conditions and Re-entryEstrategiapor RSIBHAI41
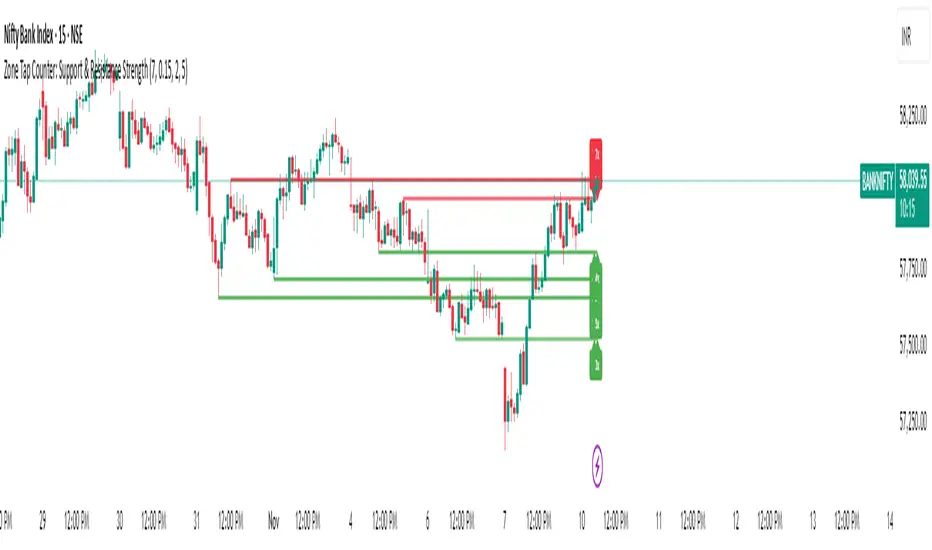
Zone Tap Counter: Support & Resistance StrengthWhat is this indicator? This script is designed to help traders objectively monitor the strength and significance of price zones by counting and visualizing how many times price “taps” confirmed support and resistance levels. The indicator leverages swing high/low detection to automatically plot relevant zones and uses price tap frequency as an objective strength metric. How does it work? Zone Identification: The script uses the Pine Script functions ta.pivothigh and ta.pivotlow to deIndicadorpor darshakssc102
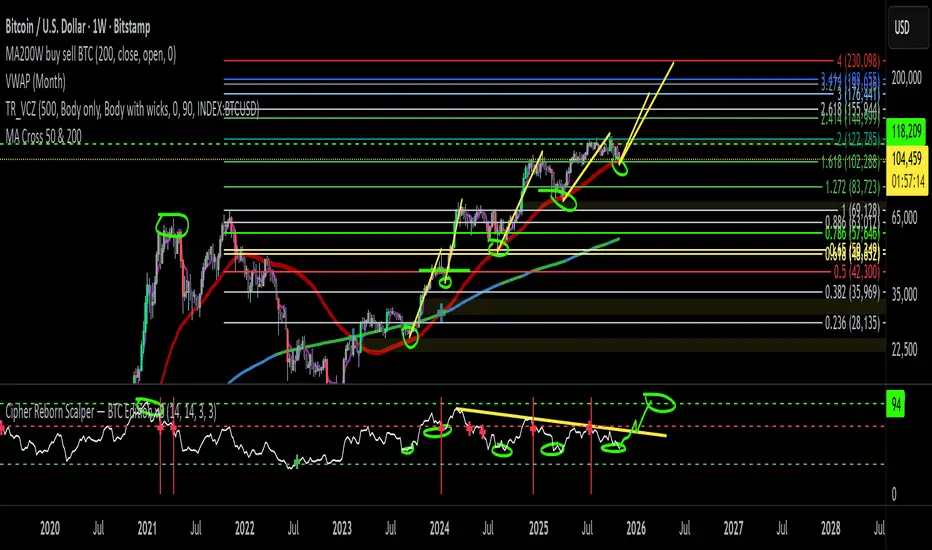
Cipher Reborn Scalper — BTC Edition v8Try this out only for trading BTC. Let me know how it goes.Indicadorpor danicoronel253
PE Fair ValueIn short, it’s an automated fair value estimator based on the price-to-earnings model, with full manual control if TradingView’s fundamental data is missing. Summary: 1. Lets the user choose the EPS source – either automatically from TradingView fundamentals (EPS TTM) or a manual value. 2. Attempts to fetch the stock’s P/E ratio (TTM) automatically; if unavailable, it uses a manual fallback P/E. 3. Calculates: Actual P/E = current price ÷ EPS Fair Value = EPS × chosen (auto/manual) P/E PerIndicadorpor joakimandersson7803Actualizado 53
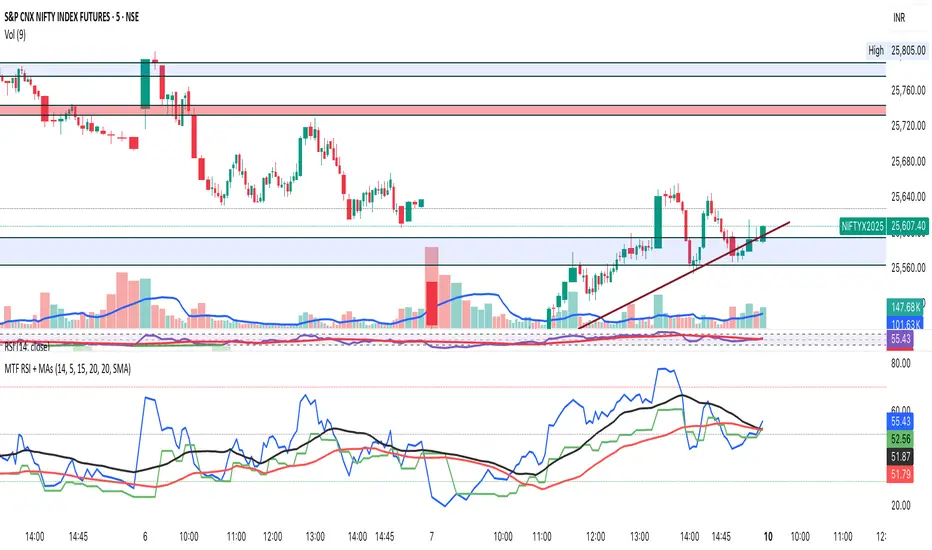
Multi-Timeframe RSI + MA - Santosh - BangaloreThis script has a combined 5 and 15 min RSI's together in one indicator. Created using AI.Indicadorpor SantoshRRamadas18
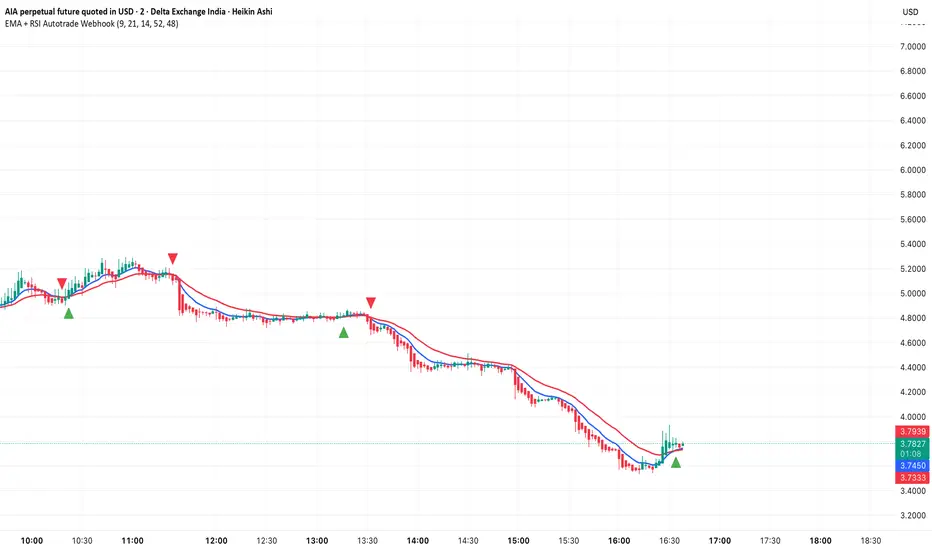
EMA + RSI Autotrade Webhook - VarunOverview The EMA + RSI Autotrade Webhook is a powerful trend-following indicator designed for automated crypto futures trading. This indicator combines the reliability of Exponential Moving Average (EMA) crossovers with RSI momentum filtering to generate high-probability buy and sell signals optimized for webhook integration with crypto exchanges like Delta Exchange, Binance Futures, and Bybit.Key Features Simple & Effective: Uses proven EMA 9/21 crossover strategy RSI Momentum Filter: EliminatIndicadorpor varuns_back200
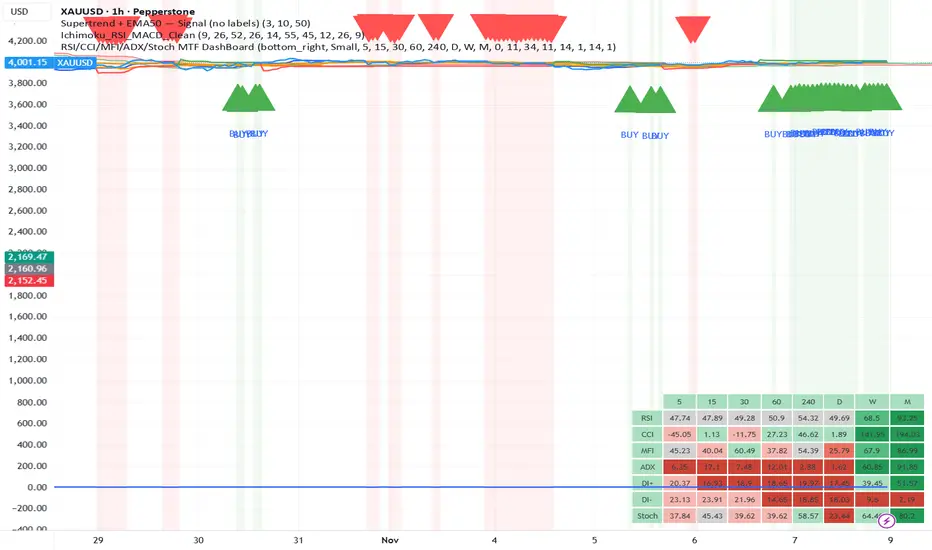
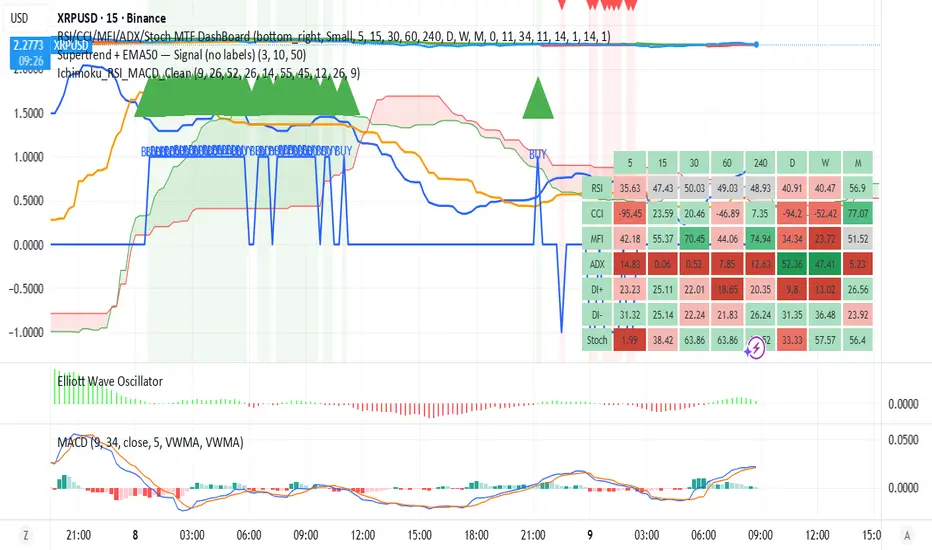
Ichimoku_RSI_MACD_CleanIchimoku + RSI + MACD. A combination of three indicators. The important thing is that they have a BUY or SELL alert, so it makes it easy to understand the numbers. Indicadorpor chpol11
Ichimoku_RSI_MACD_CleanIchimoku + RSI + MACD. Combined indicators with BUY and SELL alerts. Indicadorpor chpol8
Ichimoku_RSI_MACD_CleanIchimoku + RSI + MACD indicator. It combines these three indicators. It tells whether the trend is bullish or bearish. Multi-timeframe.Indicadorpor chpol15
Pulse RSI | Lyro RSPulse RSI | Lyro RS The Pulse RSI is a momentum oscillator that enhances the traditional RSI by incorporating volume-weighted price and linear regression. It generates multiple trading signals, including trend shifts, overbought/oversold conditions, and custom threshold levels. By integrating both price and volume into its calculation, Pulse RSI is more robust and responsive than the standard RSI. This helps you identify trends faster, spot potential reversals sooner, and set up custom alerts Indicadorpor LyroRS2415
RSI(Min-Max)RSI (Min-Max) is an enhanced version of Welles Wilder's Relative Strength Index, designed to offer greater analytical precision and dynamic insight into the behavior of the RSI within each candlestick.In addition to displaying the traditional RSI value, this script calculates the possible extreme values — the minimum and maximum RSI — based on the low and high prices of the current candle. This allows you to estimate how the RSI would react if the price moved to the extremes of the bar, providinIndicadorpor btdqdqwstrc11
ADX Trend Strength Filter + TRAMA [DotGain]Summary Are you tired of trading trend signals, only to get stopped out in volatile, sideways chop? The ADX Trend Strength Filter (ADX TSF) is designed to solve this exact problem. It is a comprehensive trend-following system that only generates signals when a trend not only has the right direction and momentum, but also sufficient strength. This indicator filters out weak or indecisive market phases (the "chop") and will only color the bars Green or Red when all conditions for a strong, confIndicadorpor DotGain1183
RSI + MACD Multi-Timeframe StrategyThis strategy combines the Relative Strength Index (RSI) from the daily timeframe with the Moving Average Convergence Divergence (MACD) from the 4-hour timeframe to generate precise long entry and exit signals. The system uses a multi-timeframe approach to align longer-term trend conditions with shorter-term momentum shifts — allowing traders to catch dips with confirmation and exit before reversals. 🧠 Strategy Logic ✅ Long Entry Condition: - RSI on the daily (1D) timeframe is oversold (belEstrategiapor RWCS_LTD2632
SamRSIIts multiple timeframe RSI indicator Second RSI indicator can be enabled or disabled up on the necessity Second RSI indicator has the ability to set to a different timeframe Perfect for all types of trade (Intraday, Positional, Short term and Long term) Indicadorpor midivelliActualizado 14
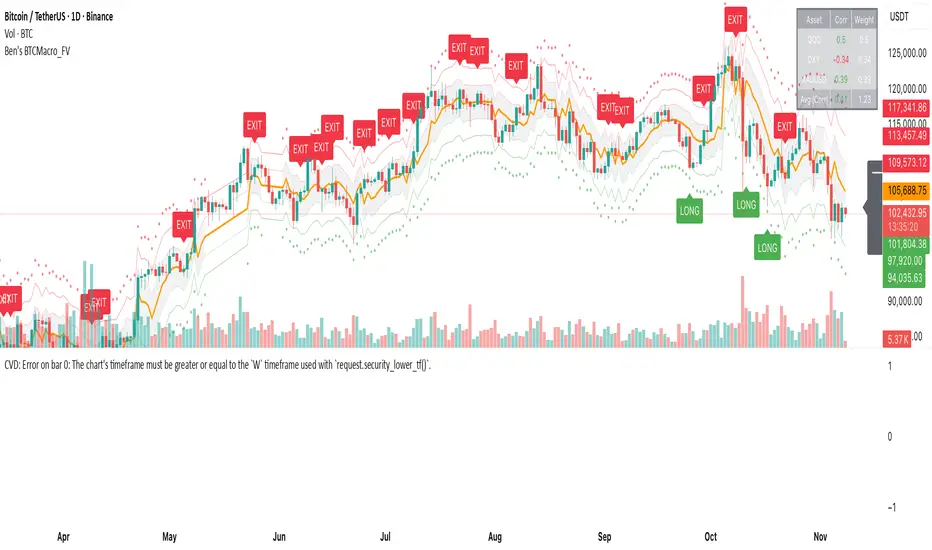
Ben's BTC Macro Fair Value OscillatorBen's BTC Macro Fair Value Oscillator Overview The **BTC Macro Fair Value Oscillator** is a non-crypto fair value framework that uses macro asset relationships (equities, dollar, gold) to estimate Bitcoin's "macro-driven fair value" and identify mean-reversion opportunities. "Is BTC cheap or expensive right now?" on the 4 Hour Timeframe ONLY ### Key Features ✅ **Macro-driven**: Uses QQQ, DXY, XAUUSD instead of on-chain or crypto metrics ✅ **Dynamic weighting**: Assets weighted by rolling coIndicadorpor popularGnuofls716
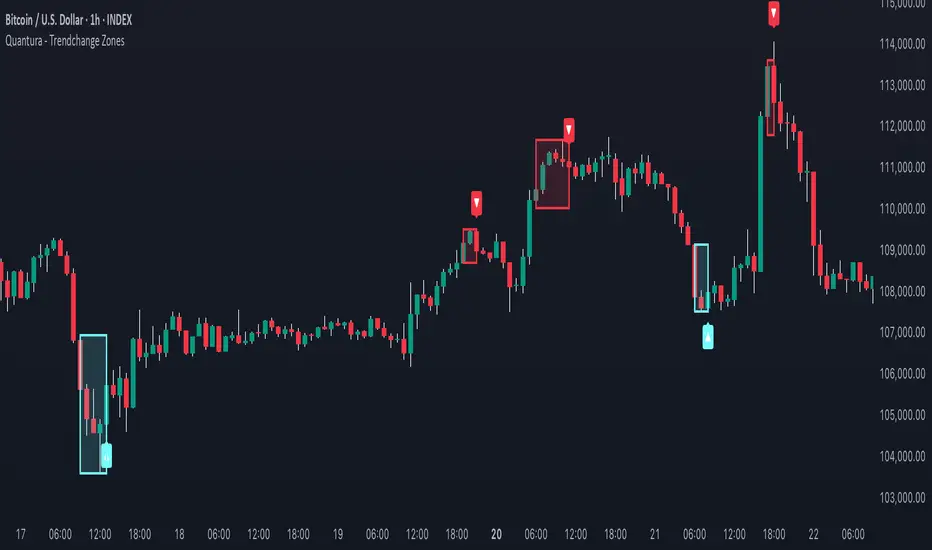
Quantura - Trendchange ZonesIntroduction “Quantura – Trendchange Zones” is an advanced technical indicator that identifies and visualizes potential market reversal zones using dynamic RSI-based logic. It highlights areas of overbought and oversold conditions, marking them as visual zones directly on the price chart, and generates corresponding bullish and bearish signals when the RSI exits these extremes. The tool helps traders anticipate possible trend change regions and confirm momentum shifts in a clean, intuitive way.Indicadorpor Quantura3920
RSI - Ostinato TradingRSI indicator for Ostinato Trading scalping strategy. The classic RSI with special color fills for extremum detection.Indicadorpor Ostinato_trader17
KD-NewAutoTrade for Future Trading - Heikin Ashi candles The KD-NewAutoTrade strategy is a dynamic trend-following indicator designed for scalping and swing trading across crypto, forex, and index futures. It combines the precision of EMA crossovers, RSI momentum, and ADX trend strength to deliver clear Buy/Sell signals with high reliability. 🔹 Core Logic EMA Fast & Slow Crossover – Identifies short-term and long-term trend shifts. RSI Confirmation – Filters out false signals by requiring RSI to cross custom Buy/Sell thresholds. ADX Filter – EnsurIndicadorpor krish16887124
Earnings CountdownAdd to a chart to show a text box with how long to next earnings. Being updated to add functionality from original open source Pine scriptIndicadorpor RotorDaz6
Liquidity & Momentum Master (LMM)💎 Liquidity & Momentum Master (LMM) A professional dual-system indicator that combines: 📦 High-Volume Support/Resistance Zones and 📊 RSI + Bollinger Band Combo Signals — to visualize both smart money footprints and momentum reversals in one clean tool. 🧱 1. High-Volume Liquidity Zones (Support/Resistance Boxes) Conditions Visible only on 1H and higher timeframes (1H, 4H, 1D, etc.) Detects candles with abnormally high volume and strong ATR-based range Separates bullish (support) and bearishIndicadorpor HSeungpyo110
Tristan's Tri-band StrategyTristan's Tri-band Strategy - Confluence Trading System Strategy Overview: This strategy combines three powerful technical indicators - RSI, Williams %R, and Bollinger Bands - into a single visual trading system. Instead of cluttering your chart with separate indicator panels, all signals are displayed directly on the price chart using color-coded gradient overlays, making it easy to spot high-probability trade setups at a glance. How It Works: The strategy identifies trading opportunitiEstrategiapor OhRayOhRay59
RSI Exit + BB-RSI Combo📊 RSI Exit + BB-RSI Combo Indicator This indicator combines RSI overbought/oversold exit signals with Bollinger Band re-entry conditions to highlight potential reversal or retracement zones. 1️⃣ RSI Exit Signal - When RSI drops below 70 after being overbought → 🔴 "RSI" label - When RSI rises above 30 after being oversold → 🟢 "RSI" label - Works on 15m / 30m / 1h / 4h / 1D timeframes 2️⃣ BB-RSI Combo Signal - When an RSI divergence forms and - The candle body re-enteIndicadorpor HSeungpyo99
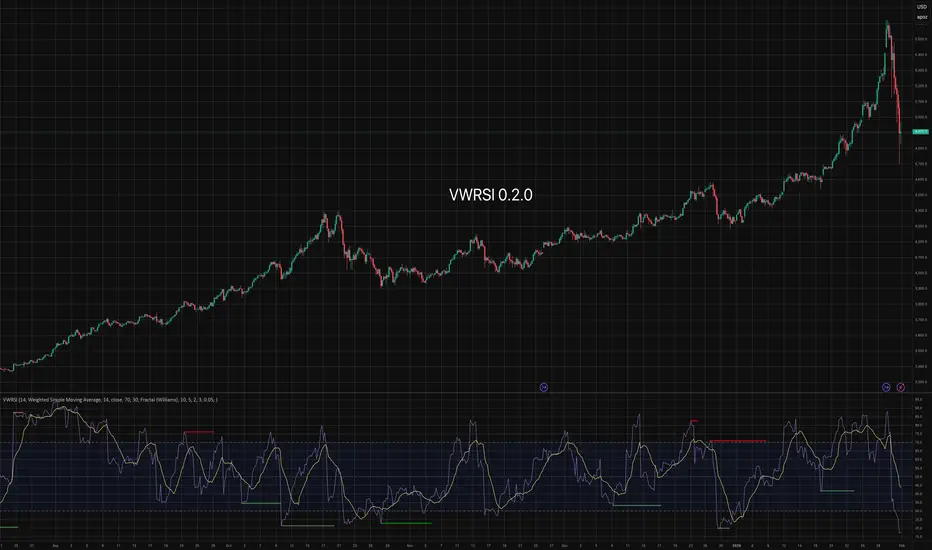
Volume Weighted Relative Strength IndexThis indicator calculates the Relative Strength Index (RSI) and enhances it with optional volume weighting (VWRSI). It also includes a customizable signal line and a built-in divergence detection engine. Key Features: Volume-Weighted Calculation: An option (Volume weighted) allows for volume to be incorporated into the calculation of both the RSI itself and its moving average signal line, making the oscillator more sensitive to high-volume price changes. Customizable Signal Line: Includes an Indicadorpor AustrianTradingMachineActualizado 60
v2.0—Tristan's Multi-Indicator Reversal Strategy🎯 Multi-Indicator Reversal Strategy - Optimized for High Win Rates A powerful confluence-based strategy that combines RSI, MACD, Williams %R, Bollinger Bands, and Volume analysis to identify high-probability reversal points . Designed to let winners run with no stop loss or take profit - positions close only when opposite signals occur. Also, the 3 hour timeframe works VERY well—just a lot less trades. 📈 Proven Performance This strategy has been backtested and optimized on multiple blue-chiEstrategiapor OhRayOhRayActualizado 4914