Barcolor Averaging1. Colors candles or bars, ascending (blue) or descending (red), as determined by the MA setting. 2. Colors candles white when the MA is flat, or the market is moving sideways or in consolidation. Indicadorpor FXEngineering43
Moving Average Colored EMA/3 SMA1. Updated this available script to have 2 SMA's and 2 EMA's. 2. Revised so that plot turns white when flat. 3. Added Trend Gain to control what slope "flat" has for different TF's. Indicadorpor FXEngineeringActualizado 76
SSL Backtester With ATR SL TP and Money ManagementSimilar to other SSL Channel scripts, but this one allows you to set an ATR-derived stop loss and adds the option to risk a % of the equity or used a fixed lot. Enters upon a long or short SSL crossover. FIXED LOTS For 0.01 "lots" use 1000 For 1 standard lot, use 100,000 FOR MONEY MANAGEMENT For 1% risk, enter 0.01 For 10% risk, enter 0.1 etc You should be able to adapt this to any other indicator by just changing the entry conditions and adding your own indicator values. It is not meantEstrategiapor JBTrippin63
Golden Ratio MultiplierThe moving averages 350 and 111 by themselves do a great job of identifying market tops/bottoms. The fraction 350/111 is very close to Pi as well (3.15) so that's is suspicious in its own right. Nonetheless, fibonacci retracements/multiplies of the 350 SMA does a remarkable job of finding reversal points. I commented out a couple of multiplies for simplicity's sake (the lines became rather crowded). However, the script is open source so you all can copy it into Pine Editor and delete the "//" aIndicadorpor RiesterActualizado 186
AK Simple Moving Average 50 days Simple Moving average suitable for Intraday on 1Hr,30Min.15Min Time frames 1. When candle crossing above SMA Line - Go for Long Entries 2. When candle crossing below SMA Line - Go for short Entries Indicadorpor AkashBoopathi120
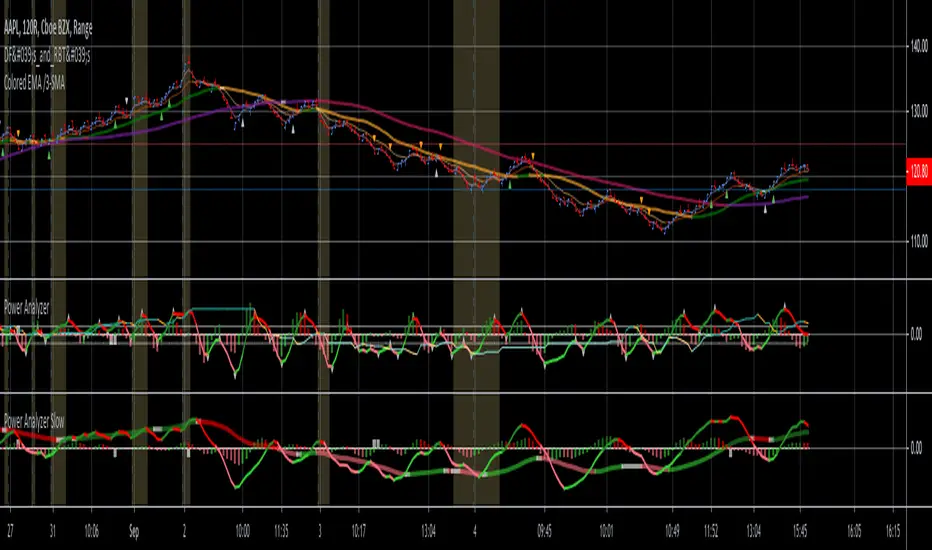
Deep_Fractal_Signals_and_Rubber_Band_TradesThis indicator is based on Williams Fractals and the TopDog Trading "Rubber Band Trade" The Deep Fractal Signals are triangles that indicate the price is forming a pattern of decreasing lows in a down trend (orange) or, increasing highs in an up trend (green). The triangles are placed above or below the last bar of the pattern, unlike Fractals which are drawn 2 candles prior to the current candle, and are re-painted on the chart. When the triangle is indicated above the moving average in a downIndicadorpor FXEngineeringActualizado 3184
MTF SMA on specific timeframe(5M-4H)Japanese below. 日本語の説明は下記 This is multi time frame simple moving average that is shown only on the specific timeframe; 5M, 15M, 30M, 1H, 4H. Problem of conventional MTF moving average is that MTF MA is sometimes annoying especially when you look at upper timeframe such as daily chart and/or weekly chart. e.g. You set 20 MA of 4 hour chart into 1 hour chart, however, when you look at daily chart, daily chart also shows 20MA of 4 hour chart which is unnecessary. This is why I have developed thiIndicadorpor FX365_ThailandActualizado 5389
2-Year MA MultiplierThis script improves on the basic moving average multiplier script by adding inputs for the multiplier and moving average type.Indicadorpor GRDI153
Multi EMA+SMAMulti EMA+SMA with default value of 20/50/200 ... User can change value and color as required... As ema and sma both has same value thats why only three lines are visible, changing value will reflect other Moving averages. Hope it will help my trader friends. Love Indyan...Indicadorpor Indyan4227
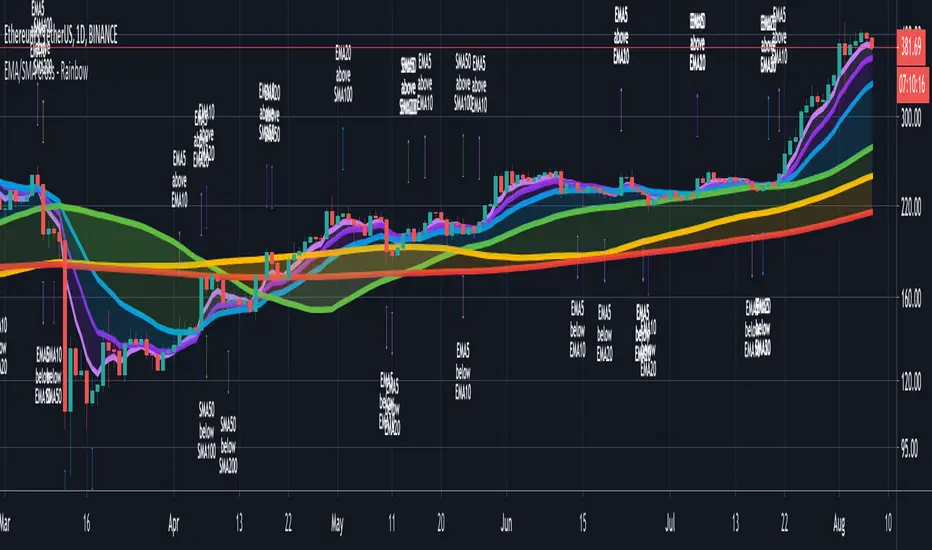
CryptoSignalScanner - Advanced Moving Averages - Cross & RainbowDESCRIPTION: With this script you can plot 6 moving averages. You can decide which Moving Average you want to show or hide. For every plot you can decide to display the Simple Moving Average ( SMA ) or Exponential Moving Average ( EMA ). It provides CrossOver and CrossUnder labels when loading the script. Those labels you can show or hide. You have the possibility to show or hide the rainbow colors. This rainbow function gives you a clear view of the current trend. HOW TO USE: • When one MovinIndicadorpor QuantSignalLabs1184
Hannibal's Quadruple SMA IndicatorFour SMAs, one indicator. Great for the moving average enthusiast. Planning on adding alerts, trade signals, etc. Indicadorpor hannibaltrades12
SMA 9/50/180 | EMA 20 | BUY/SELLAllows for 3 SMAs and One EMA, Combined with Buy/Sell Indicator Defaults to following settings: 9 SMA - Red 50 SMA - Blue 180 SMA - White 20 EMA - Yellow Input Values and Colors can be modified Recommend changes to the Style default -uncheck SMA2 -uncheck Buy/Sell Chart Line Indicadorpor mphillipsvzw26 2.4 K
All EMA & MA in onDas Script zeigt EMA sowie MA 21, 50 ,100, 200 Es sind alle Farben einstellbar sowie die bereiche zwischen EMA und MA als Zone einfärbbar.Indicadorpor Trading_Evolution125
COVID19 New Cases & Threshold per 100k inhabitantsGoal is to be able to keep track of new COVID cases and see when the relative threshold is passed. The default threshold is set to 10 new cases per 100.000 inhabitants per 14-days, please change the available inputs to change this metric Out of curiosity I've added the population density. Because people generally live and socially interact on land I've used the land-area for population density calculation. When comparing metrics between countries there are many more factors to be considered. CIndicadorpor finnActualizado 47
Mayer MultiplesScript that plots the 200 Moving average, and several Mayer Multiple levels in the chart. This may help guestimate TP levelsIndicadorpor cryptocrypte428
Extension from 20 Period Simple Moving AverageSimple indicator to help show when stocks are over extended intraday. It's based on the distance between a stock and it's moving average. The thesis being that, the farther away a stock is from it's 20 period simple moving average, the move extended it is. I've found that when a stock is more than 2-3% extended from it's 5min 20 period moving average, it's typically getting over extended, and can be a great time to start considering a short. I primarily use this indicator when shorting intradayIndicadorpor CapitalMastery5187
Performance ComparatorThis indicator allows to compare the performance (% change) of a given symbol with the larger market ( AMEX:SPY ) and/or with a custom symbol, which defaults to AMEX:XLK (an ETF tracking technology companies from the S&P 500). The performance for the current symbol is displayed as a blue histogram, while performance for the AMEX:SPY and the custom symbol are respectively displayed as orange and white lines, making it easy to spot when the symbol outperformed the market. Features: ConfiIndicadorpor mdeous60
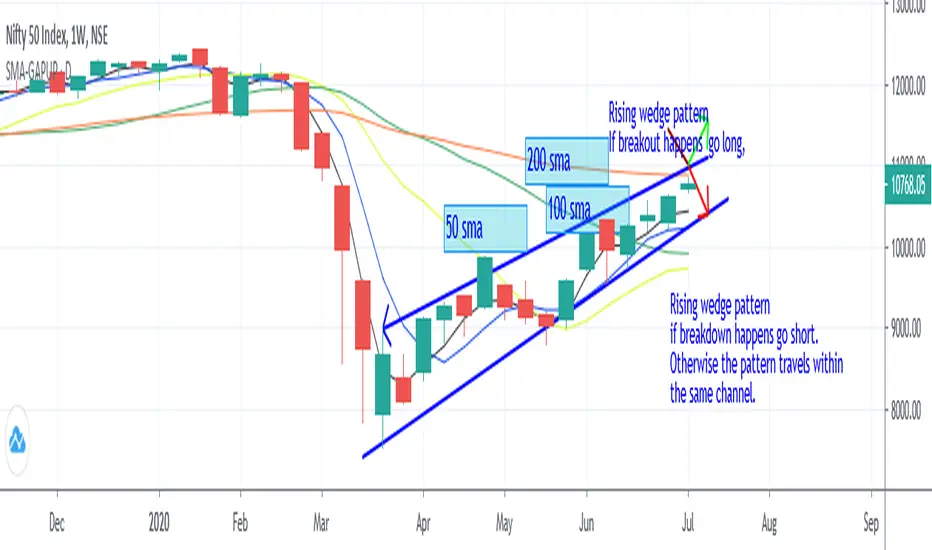
SIMPLE MOVING AVG 10,20,50,100,200 with RESOLUTIONThis indicator is the best than all other sma indicators.Because in just one click you can change all the resolution /time frames for all the sma . Multitime frame analysis can be done in just one click. just change the resolution to 15 min/30 min/1hr- if you intraday trader 1D- LONG TERM INVESTORS. Multi-timeframe analysis (MTF) is a process in which traders can view the same ticker/indicator using a higher time frame than the chart’s, for example, displaying a daily moving average on a one-houIndicadorpor teamGapup1298
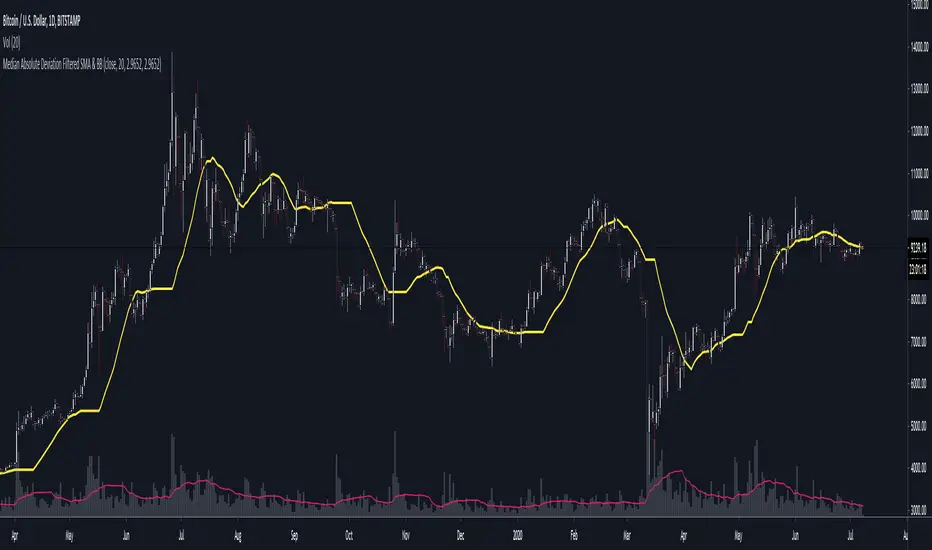
Median Absolute Deviation Filtered SMA & BBMedian Absolute Deviation (MAD) is a robust measurement of variability and more resilient against outliers and small samples. This experiment uses MAD as a means of filtering outliers from an SMA calculation. First we construct the equivalent of a Bollinger Band, but based on the median as the basis and a multiple( k ) of MAD as the outlier cutoff. k can be set a number of ways. As a simple multiple (3 - very conservative / 2.5 - moderately conservative / 2 - poorly conservative). AlternativIndicadorpor rumpypumpydumpy1136
Fancy strategy alerts example [QuantNomad]Alerts on strategies were introduced just recently in TradingView. These alerts have an alert_message placeholder which allows you to compose in PineScript very complex alerts and insert quite a lot of information in them. This is just very simple example of how they can look like. Estrategiapor QuantNomad9384
P-MACD by DGTPrice and Moving Averages Convergence/Divergence, shortly named as P-MACD P-MACD is a trend-following momentum indicator that shows the relationship between Price and Long-term Moving Average (PMACD), and the relationship between two Moving Averages (MAMACD). P-MACD is composed of two lines, and an histogram, showing price distance (convergence/divergence) to its Long-term MA (PMACD), showing short-term MA distance (convergence/divergence) to long-term MA (MAMACD), and a histogram showing thIndicadorpor dgtrdActualizado 13823
多重平均线(Multi Moving Average)This is a Multi Moving Average indicator which redesign and translate for Chinese. 这是一个多重平均线(Multi Moving Average)指标。 本脚本的目的在于帮助使用中文的人了解该指标,特别是其用法。同时将该指标代码添加完整的中文注释,方便使用中文的人学习Pine语言。 平均线是最常用的技术分析方法之一。 本指标的特色 相对于官方提供的平均线,本版本平均线指标有两点特色: 1 可以在图表上一次显示多条(最多6条)移动平均线; 2 支持包括SMA、EMA、WMA、HMA、VWMA、RMA等多种平均线,可以根据自己的需求选择相应的平均线。 *注释 SMA:简单移动平均线 EMA:指数加权移动平均线 WMA:加权移动平均线 HMA:船体移动平均线 VWMA:成交量加权移动平均线 RMA:RSI指标中使用的移动平均线,也叫指数加权移动平均线 指标可调节参数 该指标有六个可设置的参数 1 MA1:默认为5; 2 MA2:默认为13; 3 MA3:默认为20; 4 MA4:默认为40;Indicadorpor samuelx470