QML FTB with Quality Score [Malibu]QML FTB with Quality Score
Overview
QML FTB with Quality Score is an open-source market structure indicator designed to detect Quasimodo (QML) reversal formations and highlight potential First Touch Back (FTB) reaction levels after a confirmed break of structure.
The script is built to be selective rather than frequent. Instead of displaying every possible QML pattern, it filters structure through multiple confluence factors and ranks each setup with a normalized Quality Score. The goal is to help traders focus on cleaner and more meaningful reaction zones rather than treating all reversal structures as equal.
What this indicator does
This indicator scans price action for bullish and bearish Quasimodo formations, confirms the related market structure break, and projects the corresponding left-shoulder area as a potential reaction level.
In practical terms, it is a structure-based reversal and reaction-zone tool that can assist with:
- market structure shifts
- support and resistance transitions
- break-of-structure confirmation
- liquidity-driven reversal analysis
- filtered first-touch retest opportunities
Why this indicator can be useful
Raw QML detection can become noisy because many structures may appear valid at first glance, but not all of them carry the same quality. This script attempts to solve that problem by combining pattern detection with context-based filtering.
Instead of only drawing a shape, it asks additional questions:
- Was the structure break strong enough?
- Is momentum aligned?
- Is there RSI divergence?
- Is there Fair Value Gap confluence?
- Was liquidity swept before the reversal?
- Is the level still fresh and untouched?
That layered process is what makes the script more selective and more practical for traders who prefer structured filtering over raw pattern frequency.
How it works
The script uses a ZigZag-style swing engine to track meaningful highs and lows in price structure. Based on those swings, it evaluates whether the sequence forms a valid Quasimodo transition.
Bullish structure:
- price forms a lower low
- price then breaks the prior key high
- the previous shoulder area becomes the projected bullish QML / FTB level
Bearish structure:
- price forms a higher high
- price then breaks the prior key low
- the previous shoulder area becomes the projected bearish QML / FTB level
Once the structure is identified, the setup can be refined through optional confluence filters. The script then calculates a Quality Score and prints the confirmed level only after bar close.
Filtering logic
1) Body Break Filter
This filter requires the break of structure to happen with candle body confirmation rather than wick-only penetration. Its purpose is to reduce weak or cosmetic breaks and focus on clearer structural shifts.
2) Momentum Filter (EMA)
This filter checks whether the setup is aligned with the broader directional bias using an EMA-based trend condition. Bullish setups are generally stronger when price is positioned in bullish momentum context, while bearish setups are generally stronger when price is positioned in bearish momentum context.
3) RSI Divergence Filter
This filter looks for momentum exhaustion. For bullish setups, it checks whether price pushes lower while RSI fails to confirm that weakness. For bearish setups, it checks the opposite. This is the strictest filter and is meant to isolate higher-selectivity reversal conditions.
4) FVG Confluence
This filter checks whether the projected QML level aligns with a Fair Value Gap area. The aim is to add imbalance context and identify zones where inefficient price delivery may support a reaction.
5) Liquidity Sweep Filter
This filter checks whether the head of the QML structure swept prior liquidity before the reversal. It is meant to capture structural traps and stop-hunt style behavior before a turn.
6) Freshness (FTB) Filter
This filter removes levels that have already been touched or used. Its goal is to keep the focus on first-touch reaction opportunities rather than repeatedly tested zones.
Quality Score logic
The script ranks each setup using a normalized Quality Score.
Current score components:
- RSI Divergence: +30
- FVG Confluence: +25
- Liquidity Sweep: +25
- EMA Momentum Alignment: +20
The total score is normalized according to the filters that are currently active, then displayed as a percentage. This allows the indicator to remain usable even when traders prefer a lighter or stricter filter stack.
What it plots on the chart
The indicator can display:
- a thick horizontal QML entry level
- optional dashed ZigZag structure lines
- bullish and bearish QML labels
- a Quality Score percentage
- an additional symbol when RSI divergence is present
The visual design is intentionally simple so the underlying structure remains readable on chart.
Inputs
ZigZag Sensitivity (default: 13)
Controls how sensitive the swing detection is.
- Lower values produce more swing points and more signals, but also more noise.
- Higher values reduce signal frequency and generally improve selectivity, but can introduce more lag.
Body Break Filter (default: true)
Requires structure breaks to happen with body confirmation.
- Usually lowers signal count
- Usually improves reliability
- Best kept enabled in noisier conditions
Momentum Filter / EMA Filter (default: true)
Restricts setups to those aligned with EMA direction.
- Reduces counter-trend signals
- Makes the script more selective
- Generally improves quality in directional markets
EMA Period (default: 50)
Defines the trend filter length.
- Lower values make the filter more responsive
- Higher values make it smoother and slower
RSI Divergence Filter (default: false)
Allows only setups that also show RSI divergence.
- This is the strictest filter
- Strongly reduces signal frequency
- Best used when only higher-selectivity reversal setups are desired
FVG Confluence (default: true)
Requires the level to align with Fair Value Gap context.
- Filters out some otherwise valid patterns
- Can improve contextual quality in imbalanced markets
Liquidity Sweep Filter (default: true)
Requires evidence of liquidity interaction at the head of the structure.
- Helps isolate trap-like reversal conditions
- Adds selectivity around structural extremes
Freshness (FTB) Filter (default: true)
Rejects previously tested levels.
- Keeps the focus on first-touch setups
- Useful for traders who prefer untouched zones
Line Length (bars) (default: 25)
Controls how far the projected QML level is extended to the right.
- This is a visual setting
- It does not change the signal logic
Which settings matter most
The three most important inputs are:
- ZigZag Sensitivity
- Body Break Filter
- Freshness (FTB) Filter
These settings have the biggest impact on how noisy, selective, and practical the final output becomes.
Suggested usage styles
Balanced / default use
For most users, the default settings are the best place to start. They are designed to provide a practical balance between signal frequency and selectivity.
More aggressive use
For traders who want more setups:
- reduce ZigZag Sensitivity toward 8–10
- consider disabling EMA Filter
- consider disabling FVG Confluence
This can increase opportunity count, but it also increases noise and false positives.
More conservative use
For traders who want fewer but stronger setups:
- keep Body Break Filter enabled
- keep Freshness Filter enabled
- enable RSI Divergence Filter
- focus more on higher-score setups, especially 80%+
This creates a much stricter selection process.
Timeframe behavior
This indicator is generally better suited to M15, H1, H4, and Daily charts.
Suggested sensitivity behavior:
- M15 to H1: 13 to 21 is usually more stable
- H4 to Daily: 8 to 13 is often more responsive without becoming overly delayed
Timeframe notes:
- On M1 and M5, low sensitivity settings can produce excessive noise and weak structure breaks.
- In lower timeframes, Body Break confirmation becomes much more important.
- On higher timeframes, very high sensitivity values can reduce opportunities too much and may introduce unnecessary delay.
Market conditions
The script tends to behave more cleanly in liquid markets where structure is clearer, such as:
- crypto majors
- forex majors
- index products
- other actively traded instruments
In very thin or highly irregular markets, the structural quality of setups may degrade.
Why this indicator may be preferred over simpler alternatives
This script is not intended to be just a basic ZigZag visualizer or a simple Quasimodo marker.
Its main differentiator is the way it combines multiple layers of structure validation into one ranked workflow:
- structure recognition
- body-based break confirmation
- momentum alignment
- divergence context
- FVG context
- liquidity sweep context
- freshness filtering
- normalized quality scoring
Instead of showing every possible shape, it tries to separate weaker structural patterns from more meaningful ones.
What makes this script different
The individual concepts used here are known market-structure concepts, but the practical value of the script comes from how they are combined.
Its distinguishing contribution is the orchestration layer:
- the Quality Score model
- the multi-filter ranking process
- the first-touch freshness workflow
- the compact integration of structure, momentum, liquidity, and imbalance into one decision-support tool
In other words, the script is built on generic market-structure concepts, but its filtering and ranking workflow is specific to this implementation.
How to use it in practice
A common workflow is:
- wait for a level to be confirmed
- monitor the first return into that level
- use the score and filter context to judge whether the setup deserves attention
- avoid treating every printed level as a guaranteed reversal
Many users will find it most useful as a structured decision-support tool rather than as a standalone entry engine.
Technical behavior
- Signals are confirmed on bar close.
- Confirmed levels remain fixed after printing.
- The script does not rely on request.security() in the described signal logic.
- No lookahead-based behavior is used in the signal confirmation process.
- The latest developing pivot may evolve while structure is still forming, but confirmed outputs are only printed after confirmation.
Alerts
The script includes on-close alerts when a new bullish or bearish QML level is confirmed.
Alert messages can include contextual details such as:
- direction
- Quality Score
- divergence state
Limitations
This script is a technical analysis tool, not a prediction engine.
Please keep in mind:
- sideways conditions can generate weaker structural setups
- very low timeframes can create more noise and false breaks
- news-driven volatility can invalidate technical levels quickly
- very low ZigZag Sensitivity settings can make ordinary pullbacks look more important than they really are
- no indicator can guarantee that price will react from every marked level
For that reason, the script is best used as a structured analysis tool rather than as a certainty model. Indicador

Support & Resistance Pro Toolkit [LuxAlgo]The Support & Resistance Pro Toolkit indicator is the ultimate professional structural analysis engine for TradingView, meticulously engineered to provide the definitive solution for modern structural analysis by integrating four sophisticated detection algorithms—Pivots, Donchian Alternating, CSID, and ZigZag—marked by directional triangle signals to identify high-conviction swing points.
This powerhouse tool allows traders to seamlessly toggle between precise level plotting and dynamic ATR-based zones, both featuring a revolutionary security breakout buffer and 25-bar future projections, alongside advanced filtering based on traded volume, liquidity sweeps (marked by prominent dot signals), re-test frequency, and survival duration.
🔶 USAGE
The toolkit identifies significant price structures using one of four sophisticated detection methods. Once a level is identified, it can be displayed as a precise line or a dynamic zone with depth determined by the Average True Range (ATR).
Traders can use this toolkit to filter out market noise by setting minimum requirements for volume, re-tests, or liquidity sweeps. This ensures that only the most significant institutional structures are displayed on the chart.
🔹 Advanced Detection Engines
The foundation of any structural analysis is detection. This toolkit offers four unique methodologies to suit any trading style:
Pivots : The industry-standard approach using left/right strength lookbacks to find peak highs and valley lows.
Donchian (Alternating) : A high-performance state-machine detector. It identifies alternating swings without fixed lag, confirming a previous extreme precisely when price shifts to a new directional state (e.g., a new Higher High confirms the previous Lower Low).
CSID : A momentum-based detector that identifies structural extremes based on a consecutive sequence of N bullish or bearish candles, highlighting areas of strong trend initiation.
ZigZag : A volatility-adjusted method that identifies swings based on a percentage deviation from price, filtering out minor fluctuations and focusing on significant market moves.
🔹 Zone Sizing & The Security Buffer
Structural areas are rarely single prices. This toolkit treats S&R as dynamic regions of interest:
Zone Depth (ATR Mult) : Zones are calculated using the Average True Range (ATR) to ensure they adapt to current market volatility. This sets the thickness from the swing point inwards towards price.
Breakout Buffer (ATR Mult) : A revolutionary "Security Buffer" that extends the zone outwards on the breakout side. This requires price to clear an additional layer of volatility before a breakout is confirmed, significantly reducing "fakeouts" and noise-triggered mitigations.
🔹 Overlap & Structural Hygiene
Keep your charts actionable and clean with institutional-grade overlap management:
Merge Overlapping : When two zones interact, the older zone expands its boundaries to encompass the newer one, creating a "Super Zone" that respects the combined historical context.
Hide Oldest First : Prioritizes the most recent market context by hiding older levels that are overlapped by newer ones.
Hide Youngest First : Respects established, historical structures by ignoring newer, smaller levels that form within the range of existing unmitigated zones.
🔹 Institutional Filtering
Eliminate minor "noise" levels by showing only structures that meet high-conviction criteria:
Price Entries (E) : Shows zones only after they have been re-tested a specific number of times.
Strength (S) : Tracks the number of additional swing points that occur within the zone range during its lifetime.
Sweeps (SW) : Filters for zones that have successfully trapped liquidity through wick-only violations.
Traded Volume (V) : Sums every tick of volume that occurs while price is within the zone, identifying areas of massive institutional participation.
Duration (D) : Requires a level to survive for a minimum number of bars before it is considered a valid structure.
🔶 DETAILS
🔹 Symbols & Analytic Feedback
▲/▼ Triangles : Pinpoint markers at the exact bar of every detected swing high and low.
● Large Dots : Marked at the exact location of "Sweeps"—where price wicks past a boundary but closes back inside, signaling a potential reversal or liquidity grab.
Future Projections : Active, unmitigated levels extend 25 bars beyond the current price action for immediate visual guidance.
Dynamic Shorthand Labels : Positioned at the end of the extension and centered on the zone average, providing a real-time data readout:
E:Entries | S:Strength | SW:Sweeps | V:Volume | D:Duration
🔹 The Performance Dashboard
A 4-column command center providing a side-by-side comparison of structural performance across Support, Resistance, and Totals:
Active / Total : Real-time count of currently valid versus historically detected structures.
Mitigation % : The structural "break rate" of your current settings.
Avg Duration : The average number of bars a level survives before being violated—critical for timing trades.
Avg Volume : The typical "weight" of institutional activity accumulated within zones before they break.
Total Sweeps : A macro-view of liquidity hunting activity on both sides of the market.
🔶 SETTINGS
🔹 Detection Settings
Detection Method : Choose between Pivots, Donchian, CSID, or ZigZag logic.
Swing Sensitivity : Adjusts the lookback or deviation required to confirm a new swing point.
🔹 Zone & Level Sizing
Display Style : Toggles between horizontal levels and ATR-based zones.
ATR Period : Period used for the volatility calculations.
Zone Depth (ATR Mult) : Sets the vertical thickness of the S&R zones.
Breakout Buffer (ATR Mult) : Adds a buffer to the breakout side to filter out false breaks.
🔹 Filtering & Visibility
Overlap Handling : Manages how overlapping zones are displayed (Merge, Hide Oldest, or Hide Youngest).
Max Active (Unmitigated) : Limits the number of unmitigated levels shown on the chart.
Show Broken S&R : Toggles the visibility of levels that have already been mitigated.
Extend Active S&R : Extends active levels into the future for better visibility.
🔹 Minimum Requirements
Min Price Entries : Minimum re-tests required for a level to be visible.
Min Overall Strength : Minimum strength score required based on internal swing points.
Min Sweeps : Minimum liquidity sweeps required.
Min Traded Volume : Minimum accumulated volume required within the zone.
Min Duration (Bars) : Minimum age of the level in bars before display.
Indicador

Smart Money: Auto Order Blocks [identityKa]Overview
The Smart Money: Auto Order Blocks is a professional-grade volume and structural mapping tool designed for SMC (Smart Money Concepts) traders. Order Blocks represent areas where large financial institutions have accumulated significant buy or sell positions. Unlike basic pivot indicators that leave cluttered lines on the chart indefinitely, this script introduces a Smart Mitigation Engine that automatically tracks the validity of these institutional zones in real-time.
Core Mechanics & Detection
The algorithm uses pivot sensitivity to locate origin points of major market imbalances:
Bearish Order Blocks (Supply): Detected at the absolute high of a structural swing before a major downward move. The box is drawn from the wick's high to the highest candle body in that cluster, encapsulating the entire institutional sell zone.
Bullish Order Blocks (Demand): Detected at the absolute low of a structural swing before a major upward move. The box encapsulates the wick's low up to the lowest candle body.
The Smart Mitigation Engine
A fundamental rule of SMC is that once an Order Block is fully pierced and the price closes beyond it, the institutional orders within that zone are considered filled or "Mitigated."
This script constantly monitors the closing price. If a candle strictly closes above a Bearish OB, or strictly below a Bullish OB, the algorithm mathematically invalidates the zone.
Upon mitigation, the box is instantly deleted from the chart, ensuring that only "Fresh" and highly reactive unmitigated zones are visible to the trader. This keeps the workspace incredibly clean.
HUD Dashboard & AI Logic
The on-chart intelligence panel evaluates the proximity of the live price to the active Order Blocks:
Dangerous: Displayed actively whenever the current live price is trading inside the coordinates of an unmitigated Order Block. This serves as a warning that the price is in an institutional high-friction area where sharp rejections and high volatility are imminent.
LONG / SHORT: The engine tracks the macro bias based on the last mitigation event. If a Bearish OB was broken upwards (invalidated resistance), the macro bias shifts to LONG. If a Bullish OB was broken downwards, the bias shifts to SHORT.
How to Use It
This tool provides exceptional context for trade entries. When the AI Suggestion reads "LONG," traders should patiently wait for the price to pull back into a green Bullish OB zone. Once the price enters the zone (triggering the "Dangerous" state), traders can drop to a lower timeframe (e.g., 5-minute) to spot a micro-reversal pattern before executing a trade aligned with the macro trend. Indicador

Dynamic Trendlines & Breakouts [identityKa]Overview
The Dynamic Trendlines & Breakouts is an automated structural analysis tool designed to remove human subjectivity from drawing trendlines. By utilizing mathematical pivot extremes, the script identifies the dominant market geometry in real-time. More importantly, it incorporates a Smart Volume Filter to distinguish between genuine structural breakouts and low-volume retail traps (fakeouts).
Core Engine Mechanics
The indicator operates on two primary algorithmic pillars:
Dynamic Coordinate Mapping: The script calculates the most recent pivot highs and pivot lows based on a user-defined lookback sensitivity. It then draws precision-extended dashed lines connecting these coordinates, forming dynamic Resistance (Upper Line) and Support (Lower Line) boundaries.
Volume-Confirmed Breakouts: The script continuously monitors the closing price relative to these extended lines. However, a crossover is not enough. If the "Volume Confirmation" feature is active, the engine checks a 20-period Simple Moving Average of the volume. A Bullish "B" (Buy) or Bearish "S" (Sell) label is only printed if the breakout candle is accompanied by above-average institutional volume, significantly increasing the probability of trend continuation.
HUD Dashboard & AI Proximity Logic
The integrated on-chart panel tracks the last confirmed breakout state and utilizes an ATR-based proximity sensor to generate the AI Suggestion:
Dangerous: Displayed actively whenever the current price is within a 0.5 Average True Range (ATR) distance of either the upper or lower trendline. This alerts the trader that the price is actively testing a major structural boundary, making new entries highly risky until a clear bounce or volume-confirmed breakout occurs.
LONG / SHORT: Triggered when the last structural breakout was Bullish (LONG) or Bearish (SHORT), provided the price is safely trending away from the immediate resistance/support lines.
How to Use It
This tool is ideal for momentum and breakout traders. When the price approaches a trendline (AI Suggestion reads "Dangerous"), prepare for a setup. Do not front-run the breakout. Wait for the engine to print the "B" or "S" label, confirming that both the structural level has been breached and the volume supports the move. Once confirmed, trade in the direction of the new momentum. Indicador

Liquidity Magnet Zones [identityKa]Overview
The Liquidity Magnet Zones is an advanced Smart Money Concepts (SMC) indicator that identifies and manages unmitigated pools of liquidity. Institutional algorithms gravitate toward liquidity to fill large orders. This script mathematically plots these high-probability areas—Buy Side Liquidity (BSL) and Sell Side Liquidity (SSL)—and actively manages them, deleting zones the moment they are "swept" to keep the chart clean and relevant.
Core Mechanics: BSL & SSL Detection
The engine uses pivot point analysis to map market extremes:
Buy Side Liquidity (BSL): Formed at major structural highs. Retail traders typically place stop-losses (buy-to-cover orders) above these highs. The script identifies these unmitigated peaks and draws a dashed line projecting into the future.
Sell Side Liquidity (SSL): Formed at major structural lows. Retail traders place sell-stop orders below these lows. The script tracks these valleys as magnetic targets for price action.
Smart Mitigation (The Sweep Engine)
Unlike static drawing tools, this indicator constantly evaluates the live price against the drawn liquidity zones.
If a candlestick wick or body pierces a BSL or SSL line, the liquidity is considered "Swept" (mitigated).
The script instantly removes the line from the chart, triggering a real-time alert that institutional orders have likely been absorbed, opening the door for a structural reversal.
HUD Dashboard & Post-Sweep AI Logic
The integrated on-chart panel evaluates the structural bias based on the most recent liquidity event:
Dangerous: Displayed actively while the price is piercing and sweeping a liquidity line. This warns traders that extreme volatility is present as stop-losses trigger, making it highly risky to enter breakout trades.
SHORT: Triggered after BSL has been swept. SMC logic dictates that Smart Money forces price upward to trigger buy-stops, providing the necessary liquidity to execute large sell orders. Therefore, the post-sweep bias becomes Bearish (SHORT).
LONG: Triggered after SSL has been swept. Smart Money forces price downward to trigger sell-stops, allowing them to accumulate buy orders. The post-sweep bias becomes Bullish (LONG).
How to Use It
This tool is designed for reversal and mitigation trading, not breakout trading. Do not blindly place limit orders at BSL or SSL lines. Instead, wait for the price to hit the line (AI Suggestion reads "Dangerous"). Drop to a lower timeframe (e.g., 1m or 5m) and look for a Change of Character (CHoCH) confirming that Smart Money is indeed reversing the trend after engineering liquidity. Indicador

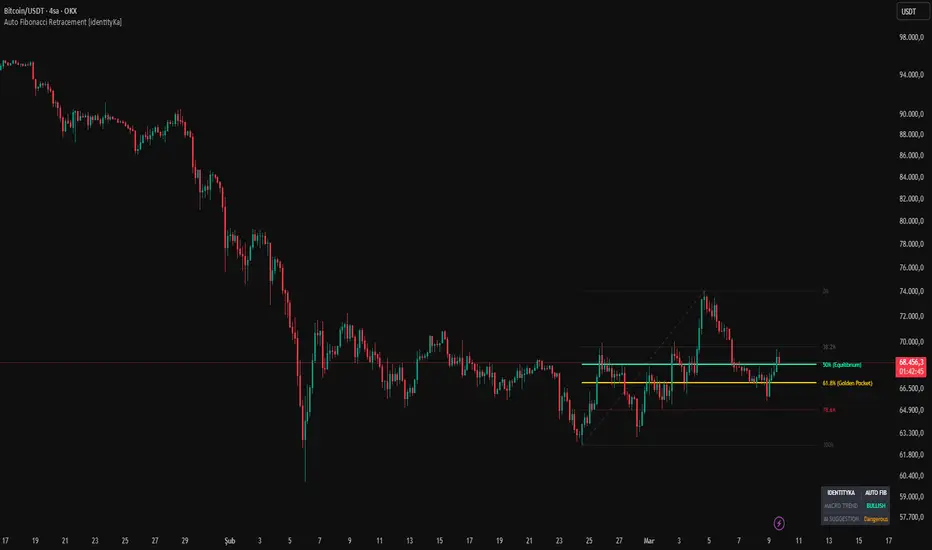
Auto Fibonacci Retracement [identityKa]Overview
The Auto Fibonacci Retracement is a dynamic structural mapping tool designed to automate the process of drawing Fibonacci levels. By continually scanning historical price action over a user-defined lookback period, the script identifies the dominant macroeconomic Swing High and Swing Low. It then mathematically constructs the retracement zones in real-time, completely removing human subjectivity from technical analysis.
Core Mathematical Engine
The script utilizes the ta.highest and ta.lowest functions coupled with a structural array system to ensure flawless historical anchoring:
Trend Directionality: The script determines the current macro trend by calculating the chronological offset between the absolute High and absolute Low. If the Low occurred chronologically before the High, it establishes a Bullish bias and draws the Fibonacci ratios from bottom to top. Conversely, it draws from top to bottom for a Bearish bias.
Level Generation: Utilizing standard percentage retracements, the engine strictly plots the 0.382, 0.500 (Equilibrium), 0.618 (Golden Pocket), and 0.786 (Deep Retracement) levels. The lines are drawn using a smart array management system that clears old lines and strictly plots the active data on the live bar to prevent chart lag and clutter.
HUD Dashboard & AI Logic
To assist in reading the Fibonacci zones, an integrated on-chart panel evaluates the relationship between the live closing price and the drawn retracement levels:
Dangerous: Displayed whenever the current price enters the zone between the 0.382 and the 0.618 (Golden Pocket) levels. This area represents deep institutional retracement and is mathematically the highest-risk zone for trend-continuation entries, as the market is actively deciding whether to bounce or reverse.
LONG / SHORT: The engine defaults to the macro trend direction ("LONG" in an uptrend, "SHORT" in a downtrend) as long as the price remains confidently outside the deep retracement zone (e.g., above the 0.382 in a bullish trend), signifying that the primary momentum remains intact. If the deep 0.786 level is broken against the trend, the script will mathematically flip the bias, assuming a structural reversal.
How to Use It
Traders should use this script to automate their top-down analysis. Rather than manually redrawing Fibonacci levels as new highs or lows are made, this indicator updates dynamically. During an established trend, traders should look for the AI Suggestion to switch to "Dangerous" (indicating price has entered the Golden Pocket) and await a definitive candlestick rejection pattern off the 0.500 or 0.618 level before re-entering the market in the direction of the macro trend. Indicador

Auto Dynamic S/R Zones Pro [identityKa]Overview
The Auto Dynamic S/R Zones Pro is a structural Price Action utility that automatically identifies, draws, and manages Supply (Resistance) and Demand (Support) liquidity zones. Unlike traditional pivot indicators that draw single horizontal lines, this script constructs volumetric "boxes" to represent areas of historical institutional interest. Furthermore, it incorporates a Smart Mitigation Engine that automatically cleans the chart by deleting zones once they have been functionally broken or fully mitigated by price action.
Core Zone Calculation Methodology
The script utilizes historical pivot detection (ta.pivothigh and ta.pivotlow) based on a user-defined lookback/lookforward sensitivity. Once a structural extreme is found, the engine calculates the boundaries of the zone to capture the entire rejection area rather than just the wick tip:
Resistance Zones (Supply): The top of the box is anchored to the absolute high of the pivot candle. The bottom of the box is calculated using the maximum value between the open and close of that same candle (capturing the wick-to-body spread).
Support Zones (Demand): The bottom of the box is anchored to the absolute low of the pivot candle. The top of the box is calculated using the minimum value between the open and close (capturing the lower wick-to-body spread).
The Smart Mitigation Engine (Chart Cleanup)
To prevent chart clutter and outdated data, the script utilizes dynamic arrays to manage the drawn boxes.
The script continuously monitors the closing price relative to all active zones.
If a candlestick closes strictly above the upper boundary of a Resistance box, or strictly below the lower boundary of a Support box, the zone is mathematically considered "Mitigated" (broken).
Upon mitigation, the script instantly deletes the box and its associated label from the chart history, firing a breakout alert and leaving only fresh, untested zones visible.
HUD Dashboard & AI Logic
The integrated on-chart panel evaluates the immediate relationship between the current price and the active S/R arrays:
Dangerous: Triggered whenever the current closing price is actively printing inside the coordinates of any active Support or Resistance box. This indicates price is in a high-friction decision zone where rejections are highly probable.
LONG / SHORT: The engine tracks the most recent structural breakout. If the last mitigated zone was a Resistance, it adopts a "LONG" bias indicating bullish structure. If the last mitigated zone was a Support, it adopts a "SHORT" bias indicating bearish structure, provided the price is not currently stuck inside another zone.
How to Use It
This indicator simplifies top-down analysis. Traders can use a higher timeframe (e.g., 1H or 4H) to let the script automatically map out major untested supply and demand zones. When the price enters an active zone (triggering the "Dangerous" AI state), traders can drop to a lower timeframe to look for reversal patterns. Alternatively, traders can trade the momentum of the breakouts by setting alerts for when a zone is officially broken/mitigated. Indicador

Smart Pivot Reversals [identityKa]Overview
The Smart Pivot Reversals is a structural Price Action indicator designed to automatically detect and highlight market swing highs (Tops) and swing lows (Bottoms). Instead of relying on lagging moving averages to find reversals, this script uses raw bar-by-bar analysis to identify local structural extremes. To increase signal reliability, it includes optional, mathematically strict filters for macro-trend alignment and momentum exhaustion.
Underlying Concepts & Calculations
At its core, the indicator utilizes the standard ta.pivothigh and ta.pivotlow functions. The detection mechanism is entirely governed by two user-defined parameters:
Left Bars (Sensitivity): The number of preceding bars that must have a lower high (for a Top) or a higher low (for a Bottom). A smaller number detects micro-swings, while a larger number identifies major structural points.
Right Bars (Confirmation): The number of subsequent bars required to validate the pivot. Note on Visualization: The script uses a negative offset equal to the "Right Bars" value. This means the "TOP" or "BOTTOM" label is plotted exactly on the pivot candle historically, only after the confirmation bars have closed.
Smart Validation Filters (Optional Logic)
To filter out noise in ranging markets, traders can enable two concurrent mathematical filters:
Macro Trend Filter (EMA): When activated, the script calculates a standard Exponential Moving Average (default length 200). A pivot low (Bottom) is only validated if the closing price is strictly above the EMA (identifying pullbacks in an uptrend). A pivot high (Top) is only validated if the closing price is strictly below the EMA.
Momentum Strict Mode (RSI): When activated, the script checks the Relative Strength Index (default length 14) at the exact moment the pivot is confirmed. A Top is only valid if the RSI is in the Overbought zone (≥70). A Bottom is only valid if the RSI is in the Oversold zone (≤30).
HUD Dashboard & State Tracker
The script features a built-in, customizable on-chart panel that aggregates the last confirmed structural pivot and outputs an AI-style state suggestion:
LONG: Triggered and sustained when the last confirmed structure was a valid BOTTOM.
SHORT: Triggered and sustained when the last confirmed structure was a valid TOP.
Dangerous: Displayed during periods of transition or neutral states before a definitive structure is confirmed.
How to Use It
This tool is highly effective for traders utilizing Price Action methodologies, particularly on intraday charts (such as 15-minute or 1-hour timeframes). The printed Top/Bottom labels serve as excellent objective points for drawing support/resistance zones or trendlines. Traders can use the optional EMA and RSI filters to mechanically ignore counter-trend setups and only focus on high-probability reversal structures that align with the broader market context. Indicador

Indicador
Indicador
BTC Round Levels For 500/1000BTC Round Levels 500 / 1000 – Psychological Price Structure Tool
BTC Round Levels automatically plots key psychological price levels based on 500 and 1000 increments. These levels represent areas where liquidity, order flow, and trader attention naturally concentrate.
Financial markets are driven by human behavior and algorithmic systems built around that behavior. Round numbers such as 60,000, 60,500, or 61,000 are not random — they act as psychological anchors. Because traders consistently place stop losses, take profits, breakout entries, and limit orders around these clean numbers, they become areas of repeated reaction.
This indicator systematically displays those levels around the current price, helping traders maintain structural awareness without manually drawing lines.
Why Round Levels Matter
Psychological Anchoring
Market participants naturally gravitate toward clean numbers instead of irregular prices. This creates clustering of orders.
Liquidity Concentration
Large players often target areas where retail orders accumulate. Round levels frequently act as liquidity pools.
Volatility Expansion
Breaks of major 1000 levels often trigger stop cascades and momentum moves.
Repeated Market Reactions
These levels often act as support, resistance, rejection zones, or breakout points.
What This Indicator Provides
Automatic plotting of 500 increment levels
Clear distinction of major 1000 increment levels
Adjustable number of levels above and below current price
Optional price labels
Clean and minimal structure
Use Cases
Intraday trading
Futures trading
Breakout strategies
Liquidity-based trading
Structure-based execution
Risk-to-reward planning
This tool helps maintain market structure clarity in volatile conditions, particularly in BTC where psychological levels frequently influence price behavior. Indicador

Indicador

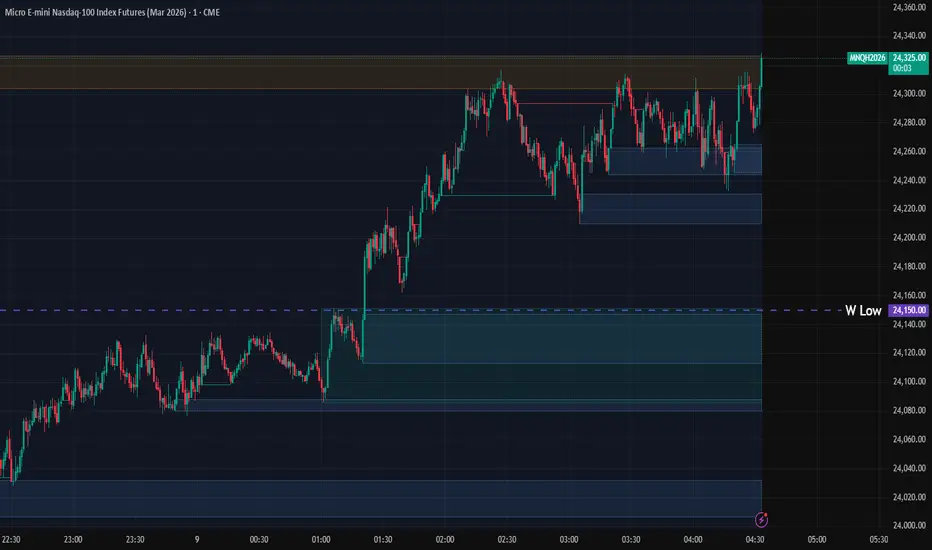
GEX Levels for NQ/NDX/QQQ Gamma ExposureDESCRIPTION
━━━━━━━━━━━━━━━━━━━━━━━━━━━━
A professional framework for Gamma Exposure analysis on NASDAQ-100 instruments.
━━━━━━━━━━━━━━━━━━━━━━━━━━━━
WHAT THIS INDICATOR DOES
This indicator visualizes key strategic levels derived from Gamma Exposure (GEX) analysis — the zones where dealer hedging flows create measurable support and resistance.
What you see:
- Call Walls — resistance zones where dealers hedge against upside
- Put Walls — support zones where dealers hedge against downside
- Zero Gamma — the structural pivot between mean-reversion and trend
- Expected Move bands — statistical range boundaries
- GEX Histogram — gamma distribution profile directly on chart
━━━━━━━━━━━━━━━━━━━━━━━━━━━━
WORKS OUT OF THE BOX
The indicator ships with pre-loaded 5DTE weekly GEX levels — add it to your chart and you'll see levels immediately. No setup, no copy/paste needed. We refresh the built-in data every week.
If you have access to more frequent data (0DTE, intraday), paste it into the GEX Data field in settings — your data always takes priority. Clear the field to fall back to the built-in weekly levels.
Pre-loaded PDH/PDL reflect the session at time of update. Fresh daily structure levels require pasting updated data.
Daily 0DTE data updates available soon via invite-only version — DM for early access.
━━━━━━━━━━━━━━━━━━━━━━━━━━━━
KEY FEATURES
▸ Ticker Switcher
Select NQ, NDX, or QQQ directly in settings.
Data converts automatically (NQ-NDX spread: 40 pts, QQQ ≈ NDX/40).
One script, three instruments.
▸ GEX Profile Histogram
See gamma distribution as horizontal bars on your chart.
Instantly spot where positioning clusters.
▸ Color Themes
Choose between Boreal, Classic, or Lady Trader palettes.
▸ Level Toggles
Show/hide level groups independently:
GEX Levels | System Levels | Structure Levels
▸ Rich Tooltips
Hover for details: GEX values, Call/Put ratio, Hold/Break probabilities.
▸ Flip Detection
When price crosses a level, it automatically updates role and style (solid → dashed).
▸ GEX Threshold Filter
Hide weak levels below a minimum magnitude to focus on significant zones.
▸ Smart Level Distribution
Levels are equally split above/below spot, with closest levels always protected from max limit.
▸ Alert System
Get notified when price crosses key GEX levels. Alerts are pre-configured for the built-in 5DTE levels.
━━━━━━━━━━━━━━━━━━━━━━━━━━━━
HOW TO READ THE LEVELS
Each line represents a zone where price reaction is statistically probable:
- Thick solid lines = level not yet crossed
- Dashed lines = level flipped (price crossed through)
- Cyan/Teal or Green = potential support (Put Walls)
- Pink/Red = potential resistance (Call Walls)
- Gray = structural levels (Zero Gamma, Vol Bands, PDH/PDL)
The indicator shows structure, not predictions.
Use it to identify where the market is likely to react — not which direction it will go.
━━━━━━━━━━━━━━━━━━━━━━━━━━━━
PRO TIP: CONFLUENCE
This tool is most powerful when combined with your own analysis.
Highest-probability setups occur when GEX levels align with:
Price action zones (support/resistance, order blocks)
Volume Profile (HVN/LVN, VWAP)
Technical structure (prior highs/lows, trend lines)
One level alone is information. Confluence is edge.
━━━━━━━━━━━━━━━━━━━━━━━━━━━━
DISCLAIMER
This tool is for informational and educational purposes only.
It does not constitute financial advice. Trading involves significant risk.
Past structure does not guarantee future behavior.
━━━━━━━━━━━━━━━━━━━━━━━━━━━━
DATA FORMAT REFERENCE (for DIY users)
The GEX Data input field accepts a formatted string: L:levels|P:profile
— L: section = level lines on the chart
— P: section = GEX profile bars (horizontal histogram)
— Separated by |P:
LEVELS (L: section):
strike,type,label,tooltip,magnitude — separated by semicolons
— strike: price in NQ terms (integer)
— type: CW (Call Wall), PW (Put Wall), ZG (Zero Gamma), MP (Max Pain), EH/EL (Expected Move), VH/VL (Vol Bands), PDH/PDL/PWH/PWL (Structure)
— label: display name
— tooltip: hover text (use ~ for line breaks)
— magnitude: GEX in millions (0 for non-GEX levels)
PROFILE (P: section):
strike,score,sign — separated by semicolons
— score: -10 to 10
— sign: 1 = call-dominant, -1 = put-dominant
DIY workflow:
— Get a delayed options chain (any broker or public data provider)
— Filter to target expiry
— For each strike: Gamma via Black-Scholes, then GEX = Gamma × OI × 100 × Spot²
— Rank by magnitude, normalize scores 0-10
— Paste into Settings → GEX Data
Latest Levels Update 2026-03-08 - 5DTE Exp Indicador

Indicador

EdgeGate Premarket Breakout LevelsOverview
EdgeGate™ Premarket Breakout Levels is designed for traders who use a premarket breakout strategy and want a simple way to visualize the key levels that often drive early-session momentum.
The indicator automatically plots:
Premarket High
Premarket Low
Previous New York Session High
Previous New York Session Low
These levels help traders quickly identify potential breakout zones, liquidity areas, and key intraday structure without needing to manually mark sessions each day.
What the Indicator Shows
Premarket High / Low
During the premarket session (default 04:00–09:30 ET), the indicator continuously tracks the session range and plots:
Premarket High
Premarket Low
Once the premarket session closes, these levels become fixed and extend across the trading day.
These levels are commonly used by traders watching for premarket breakout setups after the opening bell.
Previous NY Session High / Low
The indicator also plots the previous regular New York session range (09:30–16:00 ET):
Prev NY High
Prev NY Low
These levels often act as important areas of:
support and resistance
liquidity sweeps
breakout continuation or rejection zones
How Traders Use These Levels
Traders using a premarket breakout strategy typically watch for:
Price consolidating below Premarket High before a breakout
Momentum moves through Premarket Low for downside continuation
Reactions at Previous NY Session High or Low
Liquidity sweeps before trend continuation
This indicator helps keep those reference levels clearly visible throughout the trading session.
Customization
Users can customize:
Premarket session times
Line colors
Line styles (solid, dashed, dotted)
Line thickness
This allows the levels to be styled to match individual chart layouts.
🟣 About EdgeGate™
EdgeGate™ builds tools around one principle:
Structure. Liquidity. Execution.
We focus on developing precision-based session and liquidity frameworks designed for intraday traders who care about context, not clutter.
This is Version 1.0.0 of the EdgeGate™ public toolkit — released free to the TradingView community.
More session tools and execution-focused models coming soon.
🟣 Version
EdgeGate™ Premarket Breakout Levels
Version: 1.0.0
Release Type: Initial Public Release
Status: Stable
Build Philosophy: Clean session structure only
Included in v1.0.0
Premarket High / Low tracking (ET)
Previous NY Session High / Low tracking (ET)
Live Premarket High / Low plotting during premarket
Locked Premarket levels after session close
Previous NY session High / Low displayed on current chart
Customizable line colors, widths, and styles
Session-based level framework designed for premarket breakout traders
🟣 Release Standard (EdgeGate™ Framework)
All EdgeGate™ public tools will follow a structured release format:
Version number
Release type (Major / Minor / Patch)
Documented feature set
Defined behavioral philosophy
Transparent future roadmap
🆓 Open Source
This script is released free and open-source for the community.
You’re welcome to modify, improve, and build upon it respectfully.
⚠️ Disclaimer
For educational purposes only.
Not financial advice. Indicador

NIFTY 5-STAR Buy/Sell Indicator | Entry, SL & TargetsThis indicator is designed to identify high-probability intraday trading opportunities by combining trend confirmation, volume strength, and strict filtering rules.
It generates Strong BUY and Strong SELL signals only when multiple market conditions align.
The goal is to help traders take disciplined trades with predefined risk and target levels.
Core Strategy Logic
A signal is generated only when price aligns with four key trend indicators simultaneously.
The system checks:
EMA 21 – Short-term trend direction
VWAP – Institutional average traded price
VWMA 20 – Volume-weighted momentum confirmation
Supertrend – Trend direction and dynamic stop loss level
A signal appears only when price is positioned on the same side of all these indicators.
Buy Signal Conditions
A Strong BUY signal is generated when:
Price is above EMA 21
Price is above VWAP
Price is above VWMA 20
Price is above Supertrend
3-minute volume is greater than the minimum volume threshold
This indicates strong bullish momentum supported by market participation.
Sell Signal Conditions
A Strong SELL signal appears when:
Price is below EMA 21
Price is below VWAP
Price is below VWMA 20
Price is below Supertrend
3-minute volume is above the minimum threshold
This confirms strong bearish momentum.
Time-Based Trade Filter
Signals are allowed only during active market hours:
9:31 AM – 3:00 PM
This avoids:
opening volatility
illiquid late-session trades
One Signal Per Day Rule
The system generates only one signal per day.
Once a BUY or SELL signal appears, the indicator will not generate another signal on the same trading day.
This helps prevent overtrading and noise.
Stop Loss Logic
The Supertrend line acts as the Stop Loss.
On the chart:
Yellow Line = Stop Loss
This makes the stop loss dynamic and trend-based.
Target Logic
Targets are calculated based on the distance between entry price and stop loss.
Target formula:
Target = Entry ± Risk
Where:
Risk = | Entry − Supertrend |
On the chart:
Orange Line = Target
Risk-Reward Ratio
The strategy currently targets:
Risk : Reward = 1 : 1
Example:
Entry = 24,600
Stop Loss = 24,560
Risk = 40 points
Target = 24,640
Reward = 40 points
Best Use Case
This indicator works best for:
Intraday index trading
Momentum continuation setups
NIFTY / BANKNIFTY futures
3-minute to 15-minute charts
Trading Philosophy
The idea behind this system is simple:
Trade only when trend, momentum, and volume align.
Instead of chasing random moves, the indicator waits for strong conditions and provides:
Entry signal
Stop loss level
Target level
This creates a complete structured trade plan on the chart. Indicador

Indicador

Indicador
Indicador

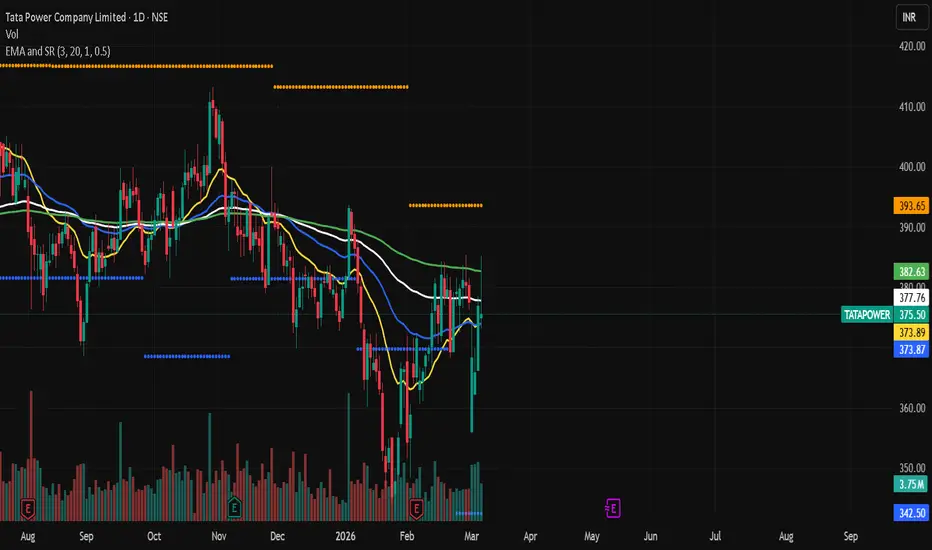
Quadruple EMA with Support and Resistance# EMA Trend + Support & Resistance Strategy
## Overview
A clean, rule-based trading strategy designed for the **Daily timeframe**. It uses four Exponential Moving Averages (EMA 20, 50, 100, 200) as a trend filter combined with dynamic Support & Resistance levels to identify high-probability breakout and breakdown setups.
The logic is intentionally simple — no indicators stacked on indicators, no complex filters. Just price, trend direction, and key levels.
---
## How It Works
### Entry — Long (CE / Buy)
A long entry is triggered when:
- Price closes **above all four EMAs** (20, 50, 100, 200) — confirming strong bullish trend alignment
- Price **breaks above the previous bar's high** — confirming momentum and breakout
### Entry — Short (PE / Sell)
A short entry is triggered when:
- Price closes **below all four EMAs** (20, 50, 100, 200) — confirming strong bearish trend alignment
- Price **breaks below the previous bar's low** — confirming momentum and breakdown
### Exit Logic
- **Stop Loss** — set at the previous bar's low (for longs) or previous bar's high (for shorts)
- **Target** — calculated using the configurable Risk:Reward Ratio (default 3:1)
- **EMA-based dynamic exit** — if price closes below EMA 20 or EMA 50 (for longs), or above EMA 20 or EMA 50 (for shorts), the stop is tightened to force an exit on the next bar, protecting open profit
- **Optional Trailing Stop Loss** — activates after a defined profit % is reached, then trails at a set % distance from the peak
---
## Indicators on Chart
| Line | Color | Meaning |
|------|-------|---------|
| EMA 20 | Yellow | Fast trend / momentum |
| EMA 50 | Blue | Mid-term trend |
| EMA 100 | White | Medium-long trend support |
| EMA 200 | Green | Long-term trend direction |
| Resistance | Orange dots | Swing high levels |
| Support | Blue dots | Swing low levels |
| ▲ Green arrow | Below bar | Long (CE) entry signal |
| ▼ Red arrow | Above bar | Short (PE) entry signal |
---
## Settings
| Input | Default | Description |
|-------|---------|-------------|
| Risk Reward Ratio | 3.0 | Target = Entry + (RR × Risk) |
| Show Support/Resistance | On | Toggle S/R level plots |
| Swing Detection Bars | 20 | Lookback bars for pivot detection |
| One Trade Per Day | On | Limits to one CE and one PE per day |
| Use Trailing Stop Loss | Off | Enable trailing SL after activation |
| Trailing Activation % | 1.0% | Profit % before trailing SL kicks in |
| Trailing Distance % | 0.5% | Distance the trailing SL follows from peak |
---
## Best Used On
- **Timeframe:** Daily (recommended), Weekly
- **Instruments:** Stocks, Indices, ETFs
- Works well on trending instruments where EMA stacking is meaningful
---
## Notes
- This strategy does **not** use candle body filters, volume filters, or session time windows — keeping it universally applicable across timeframes and instruments
- One trade per direction per day is enforced by default to avoid overtrading
- Both CE (long) and PE (short) trades cannot be open simultaneously
---
⚠️ **Disclaimer:** This strategy is for educational and backtesting purposes only. Past performance does not guarantee future results. This is not financial advice. Always do your own research and consult a qualified financial advisor before making any trading decisions. Estrategia

20,50,100, 200 EMA with support and resistance
Overview
A clean, rule-based trading strategy designed for the **Daily timeframe**. It uses four Exponential Moving Averages (EMA 20, 50, 100, 200) as a trend filter combined with dynamic Support & Resistance levels to identify high-probability breakout and breakdown setups.
The logic is intentionally simple — no indicators stacked on indicators, no complex filters. Just price, trend direction, and key levels.
How It Works
Entry — Long (CE / Buy)
A long entry is triggered when:
- Price closes **above all four EMAs** (20, 50, 100, 200) — confirming strong bullish trend alignment
- Price **breaks above the previous bar's high** — confirming momentum and breakout
Entry — Short (PE / Sell)
A short entry is triggered when:
- Price closes **below all four EMAs** (20, 50, 100, 200) — confirming strong bearish trend alignment
- Price **breaks below the previous bar's low** — confirming momentum and breakdown
Exit Logic
- Stop Loss — set at the previous bar's low (for longs) or previous bar's high (for shorts)
- Target — calculated using the configurable Risk: Reward Ratio (default 3:1)
- EMA-based dynamic exit — if price closes below EMA 20 or EMA 50 (for longs), or above EMA 20 or EMA 50 (for shorts), the stop is tightened to force an exit on the next bar, protecting open profit
- Optional Trailing Stop Loss — activates after a defined profit % is reached, then trails at a set % distance from the peak
Indicators on Chart
| Line | Color | Meaning |
|------|-------|---------|
| EMA 20 | Yellow | Fast trend / momentum |
| EMA 50 | Blue | Mid-term trend |
| EMA 100 | White | Medium-long trend support |
| EMA 200 | Green | Long-term trend direction |
| Resistance | Orange dots | Swing high levels |
| Support | Blue dots | Swing low levels |
| ▲ Green arrow | Below bar | Long (CE) entry signal |
| ▼ Red arrow | Above bar | Short (PE) entry signal |
---
Settings
| Input | Default | Description |
|-------|---------|-------------|
| Risk Reward Ratio | 3.0 | Target = Entry + (RR × Risk) |
| Show Support/Resistance | On | Toggle S/R level plots |
| Swing Detection Bars | 20 | Lookback bars for pivot detection |
| One Trade Per Day | On | Limits to one CE and one PE per day |
| Use Trailing Stop Loss | Off | Enable trailing SL after activation |
| Trailing Activation % | 1.0% | Profit % before trailing SL kicks in |
| Trailing Distance % | 0.5% | Distance the trailing SL follows from peak |
---
Best Used On
- **Timeframe:** Daily (recommended), Weekly
- **Instruments:** Stocks, Indices, ETFs
- Works well on trending instruments where EMA stacking is meaningful
---
Notes
- This strategy does **not** use candle body filters, volume filters, or session time windows — keeping it universally applicable across timeframes and instruments
- One trade per direction per day is enforced by default to avoid overtrading
- Both CE (long) and PE (short) trades cannot be open simultaneously
---
⚠️ **Disclaimer:** This strategy is for educational and backtesting purposes only. Past performance does not guarantee future results. This is not financial advice. Always do your own research and consult a qualified financial advisor before making any trading decisions. Estrategia

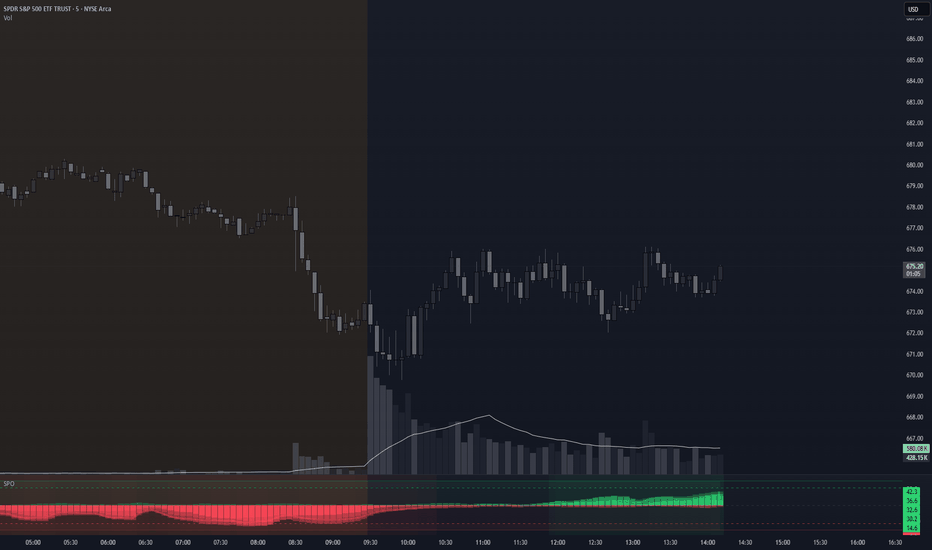
Snap Pressure OscillatorSnap Pressure Oscillator (SPO)
The Snap Pressure Oscillator (SPO) is a support-and-resistance pressure indicator designed to help traders visualize when nearby levels may be weakening before a potential expansion move.
Instead of measuring momentum alone, SPO evaluates how price behaves around recently confirmed pivot levels. The indicator analyzes repeated tests, wick probes, reaction strength, close location, volatility compression, and relative volume to estimate whether resistance above price or support below price is losing strength.
This produces two independent pressure scores:
• Bullish Pressure | suggests resistance may be weakening
• Bearish Pressure | suggests support may be weakening
A Net Pressure line shows the balance between the two.
The goal of SPO is not to predict breakouts by itself, but to help traders monitor when a market is transitioning from repeated testing into possible expansion conditions.
Key Concepts
Watch Zone
When pressure rises above the Watch level, the indicator signals that conditions around a level are becoming active and worth monitoring.
Snap-Ready Zone
When pressure moves into the Snap-Ready zone, the probability of a directional expansion increases if price confirms the move.
Pulse Signals
Pulse markers highlight moments when pressure first enters the Snap-Ready zone.
Divergence Warnings
If pressure rises but price momentum disagrees (via RSI slope), the indicator will show a divergence warning. This may suggest a potential false breakout or breakdown.
Signal Modes
The Signal Mode input adjusts how easily pressure builds.
Aggressive
Earlier signals with faster reaction to level tests.
Balanced
Default configuration designed for most trading styles.
Conservative
Requires stronger pressure and more confirmation before signals appear.
How to Use the Indicator
SPO is most effective when used alongside price structure and key levels rather than as a standalone signal generator.
Bullish Example 1 – Resistance Break Confirmation
Look for:
• Bullish pressure above the Snap-Ready level
• Bullish pressure greater than bearish pressure
• Price closing above the active resistance level
Interpretation:
Repeated testing may have weakened the resistance zone, allowing price to expand upward.
Possible approach:
Some traders watch for either the breakout itself or a small pullback after the break.
Bullish Example 2 – Early Pressure Build
Look for:
• Bullish pressure above the Watch level
• Rising bullish pressure while bearish pressure remains low
• Price repeatedly testing resistance with smaller rejections
Interpretation:
This may suggest the market is building pressure beneath resistance before a possible breakout.
Possible approach:
Traders may mark the resistance level and prepare for a breakout attempt rather than entering immediately.
Bearish Example 1 – Support Breakdown Confirmation
Look for:
• Bearish pressure above the Snap-Ready level
• Bearish pressure stronger than bullish pressure
• Price closing below the active support level
Interpretation:
Repeated tests may have weakened the support zone, increasing the chance of downward expansion.
Possible approach:
Some traders wait for the breakdown confirmation or a retest of the failed support area.
Bearish Example 2 – Early Breakdown Pressure
Look for:
• Bearish pressure rising above the Watch level
• Bearish pressure increasing while bullish pressure fades
• Price repeatedly testing support with weaker bounces
Interpretation:
This may indicate the market is leaning on support before a potential breakdown.
Possible approach:
Traders may monitor the level closely and wait for confirmation before acting.
Practical Notes
SPO works best in markets where price respects structure and levels. In highly choppy conditions, pressure can build without leading to a sustained move.
Like any technical tool, the indicator should be used alongside price action, risk management, and broader market context. Indicador
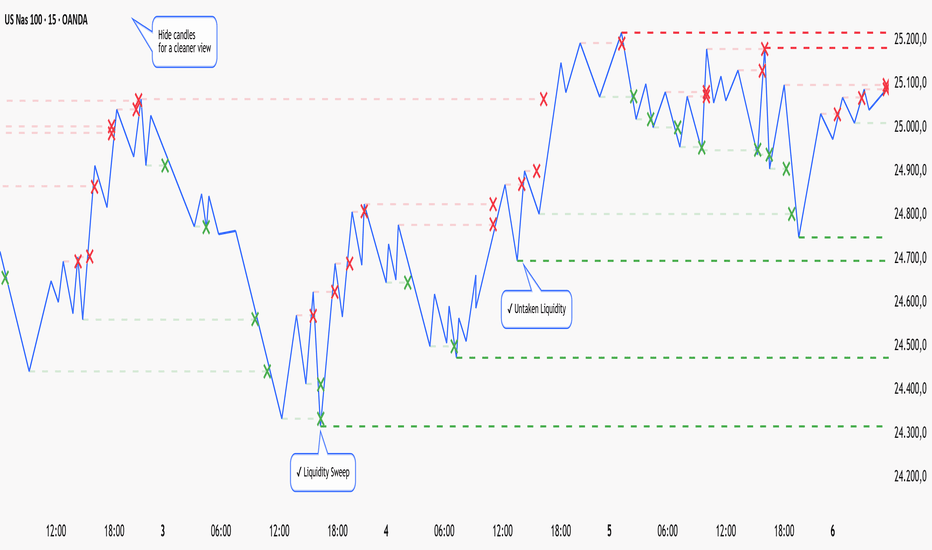
Zig Zag Liquidity Pools & Sweeps by Capitan-TradingZig Zag Liquidity Pools & Sweeps
Many traders focus only on price movement, but price alone often hides an important part of the story.
Markets constantly move between areas of liquidity .
These are zones where stop orders and pending orders accumulate around previous highs and lows.
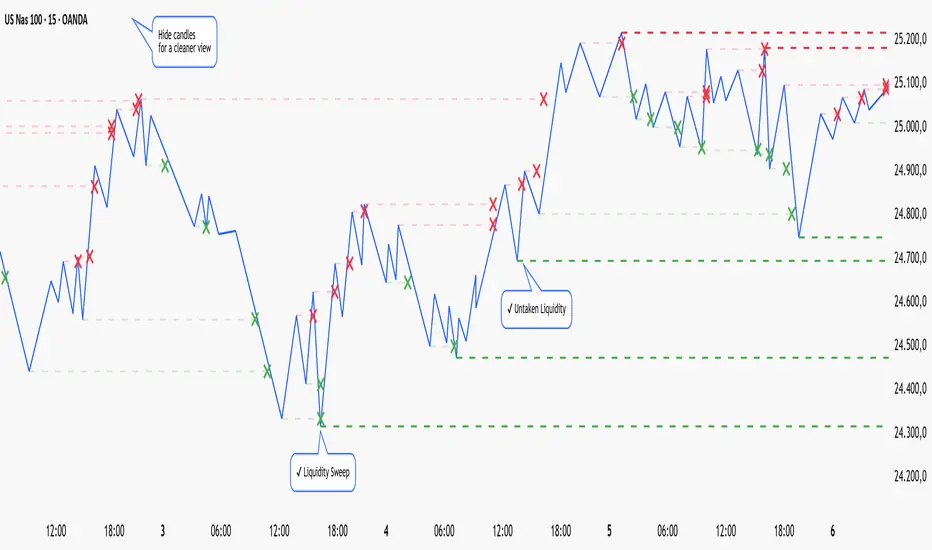
When these levels are taken, the event is commonly known as a liquidity sweep .
Understanding where these pools exist – and when they are removed from the market – can help traders better interpret market structure and reactions .
This indicator is designed to visually map liquidity pools and highlight sweep events using a clean Zig Zag-based structure.
Instead of manually searching for equal highs or equal lows, the script automatically detects relevant pivot levels and projects them forward as potential liquidity targets.
What problem does this tool solve?
Many traders struggle with identifying:
• Where liquidity is resting
• When that liquidity has been swept
• How price reacts after a liquidity event
Manually tracking these areas across multiple swings can be time-consuming and inconsistent.
This indicator simplifies the process by providing a clear visual framework for observing liquidity .
How the indicator works
The script combines three visual components:
Zig Zag Structure Engine
A Zig Zag structure helps define the most relevant market swings , filtering minor noise and highlighting meaningful pivots.
These pivots act as reference points for identifying potential liquidity zones .
Liquidity Pools
When a significant pivot high or low forms, the indicator projects a horizontal liquidity line .
These lines extend forward until the market interacts with them.
Traders can use these levels as reference zones where stop liquidity may exist .
Liquidity Sweeps
When price trades through one of these liquidity levels, the indicator marks the event with an X , signaling that the liquidity pool has been swept .
This helps quickly identify areas where the market has removed liquidity before potentially continuing or reversing .
Clean Chart Tip
For an even clearer analysis, you may occasionally hide the price candles and observe only the liquidity structure drawn by the indicator.
On TradingView this can be done easily:
Click the three dots next to the asset name and temporarily hide the price series.
This allows you to observe only:
• Zig Zag structure
• Liquidity pools
• Sweep events
Removing the candles can create a much cleaner visual map of liquidity movements .
You can re-enable the candles anytime to reconnect the liquidity structure with price action.
Typical use cases
Traders often use liquidity mapping to observe:
• Potential stop-run areas
• Structural liquidity sweeps
• Liquidity grabs during consolidation
• Interaction between structure and liquidity
This indicator provides a clean visual representation of these dynamics .
Important
This script is designed as a visual market analysis tool .
It does not provide financial advice and should be used alongside proper market understanding, risk management, and independent analysis .
VERSIONE ITALIANA
Zig Zag Liquidity Pools & Sweeps
Molti trader si concentrano esclusivamente sul movimento del prezzo, ma il prezzo da solo spesso nasconde una parte importante della storia.
I mercati si muovono continuamente tra zone di liquidità .
Si tratta di aree in cui si accumulano stop loss e ordini pendenti attorno ai massimi e minimi precedenti.
Quando questi livelli vengono colpiti, l’evento viene comunemente chiamato liquidity sweep .
Comprendere dove si trovano queste zone – e quando vengono rimosse dal mercato – aiuta a interpretare meglio la struttura e le reazioni del prezzo .
Questo indicatore è progettato per mappare visivamente le liquidity pools e identificare gli sweep utilizzando una struttura basata sullo Zig Zag.
Lo script rileva automaticamente i pivot più rilevanti e li proietta nel futuro come possibili target di liquidità.
Quale problema risolve questo strumento?
Molti trader hanno difficoltà nell’identificare:
• Dove si trova la liquidità
• Quando questa liquidità viene presa dal mercato
• Come reagisce il prezzo dopo uno sweep
Monitorare manualmente queste aree su più swing può essere complesso e poco coerente.
Questo indicatore offre una rappresentazione visiva chiara delle zone di liquidità .
Come funziona l’indicatore
Lo script combina tre componenti principali:
Struttura Zig Zag
La struttura Zig Zag aiuta a identificare gli swing più rilevanti del mercato , filtrando il rumore minore.
Questi pivot diventano i riferimenti per individuare possibili zone di liquidità .
Liquidity Pools
Quando si forma un pivot significativo, l’indicatore traccia una linea orizzontale di liquidità .
Queste linee vengono estese fino a quando il prezzo non interagisce con esse.
I trader possono usarle come zone dove potrebbero trovarsi stop e ordini pendenti .
Liquidity Sweeps
Quando il prezzo supera uno di questi livelli, l’indicatore segna l’evento con una X , indicando che la liquidità è stata presa dal mercato .
Questo permette di individuare rapidamente le aree in cui il mercato rimuove liquidità prima di continuare o invertire il movimento.
Suggerimento per un grafico più pulito
Per una lettura ancora più chiara è possibile nascondere temporaneamente le candele del prezzo.
Su TradingView basta cliccare sui tre puntini accanto al nome dell’asset e nascondere la serie del prezzo.
In questo modo potrai osservare solo:
• Struttura Zig Zag
• Liquidity pools
• Sweep di liquidità
Senza il rumore delle candele il grafico diventa una mappa visiva molto pulita della liquidità di mercato .
Importante
Questo script è uno strumento di analisi tecnica visiva .
Non rappresenta consiglio finanziario e dovrebbe essere utilizzato insieme a una corretta gestione del rischio e comprensione del mercato . Indicador