Indicador

AlgoZ Pro Price ActionAlgoZ Pro Price Action is a clean price action based forex indicator built to help traders identify potential Buy, Sell, and Exit areas using a combination of market structure, trend filtering, volatility logic, and dynamic trade management.
This indicator is designed around the idea that not every trade needs to have a high win rate to be useful. Instead of only looking for quick scalp targets, AlgoZ Pro Price Action is built to manage trades with a runner-style approach. The goal is to cut weak trades faster, protect trades that start moving in the right direction, and allow stronger moves to continue when momentum is present.
The default settings are best suited for 1-minute EUR/USD forex trading. Other forex pairs and timeframes may work differently and should be tested before use.
The indicator uses market structure breaks to identify possible directional shifts. When price breaks key internal support or resistance levels, the script checks multiple filters before plotting a signal. These filters are designed to reduce low-quality signals during chop, weak momentum, or overextended conditions.
AlgoZ Pro Price Action includes Buy, Sell, and Exit labels directly on the chart. Buy signals are shown in teal, Sell signals are shown in pink, and Exit signals are shown in a neutral color. The bars can also be colored based on the active signal direction so it is easier to visually track the current market bias.
One of the main parts of this indicator is the trend lock system. The trend lock helps prevent the indicator from flipping back and forth too quickly during noisy market conditions. It uses EMA trend structure, slope behavior, and confirmation bars to decide whether the market is currently favoring Buy-side or Sell-side continuation. Countertrend signals must be stronger before they are allowed through, which helps reduce random reversal signals during an active move.
The indicator also includes automatic forex pair adjustment. It detects whether the chart is a JPY pair or a non-JPY forex pair and automatically adjusts pip size calculations. This helps prevent issues where a stop or exit calculation is too tight or too wide because of the symbol’s price format. The script also includes auto volatility tuning, which uses ATR-based logic to scale stop size, runner triggers, trailing stop distance, dead-trade protection, and cooldown behavior based on the current pair’s movement.
Trade management is handled through a dynamic exit engine. Instead of using only fixed take profit levels, the indicator uses runner logic. Once a trade moves far enough in profit, the trade can enter runner mode. From there, the script can move the stop, protect profit, and trail the trade if the move continues. This allows stronger trades to breathe while still giving the indicator a way to exit when momentum fades.
AlgoZ Pro Price Action also includes dead-trade protection. If a trade has been open for a certain number of bars and has failed to make meaningful progress, the script can plot an Exit signal. This is designed to help remove weak trades that are not moving enough to justify staying in them.
The indicator includes several optional filters and controls, including EMA trend filtering, ADX strength filtering, chop filtering, candle body quality filtering, minimum EMA separation, price distance from the slow EMA, overextension protection, post-exit cooldown, and emergency protection logic.
Main features include:
• Buy, Sell, and Exit labels
• Teal and pink AlgoZ Pro visual theme
• Price action and market structure based signals
• Internal support and resistance break logic
• Optional BOS / CHoCH structure markings
• EMA trend filtering
• ADX trend strength filter
• Chop and range filter
• Candle quality filter
• Trend lock system
• Countertrend signal protection
• Auto pip size detection
• Auto adjustment for JPY and non-JPY forex pairs
• ATR-based auto pair tuning
• Dynamic stop logic
• Runner-style trade management
• Breakeven / profit lock logic
• Trailing stop logic for stronger moves
• Dead-trade exit protection
• Optional bar coloring
• Optional entry and stop lines
• Optional status table
Recommended default use:
1-minute EUR/USD forex chart.
Other forex pairs and timeframes may require adjustment depending on spread, volatility, session, and market conditions. Indicador

DJT Strategy - The Art of the DipWHAT THIS IS
A satirical — but mechanically honest — volatility-event mean-reversion strategy for index charts (ES, SPX, SPY, NQ...). It trades one hypothesis, known to Wall Street as the TACO trade ("Trump Always Chickens Out"): when a policy Announcement detonates the VIX, the sell-off is usually walked back within days — a "90-day pause," a "very productive call," a clarification that the tariffs apply primarily to penguins. The dip, having been artisanally manufactured, is bought.
The jokes are in the labels. The engine underneath is a real VIX-spike fade with staged exits, and every decision is lookahead-clean.
HOW IT WORKS — ENTRY (Chaos Detection)
• Covfefe Threshold — VIX trades ≥ 12% (default) above YESTERDAY'S CONFIRMED daily close. Not today's repainting value — yesterday's close is final data the moment today begins.
• Flash Tantrum — fast intraday VIX rate-of-change (default 8% over 6 bars) to catch the 2:37 PM post that ends four decades of trade policy in under 280 characters.
• Minimum VIX floor (default 18) — below this the market is not scared, it is merely golfing.
• Vol-curve confirmation (default ON) — requires VIX9D > VIX. Genuine event panic inverts the front of the volatility curve: 9-day vol pricing above 30-day is the fingerprint of a real scare. If the curve isn't inverted, even the market doesn't believe the post, and the signal is skipped. This is the filter that separates an actual tantrum from a slow-drift vol day.
When everything aligns, the strategy goes long the chart symbol at the next bar open.
HOW IT WORKS — EXITS (the TACO Protocol, staged like the walk-back itself)
• GREAT CALL — the first reassuring headline: VIX Δ falls back under 8% (default) → take half the position off.
• CONCEPTS OF A PLAN — VIX reverts to within 4% of yesterday's close: a Framework of a Concept of a Deal has been reached → close the rest.
• YOU'RE FIRED — fixed stop loss (default 1.5%). Sometimes he does not, in fact, chicken out. This is the apology budget.
• DECLARE VICTORY — fixed profit target (default 2.5%). Exit into strength and take credit for the bounce you predicted after it happened.
• NEWS CYCLE EXPIRY — time stop (default 78 bars ≈ one full RTH session on 5m). After one news cycle, a newer, more beautiful crisis replaces this one and the edge is gone.
EXTRAS
• Escalation sizing — at FULL COVFEFE (2× the spike threshold) the position gets the BIGLY multiplier. Peak fear is peak walk-back probability. This is either alpha or a margin call; many people are saying both.
• Post-trade cooldown so a single escalating tweetstorm can't chain entries.
• RTH-only entries (default ON), plus an optional "Prime Posting Hours" filter (cable-news breakfast block + post-lunch Executive Time).
• "Believe Me" mode (default OFF) — experimental fade of VIX-crush euphoria, for days when everyone believes The Deal is real this time.
• ♟️ 4D CHESS MODE — reverses every signal, for users who believe there is, in fact, a plan. Exits are direction-aware, so the joke is mechanically sound. If this mode outperforms, please tell no one.
• CHAOS-O-METER™ dashboard — live chaos grade from 🏌️ GOLFING to 🚨 FULL COVFEFE, vol-curve status, a factory-floor "DAYS SINCE LAST TANTRUM" safety sign (resets constantly, as is tradition), deal accounting (Deals made / Fake news / Deals honored: TBD), net P&L denominated in $TRUMP at a peg of your choosing, and a Sharpe ratio readout that is simply THE BEST RATIO.
• 🗽 Liberation Day (April 2) is marked annually — heightened tantrum risk, observed like a holiday, because it is one now.
NO REPAINTING / NO LOOKAHEAD
The reference VIX level is yesterday's confirmed daily close, pulled with the standard non-repainting pattern (close of the daily feed with lookahead on — final the moment today starts). Signals are evaluated on confirmed chart-timeframe bars and orders fill at the next bar open. Everything the strategy decides is knowable at decision time — which is more than can be said for the policy it trades.
HOW TO USE
• Chart: an index or index future (ES1!, SPX, SPY, NQ1!...). Intraday timeframes; defaults tuned around 5m.
• Both vol symbols are inputs — swap in VXN for NQ, or your regional vol index pair for non-US indexes.
• Strategy properties: $1,000,000 initial capital (sized for index futures notional), 2 contracts per trade by default (so the half-off scale-out has a half; at the default 1.5% stop on ES this risks roughly 1% of equity per trade), $4.50/contract commission, 1 tick slippage. margin_long/margin_short are explicitly 0 — Pine v6's default of 100 silently rejects futures entries whose notional exceeds capital; if you fork this for leveraged instruments, keep that line.
DISCLAIMER
This is satire with a working strategy attached, published for education and entertainment. The VIX spikes are, regrettably, real; the edge may not be. Backtest results on manufactured dips do not guarantee future walk-backs. Not financial advice — frankly, it barely qualifies as advice.
Estrategia

Pump-and-Dump / Volatility Spike FlagPump-and-Dump / Volatility Spike Flag flags abnormal single-candle volatility — not the manipulation scheme, but the classic sharp-spike-then-reverse price shape that shows up around news events (frequently seen on MCX crude oil and silver).
HOW IT WORKS
A candle is flagged only when two conditions occur together: its true range (which includes gap-opens) expands well beyond its rolling ATR, AND its volume expands well beyond its rolling average. Flagged spikes are tracked for a short window afterward — if price closes back through that candle's open before the window expires, it is separately flagged as a "Fade," indicating the initial move has started reversing.
HOW TO USE
Use the Spike flag as an early heads-up that a candle is statistically abnormal for current conditions. Use the Fade flag as the more actionable signal — it confirms the spike has already started giving back its move. This is an informational/analytical tool, not a buy or sell signal, and should be combined with your own risk management and market context.
LIMITATIONS
ATR and volume averages are backward-looking, so the first spike after a long quiet period needs a relatively larger move to trigger. This is a single-candle geometry and volume-shape detector — it cannot identify why a move happened (news, order-flow, or otherwise), and it does not predict direction after the fade.
DISCLAIMER
For educational/informational purposes only. Not financial advice. Past performance does not guarantee future results. Trade at your own risk and always use proper risk management. Indicador

Regime Classifier [RC Tools]RC Tools — Regime Classifier
─────────────────────────────────────────────────────────────
█ OVERVIEW
Most indicators assume a single market condition and quietly fail in another. This tool doesn't generate signals — it tells you which of four market regimes you are currently in, so you can judge whether your existing tools are operating in conditions that suit them. It is a context tool, not a decision tool.
█ WHAT IT DOES
Classifies each confirmed bar into one of four states and colours the chart background accordingly:
• Trending — Expansion: directional, volatility rising
• Trending — Exhaustion: directional, volatility compressing
• Ranging — Quiet: no direction, low volatility
• Ranging — Volatile: no direction, high volatility (chop)
A table (top-right by default, repositionable) shows the current regime, how long price has been in it, and historical base rates — the average forward return and win rate seen after each regime, going back over the chart's full history.
█ THE THEORY BEHIND IT
Market behaviour is not stationary. A trend-following tool that performs well in directional expansion will bleed in volatile chop; a mean-reversion tool does the reverse. Rather than attempting to fix any single indicator, this tool identifies which environment you are in, using two independent dimensions — directionality and volatility state — that measure genuinely different properties of price behaviour rather than two correlated views of the same one.
█ HOW IT IS CALCULATED
DIRECTIONALITY — Efficiency Ratio over N bars:
ER = |close − close | ÷ Σ|close − close |
Bounded 0–1. A value near 1 means price travelled almost directly from A to B (trending); near 0 means it wandered (ranging). No fitted parameters beyond the lookback. The Efficiency Ratio was introduced by Perry Kaufman as the core input to his Adaptive Moving Average (KAMA); it is used here purely as a directionality measure, independent of any moving average.
VOLATILITY STATE — realised volatility, percentile-ranked:
RV = stdev(log(close/close ), N)
RV is then ranked as a percentile against its own trailing distribution (default: 750 bars, ≈3 years on daily). An absolute volatility threshold is meaningless across assets — percentile ranking makes the classification behave identically on BTC, gold and equities with no parameter tuning.
The two dimensions are crossed to yield the four states. Classification occurs ONLY on confirmed bar close — the background never updates mid-bar and then flips back.
The base-rate table works by recording, for every historical bar, the forward N-bar return and whether it was positive, attributed back to whichever regime was active N bars earlier. Only fully-elapsed, already-known returns are used — nothing is looked up ahead of the current bar.
█ SETTINGS & CONFIGURATION
• Efficiency Ratio Lookback (default 20) — shorter = more responsive, noisier
• Realised Volatility Lookback (default 20)
• Percentile Ranking Window (default 750 bars ≈ 3 years daily) — longer = more stable, needs more history
• Directionality Threshold (default 0.35) — the ER above which price is considered trending
• Volatility Percentile Threshold (default 50) — the split between low and high volatility states
• Forward Return Window (default 20 bars) — the horizon used for the base-rate table
• Table position and background colours are fully configurable; the main-chart background painting can be toggled off if you only want the diagnostic pane
█ HOW TO USE IT
Use it as a filter on your existing process, not as an entry trigger. Example: if you run a breakout system, check whether it has historically performed in Ranging — Volatile; if not, consider standing aside when the background flags that state. Example: a mean-reversion system will typically show its worst results in Trending — Expansion.
Works on any asset and timeframe with sufficient history for the percentile window. Best used on daily and above, where regime persistence is greatest.
█ LIMITATIONS
This tool classifies the PRESENT. It does not predict the future, and any use of it as a forecast is a misuse.
• Regime identification is backward-looking by construction. The tool will confirm a regime change several bars AFTER it occurred. This lag cannot be removed without curve-fitting or repainting, and has not been.
• Classification is unstable near threshold boundaries; expect flickering between states when ER or volatility percentile sit close to the cut-offs.
• The percentile ranking requires substantial history. On assets with short histories, the ranking is unreliable and the tool should not be trusted.
• The base-rate table's early entries are built on fewer samples than its later ones — treat statistics as provisional until a state has accumulated a meaningful sample count.
• Four states is a deliberate simplification of a continuous reality. Markets do not actually occupy discrete regimes.
• This script does NOT repaint. All classification is computed on confirmed bar close only.
█ DISCLAIMER
For educational and informational purposes only. Nothing here is financial advice. Past behaviour of any market regime does not indicate future results. Trade at your own risk.
Indicador

Options Buyer's Edge WeeklyOverview
Options Buyer's Edge — Weekly is a decision-support panel for the weekly index option buyer. Most option tools chase directional "smart-money flow," but on retail-dominated weeklies that flow is largely uninformed — so the durable edge for a buyer isn't direction, it's the premium environment you actually pay for: is implied volatility cheap or rich, is it expanding or crushing, how hard is theta biting toward expiry, and where is the pin magnet pulling price. This script auto-builds an ATM strike ladder for the current weekly, reads the option tape directly, adds a skew-gated directional layer, and then tests every call it makes against your own history. It is a context-and-timing map for buying premium — not a signal generator.
Why these components are ONE tool (mashup justification)
This is a deliberate dependency chain, not a stack of independent indicators. Each layer answers a question the previous one leaves open, and the buyer needs all of them to price what they're doing:
IV / straddle state (primary). The buyer's number-one enemy is paying rich premium into a crush. The ATM straddle gives an IV proxy (percentiled so "rich/cheap" is relative to this instrument's own history) and its slope tells you whether IV is expanding (tailwind) or crushing (bleed). A second read, Prem vs RV, compares that implied vol against realized vol — the variance-risk-premium — so "rich" means rich relative to what the market is actually delivering, not just rich in the abstract.
Theta clock (primary). Premium decays non-linearly into expiry. The panel converts hours-to-weekly-expiry into an escalating decay zone (Normal → Elevated → High → Extreme) so you know when time decay alone makes a long option a bad trade regardless of direction.
Pin magnet (primary). Option volume concentrates at a strike that price tends to gravitate toward near expiry. The tool finds the max-volume strike and draws it — the level a buyer is fighting against.
Underlying character (confirming). Futures basis pulse and India VIX behaviour describe whether the underlying move carries conviction or is unwinding — a cross-check on the directional read.
Directional flow (secondary, gated). A delta-weighted signed CE/PE buyer-pressure imbalance, gated by option skew and trusted only when the calibration Edge for it is positive. Directional option flow predicts returns mainly from informed traders and reverses at longer horizons; on retail weeklies it may be noise — so it earns trust from measured Edge, never from assertion.
The calibration harness (the honesty layer). Two forward tests run continuously: an underlying test (did a strong directional read actually precede a k×ATR move, versus the unconditional base rate?) and a thinner option-outcome test (did the ATM option gain the target % over the horizon?). Both resolve only on confirmed bars, and both are shown as Hit / Base / Edge so you can see whether any layer is carrying information on your instrument right now.
Remove any one layer and the buyer is flying on premium they can't price. The straddle is a picture; theta and pin are mechanics; flow is a hypothesis; the harness is the proof.
How it works
The ATM strike is anchored from spot at the start of the calculation window and held constant (Pine can't mint new option symbols per bar, and request symbols must be fixed, not per-bar series). A ±3 ladder of CE/PE symbols is auto-built for the weekly expiry and each leg's price and volume are requested; invalid or illiquid strikes simply return nothing and are ignored. From the ladder the tool derives the straddle and IV proxy, the IV slope, volume PCR, the pin strike, an OTM skew read, and the delta-weighted buyer-pressure imbalance. Futures basis and India VIX add the underlying-character read, and an optional lower-timeframe slice (the finest your plan serves) sharpens it.
How to use it
Read the guidance panel top to bottom: the verdict (CE-buyable / PE-buyable / Avoid–crush or decay / Wait), the premium environment (IV cheap/rich, expanding/crushing), Prem vs RV, VIX behaviour, the theta zone, the pin, PCR, and the two Edge readings. Lean toward buying premium in a direction only when the environment is supportive and the theta zone isn't extreme. The flow-side (Option) Edge tells you whether the directional layer is working here; if it's near zero, ignore the flow and lean on IV / theta / pin. Everything is descriptive context — it never tells you to trade.
Plan-adaptive & data note
Intrabar precision auto-selects the finest slice your plan serves (seconds on Premium+, else 1-minute, else chart bar) and every stream is na-safe — any leg or feed your plan or the market doesn't serve simply contributes nothing, and the panel shows live leg coverage (x/14). The tool needs an underlying with real option data; on a symbol without it, the legs read empty. It is fully self-contained (nothing exported), so the whole request budget serves accuracy.
Non-repainting & honesty
The script works on confirmed closed bars with no higher-timeframe lookahead, and both calibration harnesses log and resolve only on confirmed bars, so their statistics never repaint intrabar. Important limits, stated plainly: NSE exposes no per-strike option OI, no tick tape and no greeks to scripts, so IV, skew and delta here are OHLCV proxies and flow is a buyer-pressure proxy. Option streams are session-anchored — re-add the script if spot travels more than ~2 strikes (a drift warning fires). The option-outcome Edge is inherently thin because a weekly contract lives only ~5 days; the underlying Edge matures faster. All Edge figures are in-sample, forward-measured at a fixed horizon, with no costs — a study aid, not a backtest.
Originality
The building blocks are public: volume-concentration (pin/max-pain) analysis, put-call flow, value-area logic, the ATM-straddle implied-volatility approximation, and the variance-risk-premium comparison. What's original is the integration for the buyer specifically — the auto-built weekly ATM ladder read directly off the option tape, the skew-gated directional layer that is trusted only on measured Edge, and the dual forward-calibration harness (underlying + option-outcome) that scores every call against its own base rate. This is a clean-room implementation; no third-party script code is reused.
Concept credits
ATM-straddle → implied-volatility approximation — Brenner & Subrahmanyam
Variance-risk-premium framing (implied vs realized vol) — standard volatility-research technique
Pin / max-pain volume concentration, put-call ratio, value-area analysis, option skew — standard public options techniques
Disclaimer
Research and education only. Not financial advice, no recommendation, no guarantee. Options carry the risk of total loss of premium, and time decay works against buyers. The Edge figures are in-sample with no costs and do not predict price. Test out-of-sample and make your own decisions. The author accepts no liability for any use of this script. Indicador

Opening Range Breakout ORB - Signals, Targets & Alerts [LunqFX]The Opening Range Breakout (ORB) is one of the most traded intraday strategies — but most ORB indicators only draw the opening range box and leave you guessing. This Opening Range Breakout indicator goes further: it marks the opening range, detects the first genuine breakout, filters fakeouts, projects measured-move targets, and — uniquely — builds a live breakout statistics engine from the last 100 trading days of the symbol on your chart.
What makes this ORB indicator different
Instead of a static box, you get a data-driven read on how your market actually behaves after the opening range:
First-break direction split — how often the day breaks up vs down
Hold rate — how often the first breakout direction holds into the close
Fakeout rate — how often the first breakout fails back inside the range
Target hit rates — how often price reaches 1x and 2x the opening-range height
So before you take the trade you can see, for example, that on this symbol the upside breakout holds into the close 62% of the time and the 1R target is reached on 48% of breakout days.
How the opening range breakout is calculated
Auto mode works on every market with zero setup. The opening range starts at each day's open of the symbol's own exchange — stocks at the 09:30 session open, crypto at the 00:00 UTC daily open, forex and futures at their session open — and lasts a chosen number of minutes (the classic 5-minute, 15-minute or 30-minute ORB). A Custom mode lets you define any session window, such as the London or New York open.
When the opening-range window closes, the range high and low are locked and projected forward as levels.
The first candle close beyond the range (or wick, if you prefer) is treated as the breakout. Targets are projected at 1x and 2x the range height in the breakout direction.
A close back inside the range before the first target is reached is flagged as a fakeout. A breakout that reaches 1R first and only then returns is counted as a valid breakout, not a fakeout.
At the end of each trading day the outcome is recorded — direction, hold, fakeout, targets — and the dashboard percentages are plain rolling hit rates. No repainting, no curve fitting.
How to use it
Breakout day trading: trade the first breakout with more context — use the hold rate to judge whether the break on your symbol is worth taking, and size your target from the 1R / 2R hit rates.
Fakeout fade: when a symbol shows a high fakeout rate, the failed breakout back inside the range is often the better setup; the fakeout is marked in real time.
Range-quality filter: the dashboard shows the opening range as a multiple of ATR, so you can skip abnormally small ranges that tend to break out randomly.
Works on any symbol and any intraday timeframe (1m–15m recommended): index futures and CFDs (NAS100, SPX500, US30, NQ, ES), stocks and ETFs (SPY, QQQ), gold (XAUUSD), Bitcoin and crypto, and forex majors.
Dashboard
A clean on-chart panel shows today's live status (building range → inside range → breakout → target hit or fakeout), the opening-range high/low and its size in ATR, and the full statistics block with the sample size always visible.
Settings
Auto anchor (any market, zero setup) or fully custom session window with timezone control — 5 / 15 / 30-minute ORB or any session open
Close-based or wick-based breakout logic
Adjustable target multiples, rolling statistics window, and visuals
Alerts for range locked, breakout up, breakout down, fakeout, target 1 and target 2
Optional gradient momentum candles that can be switched off
No repainting
The opening range is fixed the moment its window closes. Breakouts, fakeouts and targets are confirmed on closed bars only, and the statistics are built exclusively from completed trading days — never recalculated backwards.
This indicator is an educational market-analysis tool, not financial advice. Historical statistics describe past behavior and are not a guarantee of future results. Always confirm with your own analysis and manage your risk.
Indicador

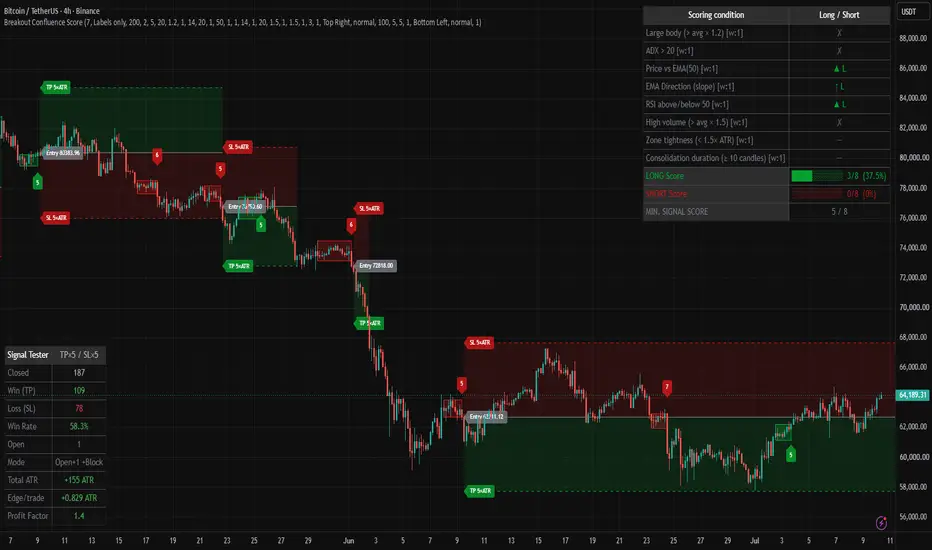
Breakout Confluence Score█ OVERVIEW
Breakout Confluence Score is an indicator designed to filter breakouts from consolidation by evaluating the overall market context before generating a signal.
The core assumption of the indicator is that not every breakout from consolidation has the same value. In practice, the success rate of a breakout depends on many independent factors such as market direction, trend strength, momentum, participant activity, and the quality of the consolidation itself.
Instead of treating every breakout equally, the indicator analyzes a series of independent market elements and assigns each of them a specific number of points. The final result creates the so-called Confluence Score — an assessment of how well multiple factors support a given breakout.
Only after reaching the minimum required score is a LONG or SHORT signal generated.
This approach significantly reduces the number of weak breakouts that appear during choppy price action, while still offering full configuration flexibility. Every scoring element can be individually enabled, disabled, or assigned its own point weight.
In addition to generating signals, the indicator also serves as a tool for ongoing market evaluation. The built-in scoring table shows the current status of all conditions even before a breakout occurs, allowing the trader to observe whether market conditions are gradually improving or deteriorating.
An integral part of the indicator is also the Signal Tester, which enables quick evaluation of the historical performance of the signals without the need to create a separate TradingView strategy. The tester was designed as a tool for assessing signal quality rather than as a full backtesting engine. This allows it to offer several capabilities that are difficult or impossible to achieve in classic strategies.
All modules of the indicator can operate independently, which means Breakout Confluence Score can be used as a simple breakout detector, a consolidation analysis tool, a market condition evaluation system, or a complete trade signal filter.
█ CONCEPTS
Most breakout indicators assume that every breakout from consolidation has similar chances of success.
In reality, the market does not work that way.
Price constantly moves through phases of trend, accumulation, distribution, and choppy movements without a clear direction. Two almost identical-looking breakouts can lead to completely different outcomes solely because of different market conditions.
That is why Breakout Confluence Score separates the signal generation process into two independent stages:
• detection of the breakout,
• evaluation of the quality of market conditions supporting that breakout.
A signal appears only when both conditions are met.
Building Consolidation and Boxes
The foundation of the indicator is automatic consolidation detection.
Consolidation begins when a defined number of consecutive candles remain inside the High-Low range of the base candle. The first candle that meets this condition defines the boundaries of the entire consolidation zone.
Its high becomes the upper boundary of the box, while its low defines the lower boundary. As long as every subsequent candle stays inside this range, the consolidation continues and the box is gradually extended to the right with each new candle.
As a result, a visual equilibrium zone appears on the chart, showing the area where neither buyers nor sellers have yet gained a clear advantage.
Consolidation ends in one of three cases:
• price breaks above the upper boundary of the box,
• price breaks below the lower boundary of the box,
• consolidation lasts too long and exceeds the maximum allowed number of candles.
Optionally, the indicator can also prevent a new consolidation from starting after a candle with an exceptionally large range. For this purpose, it uses ATR calculated before the analyzed candle, so a single large impulse cannot artificially inflate the volatility threshold and facilitate the creation of a new consolidation zone.
Why the Breakout Alone Is Not Enough
A breakout from consolidation does not automatically mean a good trading opportunity.
Very often breakouts occur:
• without clear momentum,
• against the dominant trend,
• on low volume,
• during a weak trend,
• without real buying or selling pressure.
Technically these are valid breakouts, but statistically their success rate tends to be much lower.
For this reason, the indicator does not evaluate only the fact of the breakout itself, but also the entire market environment in which it occurs. In practice, this means that two identical breakouts can receive completely different point scores. It is the scoring system that determines the quality of the signal.
Scoring and Market Context Evaluation
The purpose of scoring is to determine the current market situation as accurately as possible.
The breakout itself only informs that price has left the consolidation zone.
Scoring answers a much more important question:
“Does the market have sufficient conditions to continue the move after the breakout?”
Each scoring element analyzes a different aspect of market behavior.
Thanks to this, the final score is not based on a single indicator, but represents a combination of multiple independent sources of information.
EMA – Trend Direction
The Price vs EMA condition determines the dominant market direction.
If price is above the EMA, the LONG side receives an advantage.
If price is below the EMA, the SHORT side receives an advantage.
EMA is therefore responsible for identifying the dominant trend.
EMA Slope – Trend Development
The mere location of price relative to the EMA does not yet tell us whether the trend is developing actively.
That is why the slope of the average is also analyzed.
A rising EMA indicates a developing uptrend.
A falling EMA indicates a developing downtrend.
EMA Slope is responsible for assessing the quality and direction of trend development.
RSI – Momentum
RSI is used as a momentum indicator.
It is not used here to find overbought or oversold zones.
Its task is to assess which side of the market currently has greater strength.
RSI above 50 supports LONG signals.
RSI below 50 supports SHORT signals.
RSI is responsible for evaluating current market momentum.
ADX – Trend Strength
ADX measures the strength of the move regardless of its direction.
A high ADX value means the market is moving in a decisive and orderly manner.
A low ADX value indicates the lack of a clear advantage for either side.
ADX is responsible for assessing trend strength.
Volume – Market Participant Activity
Volume allows evaluation of whether increased participant activity stands behind the breakout.
Breakouts that occur on above-average volume are generally more reliable than breakouts that occur during low activity.
Volume is responsible for assessing market interest.
Body Size – Strength of the Breakout Candle
A large body of the breakout candle indicates a decisive advantage of one side of the market.
If the candle body is clearly larger than the average of recent candles, the breakout receives additional points.
Body Size is responsible for evaluating the strength of the breakout impulse itself.
Zone Tightness – Market Compression
Not all consolidations have the same value.
The narrower the box relative to the current ATR, the higher the probability that the market is in a compression phase preceding a stronger move.
Zone Tightness is responsible for assessing the quality and compression of the consolidation.
Duration Premium – Maturity of Consolidation
Longer consolidations often lead to more decisive breakouts.
Therefore, the indicator additionally rewards zones that have lasted for a sufficient amount of time.
Duration Premium is responsible for assessing the maturity of the consolidation.
Live Market Analysis
Scoring does not work only at the moment of breakout.
The scoring table analyzes all conditions in real time, even before a signal appears.
This allows the trader to observe how the market situation is changing and which side of the market is gradually gaining an advantage.
In practice, the indicator becomes not only a signal system, but also a tool for continuous evaluation of the current market environment.
Signal Tester
The Signal Tester was designed as a quick tool for evaluating the quality of generated signals.
It is not a full backtesting engine like TradingView Strategy and its results should not be treated as an accurate simulation of real trading.
A simplified operating model was deliberately used because it enables functionalities that are difficult or impossible to achieve in classic strategies.
The tester can simultaneously maintain multiple positions, manage LONG and SHORT trades independently, and — depending on the settings — allow simultaneous opening of positions in both directions. It can also block new entries until the previous position is closed or reject signals that appear too close to already open trades.
Each position receives its own Entry, Take Profit, and Stop Loss levels calculated based on ATR, which makes it possible to quickly compare different scoring configurations without building a full strategy.
The tester’s results are calculated conservatively.
If both the Take Profit and Stop Loss levels could have been reached during a single candle, the tester always assumes that the Stop Loss was hit.
Because the real sequence of price movements inside a single candle is unknown, this approach deliberately underestimates rather than overestimates the results. This effect becomes especially visible with small TP and SL distances, for example 0.5 ATR, where both levels can very often be reached within one candle. The smaller the TP and SL values relative to ATR, the more conservative the tester’s statistics will be.
The tester also does not account for commissions, spreads, or slippage. Therefore its results should be treated as a tool for comparing signal quality and optimizing indicator settings, not as an accurate simulation of real trading results.
█ FEATURES
Consolidation
* Minimum number of candles in consolidation – Minimum number of consecutive candles required to recognize a consolidation zone
* Show consolidation zones – Enables/disables drawing of consolidation boxes on the chart
* Show breakout signals – Enables/disables display of breakout signals (triangles and/or score labels)
* Remove box if breakout did NOT produce a signal (score < threshold) – Automatically removes the box if the breakout did not reach the minimum scoring threshold
* Display signals as – Choose signal display style: triangles only, labels only, or both
* Maximum number of candles in consolidation (0 = no limit) – Maximum duration of consolidation — after exceeding it the box is closed without generating a signal
Candle Size Filter
* Block consolidation start on oversized candle – Prevents starting consolidation after a candle with a very large range
* Max candle range (high-low) × ATR – Threshold for candle size (multiple of ATR calculated before the candle)
Scoring - General
* Minimum score for a signal (weighted sum) – Minimum required Confluence Score to generate a signal
Scoring - Candle Body
* Average body period – Period used to calculate average candle body size
* Signal body multiplier (body > avg × mult) – Multiplier for required body size of the breakout candle
* Condition weight: large body – Point weight of the large body condition
Scoring - ADX
* ADX — period (DMI) – Period of the ADX indicator
* ADX — minimum value – Minimum ADX value required to award a point
* Condition weight: ADX – Point weight of the ADX condition
Scoring - EMA
* EMA — period (trend) – Period of the EMA used for trend evaluation
* Condition weight: price vs EMA – Point weight of the price vs EMA condition
* Condition weight: EMA direction (slope) – Point weight of the EMA slope condition
Scoring - RSI
* RSI — period – Period of the RSI indicator
* Condition weight: RSI – Point weight of the RSI above/below 50 condition
Scoring - Volume
* Volume — average period – Period used to calculate average volume
* Volume — multiplier (vol > avg × mult) – Multiplier for required volume on breakout
* Condition weight: high volume – Point weight of the high volume condition
Scoring - Consolidation Structure
* Zone tightness: max (top-bottom)/ATR – Threshold for zone width relative to ATR (compression)
* Condition weight: zone tightness – Point weight of the zone tightness condition
* Premium: extra candles above minimum – Additional number of candles above minimum required for duration premium
* Condition weight: duration (premium) – Point weight of the duration premium condition
Table
* Table position – Position of the scoring table on the chart
* Table text size – Text size in the scoring table
Colors
* Bullish Color (Long) – Color used for LONG elements
* Bearish Color (Short) – Color used for SHORT elements
* Neutral Color – Color used for neutral elements / no signal
Signal Tester (TP/SL)
* Enable signal tester – Enable/disable the signal tester
* Tester — ATR period – ATR period used by the tester
* Tester — Take Profit × ATR – Take Profit distance in ATR multiples
* Tester — Stop Loss × ATR – Stop Loss distance in ATR multiples
* Block new signals while a position is open – Block new signals until the previous position is closed
* Block signals too close to an existing position – Filter for minimum distance between signals
* Min. distance between signals × ATR – Minimum distance (in ATR) between signals in the same direction
Signal Tester - Table
* Tester table position – Position of the tester statistics table
* Tester table text size – Text size in the tester statistics table
Signal Tester - TP/SL Visualization
* Show TP/SL levels on chart – Display Entry / TP / SL levels on the chart
* Level line width – Width of TP/SL level lines
* Show risk/reward zone fill – Fill color for risk and reward zones
█ APPLICATIONS
The main task of the indicator is to evaluate the quality of the breakout by analyzing the confluence of multiple independent market factors (trend direction and strength, momentum, volume, impulse strength, zone compression, and consolidation maturity). A LONG or SHORT signal is generated only when the total score exceeds the set threshold.
Thanks to this approach, the indicator effectively eliminates a large portion of weak and false breakouts that occur in low-confluence conditions.
The scoring table operates in real time — even before a signal is generated — and allows the trader to observe how a potential opportunity is gradually building up (or falling apart). This is especially useful for early detection of moments when the market begins to meet more and more conditions favorable for a breakout.
The built-in Signal Tester enables quick and convenient comparison of different scoring configurations without the need to write a separate strategy. It allows checking in just a few seconds how changing weights or thresholds affects the historical performance of the signals.
The indicator achieves the best results when used together with support and resistance zone analysis. For example, opening a long position directly under strong resistance is generally not advisable, while a long signal aligned with a support zone usually produces significantly better results. Similarly, short signals appearing near resistance tend to be more effective than those generated without reference to key levels.
The indicator works best when combined with support and resistance analysis.
█ NOTES
* Each of the eight scoring conditions can be independently enabled or disabled by setting its weight to 0.
* The scoring table shows the current market state in real time — it can be used even when signal generation is disabled.
* The Signal Tester operates in conservative mode: if both TP and SL could have been reached on the same candle, it always counts it as a loss. This approach deliberately underestimates results to provide a more realistic picture.
* The tester does not account for commissions, spreads, or slippage — it serves only for comparing signal quality and optimizing settings.
* All modules of the indicator (consolidation detection, scoring, table, tester, TP/SL visualization) can operate completely independently.
* Very long consolidations exceeding the “Maximum number of candles” limit are automatically closed without generating a signal to avoid outdated zones.
* The best results are achieved when the indicator is used together with support and resistance zone analysis. Long signals near support and short signals near resistance are generally significantly more effective. Indicador

Rally Leader Screener (2x Market)Rally Leader Screener (2x Market) — with Resisting-Weakness Flag
What it does
This indicator is built for the Pine Screener and identifies stocks demonstrating institutional-grade relative strength in two distinct market regimes:
Rally Leaders — After a market correction, the first stocks to rally 2x (or more) the index's move during the initial 6–7 session bounce are frequently the emerging leaders of the new uptrend. This tool automates that measurement: it pulls the benchmark index return over your chosen lookback window and flags any stock whose return is at least a user-defined multiple of the index return.
Resisting Weakness — When the market is flat or declining over the lookback window, the "Leader" logic correctly stays silent (there is no rally to lead). Instead, a second flag identifies stocks that are rising strongly despite market weakness — a classic early sign of accumulation and often the leader list of the next cycle.
Concept
The methodology draws on well-known momentum research (O'Neil, Minervini): true market leaders declare themselves in the first days of a new rally by outrunning the index by a wide margin, and/or by refusing to decline while the broad market corrects. This script quantifies both behaviors.
Screener columns
Stock Return % — the stock's return over the lookback window
Nifty Return % — the benchmark's return over the same window (default NSE:NIFTY, changeable to any index)
RS Multiple — stock return ÷ index return; shown only when the index return is positive (a ratio against a negative or near-zero denominator is meaningless, so it displays blank)
Leader — 1 when the index return is positive AND the stock's return ≥ (multiple × index return), plus liquidity/trend filters
Resisting — 1 when the index return is ≤ 0 AND the stock is up by at least the user-set minimum, plus the same filters
Ret Spread % — stock return minus index return; an all-weather relative-strength column that remains valid in up, down, and flat markets, useful for sorting when RS Multiple is blank
Inputs
Rally lookback (sessions): default 7 — match this to the actual length of the bounce
Leadership multiple: default 2.0 (the "2x the market" rule)
Benchmark index: default NSE:NIFTY; set to any index matching your watchlist universe
Minimum price and 20-day average volume: liquidity filters
Optional filters: close above 50 SMA, and up-day requirement
Resist flag minimum return %: threshold for the weak-market flag (default 5%)
How to use
Add the script to favorites, open Pine Screener, and select a watchlist (e.g., a broad index universe).
During/after a 6–7 day market rally: filter Leader == 1, sort by RS Multiple descending, and save the top names as a fixed watchlist. The intended workflow is to trade setups only within that list for the following weeks rather than re-scanning continuously.
During corrections or flat markets: filter Resisting == 1, sort by Ret Spread % descending, to build a pre-watchlist of stocks under accumulation.
Names appearing on both lists across a correction→rally sequence historically carry the highest leadership probability.
Notes
Designed for the daily timeframe.
This is a screening/ranking tool, not a buy/sell signal generator. Entries and exits should be based on your own setup criteria and risk management.
Works on any market — change the benchmark symbol to match (e.g., SPX for US stocks). Indicador
Martingale Range Breakout# Martingale Range Breakout
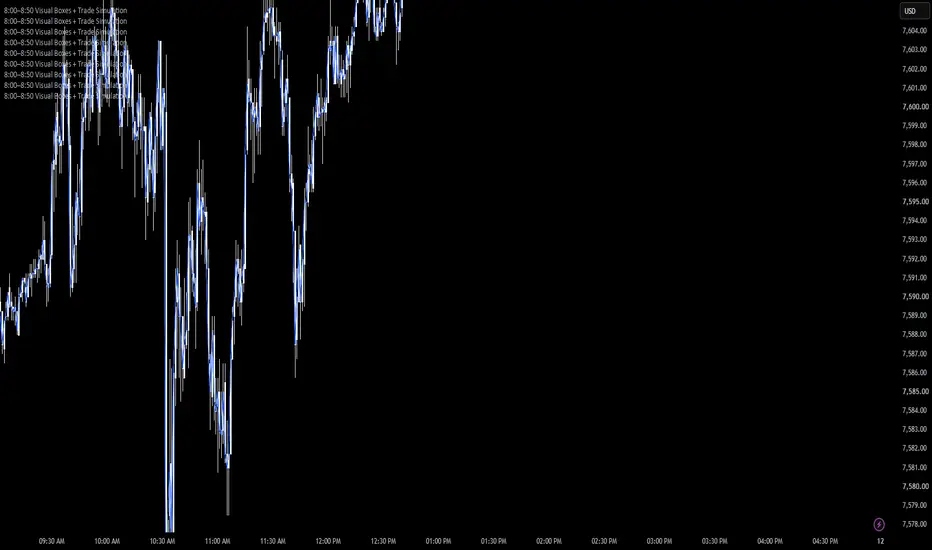
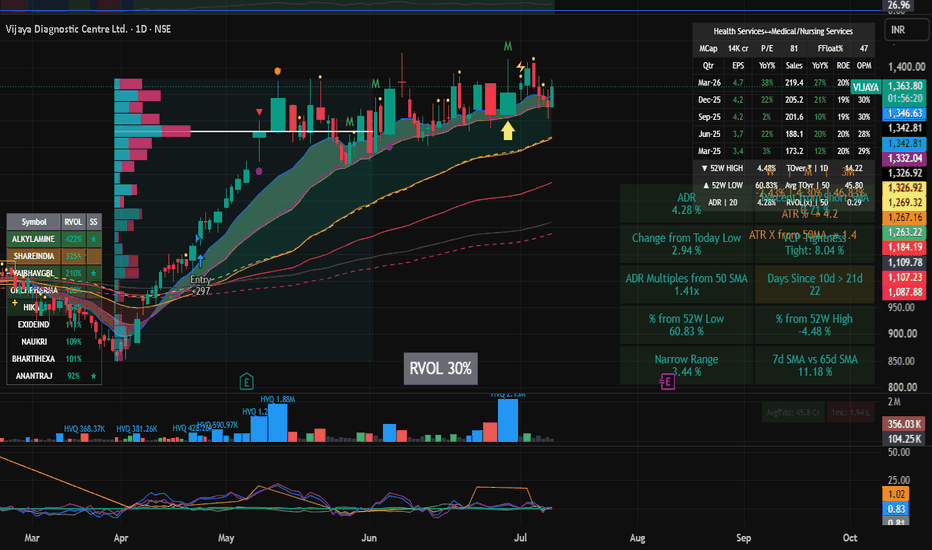
**Martingale Range Breakout** is a session-based breakout and flip-tracking indicator designed to study range expansion behavior after a defined range.
This script builds a custom time-based range, tracks breakout direction, monitors flip attempts, and displays live trade-state data with rolling performance stats directly on the chart.
---
## Core Concept
The indicator creates a range from a selected session window.
By default, the range is built from:
**8:00 AM – 8:50 AM New York Time**
Once the range locks, the script watches for price to break above or below the range.
* Break above the range = **Long Active**
* Break below the range = **Short Active**
* If price reverses and breaks the opposite side, the script counts that as a **flip**
* If price reaches the full range extension before 4 flips, it marks the setup as a **WIN**
* If the setup reaches 4 flips, it marks the setup as a **LOSS**
---
## Martingale Flip Logic
This indicator is based on a Martingale-style flip model.
The idea is that when a breakout fails and price flips to the opposite side of the range, the next position size is increased to help recover the previous failed attempt.
Example position sequence:
* Flip 1: **1 contract**
* Flip 2: **2 contracts**
* Flip 3: **4 contracts**
* Flip 4: **Loss**
Each flip represents the market failing in one direction and then triggering the opposite side of the range.
The goal of the Martingale model is for the final successful breakout to recover the previous failed flips and still finish the sequence in profit.
The table tracks the current trade state and flip count, allowing traders to see what stage of the Martingale sequence the setup is currently in.
---
## Visual Range Boxes
The script draws two clean visual zones on the chart.
**Yellow Box**
Shows the original session range.
**Green Box**
Shows the full expansion zone based on the range size.
The final target levels are calculated as:
* Buy final target = **Range High + Full Range Distance**
* Sell final target = **Range Low - Full Range Distance**
This makes it easy to see both the breakout levels and the final expansion targets.
---
## Live Trade State Tracking
The table displays the current setup condition in real time.
Possible states include:
* **WAITING**
* **LONG ACTIVE**
* **SHORT ACTIVE**
* **WIN**
* **LOSS**
The table also shows the current flip count, helping traders quickly identify how many times the setup has reversed.
---
## Built-In Rolling Statistics
The indicator tracks the last selected number of completed setups and displays performance data inside the chart table.
Stats include:
* Last N trade count
* Wins and losses
* Rolling win rate
* Rolling R total
* Average winning range size
* Average losing range size
* Current range size
* Win sample count
* Loss sample count
* Average minutes to win
* Average minutes to loss
The rolling sample size can be adjusted in the settings.
---
## Breakeven Win Rate Requirement
This model uses a negative-risk-reward structure, meaning each win is smaller than each full loss.
The R Total calculation is based on:
* Win = **+0.14285R**
* Loss = **-1R**
Because each full loss is much larger than each win, the system needs a very high win rate to be profitable.
The approximate breakeven win rate is:
**87.5%**
That means the strategy must win more than **87.5%** of completed setups to show positive expectancy under this model.
* Below **87.5% win rate** = negative expectancy
* At **87.5% win rate** = around breakeven
* Above **87.5% win rate** = positive expectancy
This is why the rolling win-rate tracker is important. It helps traders quickly see whether the most recent sample is performing above or below the required profitability threshold.
Even though the Martingale flip model can create a high win rate, the full loss is much larger than the average win. Because of that, risk management is extremely important.
---
## R-Multiple Model
The R Total section helps estimate whether the recent rolling sample is profitable based on the script’s fixed reward-to-risk model.
Instead of only showing win rate, the script also calculates the overall R performance across the selected sample.
This helps traders avoid focusing only on a high win rate and instead evaluate whether the system is actually profitable after accounting for the larger full-loss event.
---
## Customizable Settings
You can adjust:
* Session start hour
* Session start minute
* Session end hour
* Session end minute
* Rolling trade sample size
* Show or hide the stats section
* Table position:
* Top Right
* Middle Right
* Bottom Right
---
## Best Use Case
This indicator is best used as a visual research tool for traders studying:
* Morning range breakouts
* Range expansion behavior
* Flip-based entry models
* Martingale-style recovery logic
* High-win-rate breakout systems
* Negative-risk-reward models
* Breakeven win-rate requirements
* Time-to-outcome behavior
* Rolling sample performance
---
## Important Risk Notice
This is an indicator only. It does not place trades automatically and should not be considered financial advice.
Martingale-style systems can increase risk quickly because each failed flip requires a larger position size. While the model may recover losses when the breakout eventually succeeds, the downside can become large when multiple flips fail.
A system like this does not only need to win often — it needs to win enough to overcome the size of its losses. Under this model, that means maintaining a win rate above approximately **87.5%**.
Always test thoroughly, use proper risk management, and understand the full risk before applying any strategy live.
Indicador

Indicador

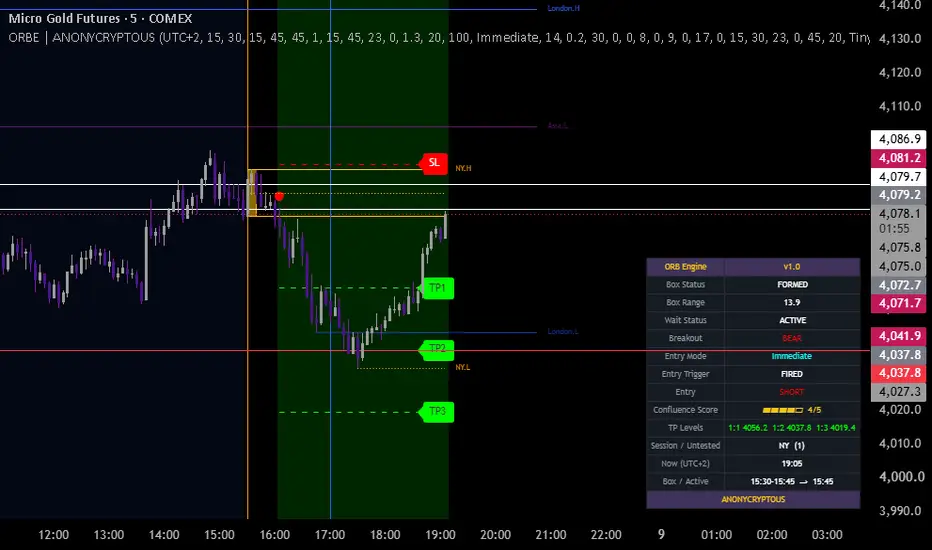
ORB Engine | ANONYCRYPTOUSORB Engine | Anonycryptous
Description & user manual
Why this indicator is different
The opening range is one of the most studied concepts in intraday trading, and for good reason. The first fifteen minutes after a major session opens concentrates the most institutional activity of the day. Breakouts from that range, followed by a retest of the level, are among the most statistically consistent setups available on lower timeframes.
The problem is execution. Most opening range tools stop at the box. They draw a high and low, and leave the trader to figure out the rest: when to trade, how to confirm direction, where the liquidity sits, how to time the entry. That gap between the concept and a usable trade is where most ORB approaches fall apart in practice.
The ORB Engine closes that gap. It does not just draw a box. It tracks the full sequence from formation through confirmation through entry, enforces a discipline around when trades are allowed, maps the session liquidity levels that the price is most likely to target or react from, and scores each setup against five confluence criteria before a signal fires. The result is a complete framework for opening range trading that works across instruments and timeframes.
Important notice
The ORB Engine generates visual states based on price structure, volume confirmation, session timing, and liquidity context. These states are not financial advice. They do not predict future price movement. They do not guarantee profitability. All trading decisions are made entirely by the user. Always manage your own risk. Always apply your own judgment.
1. Overview
The ORB Engine is an overlay indicator that combines opening range detection, breakout confirmation, three entry modes, session liquidity mapping, and a five-point confluence scoring system into a single framework. It is designed for intraday scalping and day trading on any instrument and any timeframe below one hour.
What it includes:
- Opening range box (configurable start and end times) with high, low, and midpoint lines
- Wait period enforcement that blocks entries until the active window opens
- Master toggle to disable the wait period entirely for pure ORB breakout use
- Volume-confirmed breakout detection, active as soon as the box closes
- Three entry modes: midpoint retest, breakout retest, and immediate
- Stop loss and take profit lines (1:1, 1:2, 1:3) drawn on entry
- Trade close detection: dashboard and background reset when stop or final target is hit
- Session liquidity engine with live (dotted) and locked (solid) levels for Asia, London, and NY sessions
- Previous session levels with automatic P. prefix labeling
- Vertical session boundary lines at each session open and close
- Five-point confluence score shown in the dashboard
- Status background coloring: red during wait period, green after entry fires
- Full timezone support: all time inputs in the user's chosen UTC offset
- Dashboard with all live trade and session context
- Nine alert conditions
2. Core concepts
2.1 The opening range box
The box captures the high and low of a configurable time window at the start of the active trading session. The default is the first fifteen minutes of the New York session (14:00-14:15 Amsterdam / 08:00-08:15 New York), which concentrates the most institutional activity of the intraday day. The box is drawn as soon as it closes, with a solid high line, a solid low line, and a dotted midpoint line that extends as the session progresses.
The box range is shown in the dashboard. A narrow box suggests tight price discovery. A wide box suggests early volatility and may require a wider stop if trading it directly.
2.2 The wait period
Breakouts in the first sixty to ninety minutes after a major open are frequently false. Institutional players test liquidity in both directions before committing. The wait period blocks entries from firing until a configurable time, defaulting to 15:30 Amsterdam / 09:30 New York, when the first significant volume wave of the day typically confirms direction.
Critically, breakout direction is still tracked during the wait period. If price breaks above the box high at 14:30 and the wait ends at 15:30, the system already knows the direction is bullish when the active window opens. The entry trigger then watches for the configured retest from that point, without waiting for a new breakout signal.
The wait period can be disabled entirely with the master toggle. With it off, the entry triggers are active immediately after the box closes, which is useful for strategies that do not rely on the NY open timing.
2.3 Entry modes
Three entry modes cover the main ways traders approach ORB setups.
Midpoint retest: the most conservative mode. After a confirmed breakout, the indicator waits for price to pull back to the box midpoint, close on the correct side of it, and then fires the entry signal. This mode is best when the session shows clear reversion behavior after the initial breakout impulse.
Breakout retest: waits for price to retest the box boundary itself (high for a bull breakout, low for a bear breakout) after the initial breakout bar, and fires on a candle that touches the level and closes on the breakout side. This mode suits trending sessions where price breaks cleanly, pulls back briefly to the level, and then continues.
Immediate: fires directly on the confirmed breakout candle. If the breakout happened during the wait period, the entry fires on the first bar of the active window. This is the most aggressive mode and is appropriate when the trader expects strong directional continuation without a pullback.
2.4 Breakout confirmation
A breakout is not registered on a close outside the box alone. The breakout candle's volume must exceed the average volume by a configurable multiplier (default 1.3x). This filters breakouts driven by thin participation, which are more likely to fail on the retest. The volume average and multiplier are both adjustable.
2.5 Stop loss and take profit
The stop loss is placed beyond the opposite side of the box, with a small ATR-based buffer. The buffer multiplier is configurable, allowing tighter or wider placement depending on the instrument and timeframe.
Take profit targets are calculated at 1:1, 1:2, and 1:3 risk-to-reward ratios from the entry level, each toggleable independently. All active levels are drawn as dashed lines from the entry bar and labeled on the chart. The dashboard shows the price levels for active targets.
When the stop is hit or the final active take profit is reached, the dashboard resets to a neutral state. The chart lines remain as a visual record.
2.6 Retest timeout
The retest modes have a configurable bar-count timeout. If price does not return to the required level within that number of bars after the active window opens (or after the breakout, if the wait period is off), the setup expires. The dashboard shows the expired state. The default is 100 bars, which on a 1-minute chart is 100 minutes and on a 5-minute chart is roughly eight hours, so adjust this per timeframe and strategy.
3. Session liquidity engine
3.1 Why session levels matter
Price does not move randomly between sessions. The high and low of the Asia, London, and NY sessions represent pools of resting orders: stops clustered above highs, stops clustered below lows. These are the levels institutional flow targets first. A breakout above the ORB box that is also pushing toward an untested session high is a very different proposition from a breakout into empty space.
The ORB Engine maps these levels automatically and keeps them visible across the session, so the confluence between the ORB setup and the nearest liquidity pool is always visible at a glance.
3.2 Live and locked levels
While a session is in progress, the indicator draws dotted lines for the developing high and low. These lines update in real time as new extremes are set within the window. If price sweeps through what was the high at 03:00 before London has closed, the dotted line moves up immediately, reflecting the new developing high. This prevents the missed sweep problem where a level was set early and then exceeded without the chart updating.
When a session closes, the dotted lines are replaced by solid locked lines. These represent the final confirmed high and low of that session.
3.3 Tested and untested levels
Once a session closes, its levels are tracked for mitigation. If price returns to a locked level and wicks through it, the level is marked as tested by fading to a configurable transparency. It does not disappear. Tested levels can act as re-entry points or warn that a previous pool has been cleared. The untested level count in the dashboard tells you how many unmitigated levels are still active on the chart.
3.4 Previous session levels
When a new session begins, the previous session's locked levels are relabeled with a P. prefix (e.g., P.Asia.H, P.NY.L) immediately at the start of the new session, not when it closes. This makes it immediately clear which levels are current and which are historical. The show previous day toggle controls whether one additional day of locked levels is retained alongside today's.
3.5 Vertical session lines
Vertical lines mark the open and close of each session window in the session's color. Style (solid or dotted) and width are configurable. The lines appear only for the current day and are cleaned up automatically at the next session start.
4. Confluence score
The dashboard shows a five-point confluence score for the current setup, displayed as a bar-style meter (▰▰▰▱▱) with the numeric value alongside. The five criteria are:
1. Box formed: the opening range has closed and the high, low, and midpoint are locked.
2. Volume confirmed: the breakout candle exceeded the volume threshold.
3. Liquidity bias consistent: the breakout direction aligns with the nearest untested session level in that direction (e.g., a bull breakout with an untested high above is a stronger setup than a bull breakout with no untested level overhead).
4. Retest within time: the entry fired before the timeout expired.
5. Risk-to-reward viable: the stop distance is within a configurable multiple of the box range, confirming the setup is not overextended.
A score of 3 or above indicates a setup where multiple factors are confirming each other. A score of 1 or 2 means fewer criteria are met and the setup carries more uncertainty. The score updates live.
5. Timezone and session configuration
All time inputs in the ORB Engine are entered in the user's own timezone. Set your UTC offset once in the Timezone group at the top of the settings, and then enter box start, box end, active window start, session end, and all session liquidity windows in your local clock time. The indicator converts everything to New York time internally.
The dashboard shows a live local clock (Now), the box and active window times in your timezone (Box / Active), and the current UTC offset in the row label so the conversion is always visible.
This design means users in Amsterdam, Dubai, Singapore, or New York all configure the same indicator the same way, in the time they think in, without manually calculating offsets.
6. Status background coloring
The chart background changes state with the setup:
- No background: before the box forms, or after the session ends.
- Red tint: the box has formed and the wait period is active. Entries are blocked.
- Green tint: an entry has fired and the trade is active.
The background colors, their transparency, and whether they are shown at all are individually configurable. The default transparency is high enough to not obscure the candles.
7. Dashboard reference
The dashboard updates on every bar and shows:
Box Status - forming, formed, or —.
Box Range - the distance between the box high and low in ticks.
Wait Status - waiting with remaining minutes, active, disabled, or —.
Breakout - bull, bear, or none.
Entry Mode - the currently selected entry mode.
Midpoint Retest / Breakout Retest / Entry Trigger - the retest status: waiting, fired, expired, or —.
Entry - long, short, or —.
Confluence Score - the five-point bar meter and numeric value.
TP Levels - price levels for each active take profit target, or — if no trade is open.
Session / Untested - the current session name and the count of untested liquidity levels.
Now (UTC offset) - the current local clock time in the configured timezone.
Box / Active - the box window and active window start times in local time.
8. Alerts
Nine alert conditions are available:
- Bull breakout: a volume-confirmed close above the box high.
- Bear breakout: a volume-confirmed close below the box low.
- Long entry signal: a long entry trigger has fired.
- Short entry signal: a short entry trigger has fired.
- Long stop loss hit: the long trade stop has been reached.
- Short stop loss hit: the short trade stop has been reached.
- Long final TP hit: the long trade reached the final active take profit.
- Short final TP hit: the short trade reached the final active take profit.
- Near untested liquidity level: price is within a configurable ATR distance of an untested session level.
9. How to use
9.1 Basic workflow
Set your timezone. Enter the box and session times in your local clock. The wait period defaults to the New York 09:30 open equivalent in your timezone, which is when the most reliable ORB confirmations historically occur.
Let the box form. The dashboard shows the forming state during the box window and transitions to formed when it closes. The box range gives you an immediate read on how much price discovery happened.
Observe the breakout. The system detects breakouts as soon as the box closes, even during the wait period. The dashboard shows the breakout direction and a dot appears on the breakout candle. With the wait period on, the background turns red and entries are blocked.
Wait for the active window. When the wait period ends, the background stays neutral and the entry trigger activates. Depending on the entry mode, it is now watching for a midpoint touch, a boundary retest, or it already fired immediately at the open of the active window.
Check the score. A confluence score of 3 or above with a clean entry signal in the context of a nearby untested session level is the strongest combination the system can produce.
9.2 Entry mode selection
Use midpoint retest on sessions that show clear pullback behavior after the initial breakout impulse. Use breakout retest on sessions that trend strongly but pause briefly at the broken level before continuing. Use immediate when price is moving fast and a retest is unlikely, or when you want to be positioned as early as possible in the active window.
9.3 Session levels as context
Before entering any signal, check which session levels are nearby. An entry directly into an untested opposite-side level is likely to stall or reverse at that level. An entry away from all untested levels, in the direction of the next unmitigated pool, is a cleaner setup. The dashboard untested count and the live chart lines give you this context without any additional tools.
9.4 Illustrative bull scenario
Educational example only. Not a trading recommendation.
The opening range forms between 14:00 and 14:15 with a 20-point range. At 14:35, a candle closes above the box high on 1.6 times average volume. The breakout is confirmed as bull, and the wait period background turns red. At 15:30 the active window opens. Price is still above the box high and the midpoint retest mode is active. At 15:42, price dips back to the midpoint, wicks it, and closes above. The entry fires long. Score is 4/5: box formed, volume confirmed, retest in time, and RR viable. The NY.L below is the nearest untested level, well below the stop, so it is not a concern. TP1 is hit 18 minutes later.
9.5 Illustrative bear scenario
Educational example only. Not a trading recommendation.
A narrow 12-point box forms and breaks below the low at 14:28 on heavy volume. The breakout retest mode is selected. The wait period holds entries. At 15:30, price is trading 30 points below the box low. The system begins watching for a pullback back to the box low. At 15:44, price rallies back to the box low, taps it, and closes below. Short entry fires. Score is 3/5. Stop is placed above the box high with ATR buffer. TP2 is reached before the session ends.
10. Settings reference
Timezone: UTC offset selector for all time inputs and the dashboard clock.
Opening range box: start hour, start minute, end hour, end minute (all in local timezone), box color, box fill transparency, max box history in days.
Wait period: enable toggle, active window start hour and minute, session end hour and minute.
Entry settings: breakout volume multiplier, volume average length, retest timeout in bars, ATR length, stop loss ATR buffer, TP 1:1/1:2/1:3 toggles, SL/TP line projection in bars.
Session liquidity: show toggles for Asia, London, and NY with individual start and end times, colors, tested level transparency, line extend bars, show previous day toggle, label text size, show session vertical lines toggle, vertical line style and width, proximity alert toggle and ATR distance.
Confluence score: maximum risk-to-reward sanity check multiplier.
Dashboard: show toggle, position, text size.
Visualization: wait period background show, color, and transparency; entry active background show, color, and transparency.
11. Known limitations
The ORB Engine is designed for sessions that produce a directional move after the opening range. It performs best when the market has a clear bias — a breakout in one direction that holds and then retests cleanly before continuing.
In choppy, sideways price action, the indicator will produce repeated stop loss hits. If the opening range is narrow and price oscillates around the box boundaries without committing to a direction, a breakout in one direction can be followed immediately by a breakout in the opposite direction. Because the system locks breakout direction on the first confirmed move, subsequent reversals are not re-evaluated as a new setup within the same session. The result in choppy conditions is typically one or two stop loss hits before the session ends without a valid directional move.
This is not a flaw in the indicator — it reflects the reality that opening range strategies depend on directional follow-through. On days where the market is consolidating at the session open, no ORB approach will perform well. The confluence score provides some protection: a score below 3 indicates fewer confirming factors and may warrant sitting on the sidelines. The session liquidity levels can also help — if there is no clear untested level in the breakout direction, the setup has no obvious target and the probability of follow-through is lower.
The volume confirmation filter reduces false breakouts in thin conditions, but it does not eliminate them on highly volatile instruments where even noise candles can exceed the volume threshold. On assets with very low liquidity, the breakout volume multiplier should be raised above the default 1.3 to filter more aggressively.
On very low timeframes such as 1-minute charts, the retest timeout in bars covers fewer minutes. A timeout of 100 bars on a 1-minute chart gives 100 minutes of window. Adjust the timeout per timeframe to reflect how long a valid retest can realistically take on the instrument you are trading.
12. Disclaimer
This indicator is provided for educational and informational purposes only. Nothing in this document or in the indicator output constitutes financial advice or any form of recommendation. Trading financial instruments involves substantial risk of loss. Past performance is not indicative of future results. You may lose all of your invested capital. Anonycryptous accepts no responsibility or liability for any losses incurred as a result of using this indicator.
Indicador

Trend Indicator A + VWAP Band 3 CanNew York Session VWAP with Dynamic Deviation Bands
Overview
This indicator is specifically designed for intraday traders looking to capitalize on the high volatility, volume, and momentum generated during the New York market session open. By combining the Volume Weighted Average Price (VWAP) with customizable deviation bands, this tool helps traders identify key institutional liquidity pools, dynamic support/resistance levels, and high-probability mean-reversion or breakout setups.
Key Features
Session-Optimized Logic: Tailored to track price action accurately around the New York opening bell (15:30 CET / 14:30 CET winter time), filtering out low-volume pre-market noise.
Dynamic Deviation Bands: Multi-layered bands act as volatility-adjusted overbought and oversold zones, adapting instantly to sudden market expansions.
Intraday Precision: Ideal for scalping and day trading highly liquid instruments such as market indices (NAS100, US30) and commodities (XAUUSD).
How to Use & Trade Setup
Mean Reversion (The Fade): Look for price exhaustion at the outer deviation bands during the initial New York open rush. A rejection candle at these extremes often signals a high-probability retracement back to the VWAP baseline.
Trend Following (The Breakout): If price breaks and closes decisively outside the first deviation band with strong volume during the first hour of the NY session, it often validates a strong institutional trend.
VWAP Cross: Use the central VWAP line as a dynamic bias filter. Trading above the VWAP indicates bullish sentiment, while trading below indicates bearish control.
Disclaimer: This indicator is for educational and analysis purposes only. Always combine technical indicators with strict risk management and a defined trading plan. Indicador

Indicador

Kurdistani Bitcoin Spiral - Historical Logarithmic VisualizationKurdistani Bitcoin Spiral — Live Historical Logarithmic Visualization
Overview
Bitcoin Spiral is an interactive visualization of Bitcoin's complete historical price evolution, displayed as a logarithmic spiral.
Each calendar year corresponds to one full revolution around the center, while the distance from the center represents price on a logarithmic (log10) scale. This allows more than sixteen years of Bitcoin history to be explored within a single, compact chart.
Although logarithmic spiral representations of Bitcoin have appeared as static illustrations for years, this indicator brings the concept to TradingView as a fully interactive Pine Script implementation with live updates, configurable visualization layers, and efficient rendering.
This indicator is intended for historical exploration, education, and visual analysis. It is **not** a forecasting model, does **not** predict future prices, and does **not** generate buy or sell signals.
---
Features
• Complete Bitcoin history from the 2009 Genesis Block through the present in a single spiral.
• Historical Halving events displayed as ring-and-dot markers.
• Major cycle bottoms highlighted with diamond markers.
• Historical All-Time Highs shown as comet-style trails that illustrate each rally into its peak.
• Live **Now** marker using `request.security()` with a user-selectable data source (default: Bitstamp:BTCUSD).
• Optional real-time continuation connecting the curated historical backbone to the latest market price.
• Current calendar year highlighted with an eased radial gradient wedge.
• Logarithmic price grid from **$1** to **$1M**.
• Eight year spokes with four emphasized calendar axes.
• Fully configurable colors, visibility, density, line widths, glow effects, and background.
• Compact legend matching the actual marker shapes used on the chart.
---
How It Works
The indicator is generated from a manually curated historical backbone consisting of approximately one hundred reference keyframes.
Each keyframe stores an approximate historical time and price.
For any intermediate date, price is calculated using logarithmic interpolation between the two nearest keyframes. The lookup uses binary search over the sorted keyframe table, providing efficient O(log n) performance.
Each *(time, price)* pair is converted into polar coordinates:
* **Angle** represents the position within the calendar year.
* **Radius** represents the logarithm of price.
The resulting coordinates are transformed into TradingView chart coordinates using `polyline.new()`, `line.new()`, and `label.new()`.
When the historical backbone ends, an optional live continuation extends the visualization using the latest available daily close from the selected market symbol.
For performance reasons, the historical visualization is rendered only once. During realtime updates, only the live marker, live continuation, and (if applicable) a new live ATH marker are updated.
---
Curated Data vs Live Data
### Curated Historical Data
The following elements are manually maintained and remain fixed until the script is updated:
* Historical spiral
* Halving markers
* Major cycle bottoms
* Historical ATH markers
* ATH run-up trails
These elements are derived from the embedded historical keyframe dataset.
### Live Data
Only the following components update with incoming market data:
* Live "Now" marker
* Optional live continuation
* Live ATH marker (when price exceeds the latest curated ATH)
No historical data is modified or overwritten.
---
Reading the Spiral
The spiral is designed to emphasize Bitcoin's long-term structure rather than day-to-day price fluctuations.
* Angle indicates where a point falls within its calendar year.
* Radius represents price on a logarithmic scale.
* Equal radial spacing represents equal percentage changes rather than equal dollar changes.
* The highlighted wedge identifies the current calendar year.
* ATH comet trails visualize the acceleration leading into historical market peaks.
The chart is intended to help explore long-term market structure, historical cycles, and price evolution—not to predict future market behavior.
---
Engineering Notes
Version 5 focuses primarily on architecture, performance, and maintainability.
Key improvements include:
* Binary-search price lookup replacing linear scans.
* Unified marker rendering through a single reusable function.
* Centralized logarithmic radius mapping.
* Improved eased radial gradient for the current-year wedge.
* More maintainable rendering architecture for both static and live objects.
The historical dataset currently remains embedded inside the script.
The preferred long-term architecture is to publish the dataset as a separate Pine Library and import it into the indicator. The current implementation is already organized so that such a migration would require changes only within the data section.
---
Current Pine Script Limitations
Some visual behaviors are limited by the current Pine Script rendering engine rather than by the indicator itself.
These include:
* Perfect zoom-independent circular geometry is not possible because the horizontal axis is based on bar indices while the vertical axis represents price values.
* Pine Script does not provide access to viewport dimensions, zoom level, or aspect ratio, preventing automatic geometric correction.
* No visible-range API exists for dynamic label placement or clipping.
* Objects using `xloc.bar_index` cannot be positioned more than approximately 500 bars into the future, limiting outward label placement.
These are platform limitations rather than implementation limitations.
---
Future Development
Possible future improvements include:
* Migrating the historical dataset into a dedicated Pine Library.
* Extending the curated historical backbone as Bitcoin continues to evolve.
* Automatic cycle-bottom detection if a reliable forward-looking methodology becomes available.
* Additional structural refinements as Pine Script evolves.
---
Usage
Every visual layer can be enabled or disabled independently, including:
* Grid
* Year spokes
* Current-year wedge
* ATH markers
* Bottom markers
* Halvings
* Legend
* Background
* Glow effects
Colors, line widths, density, and the live data source are fully configurable.
---
Disclaimer
This indicator visualizes Bitcoin's historical price evolution using a logarithmic spiral coordinate system.
It is intended solely for visualization, historical exploration, and educational purposes.
It does **not** predict future prices, does **not** imply future cycle repetition, and should **not** be used as the sole basis for investment or trading decisions.
Past market behavior, including historical cycle geometry, is **not** indicative of future results. Indicador

Indicador

Indicador

Donchian Breakout with ATR Trailing Stop (Trend Following)A simple, transparent trend-following strategy: a classic Donchian
(turtle) channel breakout with a single ATR-based trailing stop.
It was deliberately built to be robust across markets rather than
curve-fit to one — the same code and settings held up on both an
equity index (DAX/GER40, 1h) and Bitcoin (BTCUSD, 4h), and across
trailing multipliers of 2.5–3.5.
HOW IT WORKS
- Entry: goes long when price closes above the highest high of the
last N bars (default 20) while above the 200 EMA trend filter.
Short side is optional and off by default.
- Exit: one ATR-based trailing stop (distance = ATR × multiplier,
default 2.5, fixed at entry). It serves as both the initial
protective stop and the trailing exit — cutting losses and letting
winners run, fully automatically. No separate exit signal needed.
- Risk: size is derived from a fixed % risk per trade against the
stop distance (compounding), with optional risk and leverage caps.
- Optional weekend-flat close for instruments with gap risk.
HOW TO USE
- Best on genuinely trending markets. Try it on your own instrument
and timeframe.
- Tune the risk % to your own drawdown tolerance, and the ATR
multiplier to taste (2.5–3.5 behaved similarly — a good sign the
edge isn't fitted to one value).
- Built-in alerts: the entry alert gives you the trailing-stop
distance to set on your broker; the trailing stop handles the exit.
WHAT TO EXPECT — READ THIS
- It's a breakout system, so win rate is LOW: ~40–45% is normal.
The edge is that winners are bigger than losers, not that you're
right often. Judge it by profit factor and drawdown, not win rate.
- Expect long flat/drawdown periods in choppy, range-bound markets.
It performs when markets trend.
- COSTS DECIDE EVERYTHING. Set your own broker's spread/commission
in the properties before trusting any result. Something that looks
great at zero cost can be break-even or worse once real spreads —
and, for leveraged CFDs, overnight financing — are included.
Results vary a lot by broker and instrument.
NOTES
- No repainting: entries use the prior bar's channel; the trailing
stop only ratchets in the trade's favor.
- Not financial advice. Past backtest results do not guarantee
future performance. Always test on your own market, timeframe and
broker costs, and only risk what you can afford to lose. Estrategia

Sphinx Gamma TerrainSphinx Gamma Terrain renders options dealer-gamma positioning - gamma flip
levels and call/put walls across multiple expiries - as a structural map on
your chart. It is a context layer that shows where the gamma structure sits
and which regime price is trading inside. It does not generate buy/sell
signals, predictions, or automated trades.
Why it is original
Pine Script cannot fetch external options data such as dealer gamma exposure,
flip levels, or wall strikes. This tool solves that by taking a compact text
export of gamma levels and turning it into on-chart terrain. Two things make
it distinct from a plain level-drawing script:
1. A symbol-aware parser reads a full multi-instrument, multi-expiry gamma
export in a single paste and locks onto the current chart's instrument
(an ES/MES chart pulls the ES block), so a stacked NQ or GC block cannot
overwrite it.
2. A graduated, count-based regime model. Instead of a flat two-colour zone,
the shading deepens according to how many flip levels price sits above or
below, split at the median flip - so the depth of the positive- or
negative-gamma regime is readable as tone rather than a single on/off band.
It is provider-agnostic: it works with any gamma/GEX source. Either paste a
string in the documented format, or type the levels in manually. Nothing is
hard-wired to one vendor.
The three layers
- Flip ladder: gamma flip levels for near, mid and far expiries. The reactive
near-term flip is dashed; the more stable mid/far flips are dotted and drawn
thicker, because they define the regime frame.
- Regime shading: green (fade) above the flips, where positive gamma tends to
suppress moves and mean-revert; red (trend) below, where negative gamma
tends to amplify. Tone deepens with regime depth, and the green/red split
lands on the median flip so the two never overlap.
- Confluence walls: call and put walls across expiries, clustered so walls
within a tolerance band merge into a single reversal zone. A multi-strike
cluster is drawn as a translucent band spanning its strikes, tagged with the
number of hits - the heavy multi-expiry shelves stand out from lone walls.
How to use it
1. Choose an input mode. Paste string auto-parses an export of the form
SYM.DTE:F|CW|PW, with expiries separated by
semicolons. Manual levels lets you type each flip and wall set yourself;
any field left blank is simply not drawn.
2. The tool locks to your chart's instrument and draws that instrument's
flips, regime zones and walls.
3. Read the terrain as a frame, not a trigger: note which regime price is in,
where the nearest flip or wall reversal zone sits, and how the tenors
stack. Combine it with your own timing and execution method.
Inputs
Flips, regime zones and walls each have independent visibility, colour,
opacity and width controls. The regime shading exposes six opacity tiers
(three each direction) so you can tune how strongly depth reads. Wall cluster
tolerance is adjustable - widen it to treat a band of strikes as one reversal
zone, tighten it for per-strike reads. Defaults are tuned for a dark theme and
can be dialled back for live use.
Limitations
- The data is external and static: the tool draws whatever you last pasted or
typed. It does not auto-update - refresh your gamma export when the structure
changes (for example at the open, mid-session, or on a flip crossing).
- It is a positioning and context map, not a signal engine. There are no
alerts, entries, or performance claims, and gamma levels always require
judgement in context.
- Level accuracy depends entirely on your data source. Indicador

Indicador

Modern Bollinger Bands [GBB]Modern Bollinger Bands
I rebuilt Bollinger Bands. Not because the original is bad, John Bollinger's work has held up for forty years, but because the defaults everyone uses were designed for daily stock charts in the 1980s and we're putting them on crypto perps at 3am.
WHAT'S WRONG WITH THE CLASSIC
Five things, in my view.
The window is always 20 bars. Doesn't matter if the market is in a fast news week or a dead summer range, you get the same 20.
The bands assume returns follow a bell curve. Asset returns have fat tails, so price pokes outside a two sigma band far more often than the theory says it should.
A band touch has no meaning on its own. In a range, fading the touch works okay. In a trend, price walks down the band and runs over every single fade. The classic gives you nothing to tell those two situations apart, and that's the flaw that costs people real money.
The SMA basis is slow. Equal weight on every bar means the middle line describes the market as it was roughly ten bars ago.
And band width isn't comparable to anything. What counts as narrow on one chart means nothing on another, so squeeze thresholds end up being eyeballed.
WHAT I CHANGED
The length adapts. An Ehlers homodyne discriminator measures the dominant cycle in price and the window becomes half of it, between 10 and 50 bars. When there's no measurable cycle because the market is trending too hard, the length freezes at the last good value instead of guessing.
The basis is a KAMA instead of SMA. It speeds up when price is actually going somewhere and almost stops updating in chop.
The bands are percentile bands, not sigma bands. 97.5th and 2.5th percentile of the real deviations around the basis, nearest rank, over a longer window. Your market's actual tails, not a textbook bell curve.
I added a regime filter: Kaufman efficiency ratio, percentile ranked against the last 252 bars, with 70/55 hysteresis so it doesn't flip flop on the boundary. Blue bands are RANGE, orange bands are TREND, and the signals respect the color.
And the squeeze is a score from 0 to 100. Percentile rank of band width against the last year of bars. A score of 8 reads the same on every symbol and every timeframe.
THE SIGNALS
Three types, that only trigger on candle close, so there is nothing repainted.
Singal1: Blue triangles. The classic fade, but only where it belongs. Price closes outside a band, the next bar closes back inside, and the regime is RANGE. In TREND this signal simply doesn't exist.
Singal2: Orange circles. Trend pullback. Price dips into a zone around the basis, then closes back in the trend direction. TREND only and with the trend only. One thing about the chart markers: in a long trend this setup can fire on several nearby bars, so the chart draws the first circle of a cluster and skips the repeats for a few bars, so the chart does not get too cluttered.
Signal3: Diamonds. Squeeze release after at least 5 bars of squeeze, then the squeeze ends and price closes outside a band on that same bar. Important: While this is the most intuitive setup of the three and it's the one my testing supports least. Release events showed the same forward 20 bar volatility as typical bars from the same hours. Volume confirmation didn't help either, I tested that separately. The diamonds mark a real event, compression ended and price left the bands, but whether that's worth anything is a question my data answered with no. I included the signal and alert for it anyway, because I know many of you will want it.
SETTINGS
Everything above is a toggle. The groups match the settings dialog, so here's what each one actually does and when you'd touch it.
Adaptive length: Length mode switches between Adaptive and Fixed. Adaptive is the point of this indicator. Fixed with the default of 20 exists for two reasons: reproducing the classic, and for people who want to trust their own number. The fixed length input only matters in Fixed mode.
Basis / bands: Basis picks KAMA or SMA for the middle line, bands picks Robust (percentile) or Stdev (classic sigma). Set Fixed 20 plus SMA plus Stdev and you have exact 1980s Bollinger Bands, that combination is deliberately supported. The stdev multiplier (2.0) only applies in Stdev mode. The robust percentiles (97.5 and 2.5) set where the bands sit in the deviation distribution, pull them toward 95/5 if you want more touches and more signals, push them out if you want only the extremes. The robust window multiplier and floor control how much history the percentile estimate uses, 4 times the adaptive length with a floor of 80 bars by default. Shorter windows react faster to volatility shifts but the tail estimates get noisy, I would leave these alone unless you know why you're changing them. KAMA fast and slow (2 and 30) are the standard Kaufman speeds, the basis moves between a 2 period and a 30 period EMA depending on how efficient the move is.
Regime / squeeze: KER length (20) is the window for the efficiency ratio itself. The percentile rank window (252) is what "recent history" means for both the regime and the squeeze score, about one year of daily bars, about ten days on 1h. TREND enter (70) and TREND exit (55) are the hysteresis levels: the market has to rank above the 70th percentile in efficiency to be called TREND and drop back below the 55th to be called RANGE again. Widen the gap and the regime switches less often but later, narrow it and you get earlier calls with more flip flops. These defaults sat on a flat plateau in sensitivity testing, meaning nearby values gave nearly identical results, so there's no magic in 70/55, but there's also nothing to gain from tuning them. Squeeze threshold (20) defines squeeze as band width below the 20th percentile, and min bars in squeeze (5) stops one bar dips from counting as compression.
Signals: One input, the S2 touch fraction (0.25). It sets how close to the basis a pullback has to come, measured as a fraction of the band halfwidth. Smaller means stricter pullbacks and fewer S2 signals.
Display: Clean display preset strips everything down to the three lines, no fill, no markers, no panel. The info panel (regime, KER percentile, adaptive length with its frozen flag, squeeze score, last signal) is off by default, turn it on when you want to see what the indicator is "thinking". Signal markers and the squeeze heat on the band fill can be switched off separately. The S2 marker debounce (5) is the cosmetic cluster filter from the signals section, set it to 0 if you want every circle drawn.
Parity: You can ignore this group for trading. It pins the computation start to a fixed timestamp so every value on the chart can be reproduced bar for bar against a Python reference implementation. It's how the validation was done and it stays in so anyone can check my work.
ALERTS
Six per signal alerts plus the combined JSON one with symbol, timeframe, signal, regime, squeeze score and band levels. Once per confirmed bar close, built for webhook bots.
No indicator prints money, this one included. It tells you regime, structure and volatility state, with the evidence behind each part published, nulls and all. Trade safe. Indicador

Liquidity Entry Signals [MarkitTick]💡 A comprehensive, multi-faceted approach to identifying potential market reversals based on classic liquidity sweep mechanics. By scanning for instances where price briefly breaches a significant structural high or low before immediately rejecting and closing back within the range, this tool highlights areas where trap-based price dynamics may be in play. It is designed to offer a complete trading framework rather than just a simple signal, integrating dynamic stop-loss and take-profit plotting, real-time advanced dashboard analytics, and comprehensive alert payloads. This indicator assists in bridging the gap between raw price action analysis and structured trade management.
● ✨ Originality and Utility
Many basic technical indicators simply look for higher highs or lower lows without assessing the quality of the rejection. This script elevates that concept by requiring strict closing conditions to validate a sweep. What truly sets it apart is its integration of multiple intelligent filters. Rather than relying on price action alone, users can mandate that sweeps align with the prevailing trend, occur during periods of sufficient volatility, and are backed by relative volume strength.
Additionally, the built-in risk management visualizations automatically calculate position risk parameters right on the chart. By projecting stop-loss and take-profit levels based on current volatility, it transforms a static signal into an actionable trade plan. The inclusion of dynamic JSON payload generation for alerts also makes this an incredibly versatile tool for those looking to automate their execution through third-party platforms.
● 🔬 Methodology and Concepts
The core logic of this script is built around the concept of a liquidity sweep, verified through price action closes, and filtered through statistical market conditions.
Bullish Sweep: The script continuously calculates the lowest low over a user-defined lookback window. A valid bullish signal occurs when the current bar's lowest price penetrates this recent low, but the closing price decisively reclaims it by closing higher than the structural low and higher than its own open.
Bearish Sweep: Conversely, the script identifies the highest high over the recent lookback period. If the current bar's high breaches this level, but the close falls below the recent high and below its own open, a short signal is triggered.
Trend Filtration: The indicator uses a Simple Moving Average (SMA) on both the current chart and a selected higher timeframe to establish a directional bias. Signals that conflict with these moving average baselines are suppressed to prevent counter-trend trading.
Volatility and Volume Analysis: The script evaluates the Average True Range (ATR) as a percentage of the current closing price to ensure sufficient market movement is present. It also compares the current volume to a standard moving average of volume, filtering out setups that lack participation.
● 🎨 Visual Guide
The script draws extensive visual overlays to assist in real-time decision-making and trade management.
• Signal Labels
When a valid sweep occurs, an "LS" label is plotted. Green labels positioned below the candle indicate bullish setups, while red labels above indicate bearish setups.
• Trade Execution Lines
Upon a signal, the indicator projects trade management lines directly on the chart for the next 50 bars.
Entry Line: A dashed blue line marking the closing price of the signal bar.
Stop Loss (SL): A solid red line placed away from the entry, calculated based on the ATR multiplied by the user's risk factor.
Take Profit (TP): Three dashed teal lines representing Take Profit 1, 2, and 3. These are calculated using specific Risk-to-Reward multiples of the stop-loss distance.
• Risk and Reward Zones
Semi-transparent colored fills visually separate the trade zones. A red fill highlights the risk zone between the entry and the stop loss, while a teal fill highlights the reward zone extending from the entry to the final take-profit level.
• Advanced Dashboard
A multi-row informational table appears in the selected corner of the chart. This dashboard provides a real-time status check of the prevailing trend bias, the number of bars since the last signal, exact entry/SL/TP price levels, current ATR, and visual progress bars for volatility and signal cooldown periods.
● 📖 How to Use
Traders can utilize this script as a complete top-down methodology for analyzing market structure. First, observe the dashboard to confirm that the current market environment aligns with your desired filters (e.g., ensuring the higher timeframe trend is supportive and volume thresholds are met).
When a valid "LS" label appears on the chart, immediately note the projected Entry, Stop Loss, and Take Profit lines. The dashed blue line serves as your reference for a potential entry point. You can calculate your position sizing based on the fixed distance between this blue Entry line and the solid red Stop Loss line.
The three Take Profit levels allow for a tiered approach to trade management, enabling partial profit-taking as the price advances in your favor. Advanced users can configure the custom string inputs to send highly detailed webhook payloads directly to execution platforms, passing the exact dynamically calculated price levels directly to their broker.
● ⚙️ Inputs and Settings
The script is highly customizable through categorized input groups, allowing adaptation to any asset class or timeframe.
• SMC Settings
Sweep Lookback: Defines the number of historical bars used to calculate the structural high and low points.
• Smart Filters
Trend Filter: Enables an SMA condition to dictate the allowed signal direction.
Volatility Filter: Requires the ATR to be a minimum percentage of the asset's price before a signal can fire.
Volume Filter: Demands that the current bar's volume exceeds a defined multiple of the volume moving average.
HTF Timeframe: Selects the specific higher timeframe used for long-term trend alignment.
Signal Cooldown: Prevents consecutive signals within a specified number of bars to reduce chart noise during extended consolidations.
• Trade Tools
SL ATR Mult: Determines the distance of the Stop Loss based on the current ATR, adjusting risk based on market volatility.
TP1 / TP2 / TP3 RR: Sets the specific Risk-to-Reward multiples for the three profit targets.
• Alerts
Action Strings: Customizable fields to inject specific commands into the JSON alert payloads for entries, exits, and partial take-profits.
● 🔍 Deconstruction of the Underlying Scientific and Academic Framework
From a market microstructure perspective, liquidity sweeps represent a temporary imbalance in supply and demand. In auction market theory, price frequently probes beyond established boundaries to test for the presence of resting orders. When price penetrates a historical extreme but fails to sustain value there—evidenced by the immediate reversal and closing within the prior range—it indicates an absorption of liquidity by counter-trend market participants. This exhaustion of directional momentum is a well-documented phenomenon in order flow analysis.
To normalize these price extensions, the indicator applies the Average True Range (ATR). Developed by J. Welles Wilder, the ATR provides a robust statistical measure of absolute price volatility, capturing gaps and limit moves that standard standard-deviation metrics might underrepresent. By tying the Stop Loss logic directly to the ATR, the indicator adapts to heteroskedasticity, which is the changing variance of asset returns over time. This ensures that risk parameters dynamically widen during highly volatile periods to prevent premature stop-outs, and contract during quiet phases to optimize capital efficiency.
Furthermore, the reliance on moving averages for trend and volume filtration applies fundamental time-series smoothing. This inherently mitigates the noise of high-frequency price fluctuations, ensuring that the localized microstructure event (the sweep) is aligned with the macro directional drift of the broader dataset.
⚠️ Disclaimer
All provided scripts and indicators are strictly for educational exploration and must not be interpreted as financial advice or a recommendation to execute trades. We expressly disclaim all liability for any financial losses or damages that may result, directly or indirectly, from the reliance on or application of these tools. Market participation carries inherent risk where past performance never guarantees future returns, leaving all investment decisions and due diligence solely at your own discretion. Indicador

Theta Decay Tracker [AlgoChief]Theta Decay Tracker
What This Indicator Does
When you're holding an option and the underlying index moves, the option's premium doesn't always move the way you'd expect. Part of the gap is Delta (how much the option should move per point of index movement), and part of it is Theta (time decay) eating into your premium — even when the index hasn't reversed.
This indicator separates those two effects on every candle, so you can see exactly how many points you lost purely to time decay, independent of index direction.
How It Works (Logic)
Fetches the underlying index price (NIFTY, BANKNIFTY, FINNIFTY, MIDCPNIFTY, SENSEX, or any custom symbol) alongside your option chart, using request.security on the same timeframe (no repainting, no lookahead).
Solves Implied Volatility live from the option's own closing price using a Newton-Raphson iteration on the Black-Scholes formula — no need to manually check the option chain for IV.
Calculates real-time Delta and Theta using the standard Black-Scholes model (Strike, Time-to-Expiry, IV, Risk-Free Rate).
Compares actual vs expected move, every candle:
Expected Option Move = Delta × Index Move
Decay = Actual Option Move − Expected Move
If Decay is negative while the index barely moved, that gap is mostly time decay (plus minor vega/gamma effects).
Tracks cumulative decay over a configurable lookback window (e.g., last 15 candles) and fires an alert when decay crosses your threshold while the index stays flat/no reversal — this is the clearest signal of pure theta bleed.
How to Use It
Add the indicator to your option's chart (not the index chart).
In settings, pick your Index Preset (NIFTY/BANKNIFTY/FINNIFTY/MIDCPNIFTY/SENSEX) or choose Custom and enter your own symbol.
Enter the Strike Price, Option Type (CE/PE), and Expiry Date & Time.
Leave "Auto-solve IV" ON (recommended) — it reads IV directly from the option's live price.
Adjust the Decay Alert settings:
Lookback (bars) — the time window to check
Decay Threshold — how many points of unexplained loss triggers an alert
Flat Threshold — how much index movement still counts as "no reversal"
Set a TradingView alert on "Theta Decay Threshold Hit" to get notified in real time.
What It Helps With
Knowing whether your option is losing value because the index moved against you, or purely because of time decay — critical for deciding whether to hold, exit, or roll a position.
Spotting theta acceleration near expiry, especially during range-bound/sideways sessions.
Avoiding the common mistake of blaming "index isn't moving enough" when the real issue is decay eating the premium regardless.
Works on any NSE/BSE index option (or global index options via Custom symbol).
Panel Elements
Green/Red columns: Decay per candle (green = option outperformed delta expectation, red = decayed more than expected)
Orange line: Theoretical Black-Scholes theta/day, for reference
Purple line: Cumulative decay over your lookback window
Red background zone: Marks bars where the decay alert condition is active
Table (top-right): Live IV, Delta, Theta/day, Index move, Expected move, Decay, and Cumulative decay
Important Notes / Disclaimer
This is a Black-Scholes approximation, not a live options-chain feed. The "Decay" value bundles theta with minor vega/gamma effects — it is not a pure isolated theta number.
IV is solved from the option's own price using Newton-Raphson; in illiquid/wide-spread strikes, solved IV can be noisy on individual ticks — use candle-close values for reliability.
This tool is for educational and analytical purposes only. It does not predict future price movement and is not financial advice. Always do your own due diligence before making trading decisions.
Works best on liquid strikes (near or at-the-money) where bid-ask spreads are tight and Black-Scholes assumptions hold reasonably well. Indicador