Vortex MTFUnderstanding Vortex Indicator (VI)
The vortex indicator was first developed by Etienne Botes and Douglas Siepman who introduced the concept in the January 2010 edition of “Technical Analysis of Stocks & Commodities.” The vortex indicator is based on two trendlines: VI+ and VI-.
What is the Vortex Indicator (VI)?
A vortex indicator (VI) is an indicator composed of two lines - an uptrend line (VI+) and a downtrend line (VI-). These lines are typically colored green and red respectively. A vor
Indicador Vortex (VI)
RWI StrategyA test of the RWI used purely for long/short signals proves surprisingly profitable on 3H and 4H XBTUSD and ETHUSD.
Estrategia
Random Walk Index 1337A modification of the original Random Walk Index (RWI) script by everget, this one updates to version 4 and adds a threshold value and colouring.
If both high and low are below the default threshold of 1.0 the line chart will be coloured in grey.
Adjusting the length and threshold should allow you to see flat and choppy periods.
Indicador
Vortex Trend Tracker 2.0 + RSIHere's an updated version of our Vortex Trend Tracker indicator.
Here's the link to the original if anyone wants to read more about the Vortex or see the first version:
We've added in 4 rsi's of varying lengths for this second version(2 fast and 2 slow) that create the background color effect.
Indicador
Vortex Trend TrackerThough it may sound complex, the Vortex Indicator is essentially an uptrend line and a downtrend line. The vortex indicator can be used for a variety of purposes, including tracking the strength of trends, identifying/anticipating reversals, and generating entry/exit signals. It’s calculation is shown in the open-source code below.
To reduce the number of whipsaws produced by the indicator, we used an Exponential Moving Average of vmPlus and vmNegative values with a default length of 10. Decre
Indicador
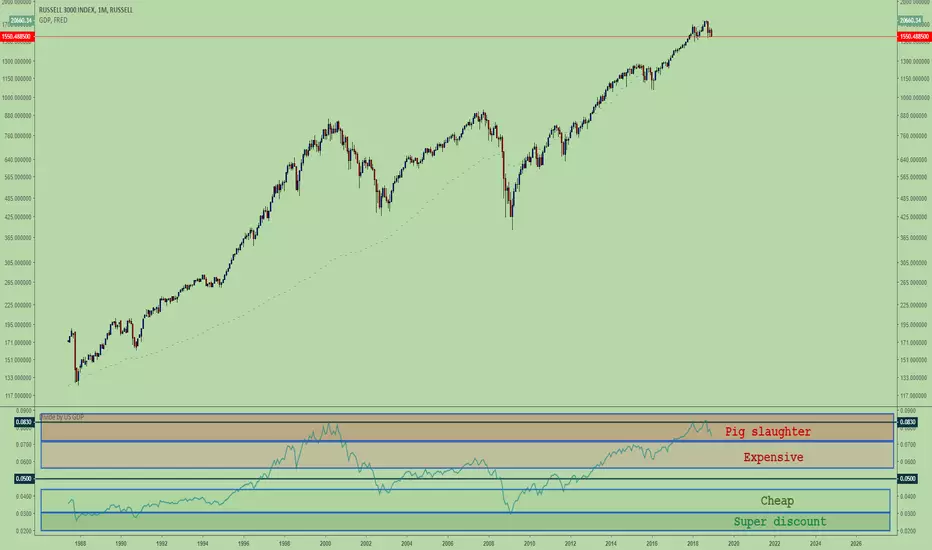
Buffet indicatorI was tired of not having something to compare the real economic strength of a country (US only for now...) to it's companies valuations.
So I made my own! Trading view does not have the wilshire indice, but it has the Rus 3000, good enough, & the US GDP since 1946 so this is what I am using.
Warren Buffet is famous for liking this so now the idea has its name. Let's call it the Buffet indicator (I doubt the only one that had the idea).
This indicator can be used on any indice thought, even on
Indicador
Indicador
drnkk StrategyStrategy based upon combination with, ROC of Vortex, modified RSI, modified Price ROC,
Bu da mı gol değil?
Estrategia
Indicador
Vortex Indicator w/ MACD HistoVortex Indicator showing Positive and Negative buying pressure. Included is a MACD Histogram that has been adjusted to the 1.00 plot line as base line instead of 0.00
Indicador
Vortex Indicator with Thresholds DefinedA problem I noticed with the built in Vortex indicator was that it didn't include any defined thresholds that are important to understanding how to read the vortex indicator. So I modified the vortex indicator in order to have the thresholds built in so you don't have to draw horizontal lines on your chart.
Indicador