
Sahara Petrochemical Company — Trade Plan Date: 15 Feb 2026
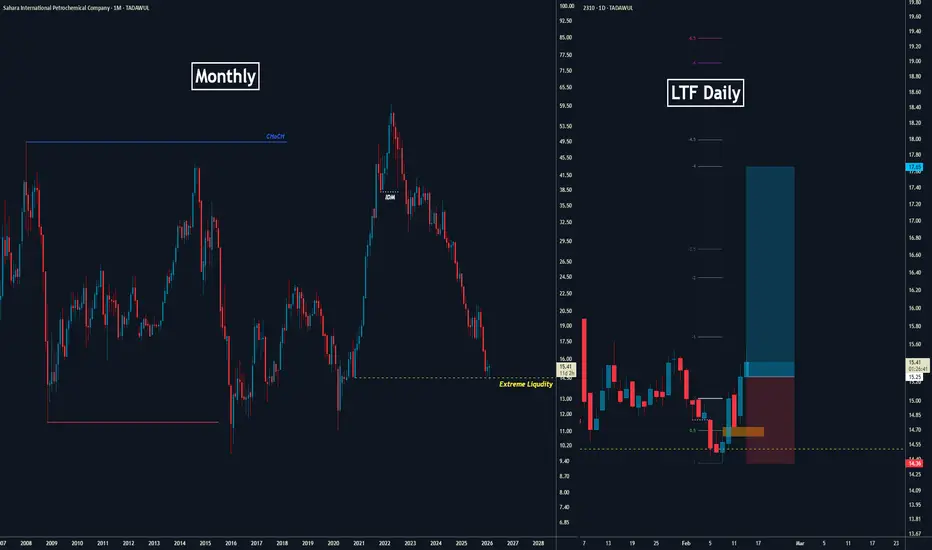
Sahara Petrochemical Company — Trade Plan
Date: 15 Feb 2026
Higher Timeframe (Monthly):
Price has already swept the extreme liquidity resting below the long-term structure. After taking those lows, the market stopped falling aggressively, showing selling pressure is exhausted. This usually signals accumulation and a possible repricing move upward.
Lower Timeframe (Daily):
The daily chart has printed a clear market structure shift. A prior swing high was broken and sellers lost control, which confirms buyers are stepping in.
Bias
Bullish
We are no longer looking for sells. The focus is to participate in the upside move.
Entry Plan
Do not chase the rally.
Wait for a pullback into a daily demand / bullish FVG (discount area).
Enter after:
a bullish reaction candle, or
a small timeframe break of structure inside the zone.
Risk
Stop loss: below the retracement low (below demand zone).
Targets
Previous daily highs (near liquidity)
Range highs above price
Invalidation
If price closes strongly below the liquidity-grabbed monthly low and daily structure turns bearish, the idea is cancelled.
Summary:
Monthly liquidity taken + Daily structure shift = high-probability bullish campaign.
Patience for retracement is the key.
Date: 15 Feb 2026
Higher Timeframe (Monthly):
Price has already swept the extreme liquidity resting below the long-term structure. After taking those lows, the market stopped falling aggressively, showing selling pressure is exhausted. This usually signals accumulation and a possible repricing move upward.
Lower Timeframe (Daily):
The daily chart has printed a clear market structure shift. A prior swing high was broken and sellers lost control, which confirms buyers are stepping in.
Bias
Bullish
We are no longer looking for sells. The focus is to participate in the upside move.
Entry Plan
Do not chase the rally.
Wait for a pullback into a daily demand / bullish FVG (discount area).
Enter after:
a bullish reaction candle, or
a small timeframe break of structure inside the zone.
Risk
Stop loss: below the retracement low (below demand zone).
Targets
Previous daily highs (near liquidity)
Range highs above price
Invalidation
If price closes strongly below the liquidity-grabbed monthly low and daily structure turns bearish, the idea is cancelled.
Summary:
Monthly liquidity taken + Daily structure shift = high-probability bullish campaign.
Patience for retracement is the key.

I am an SMC & ICT Master, specializing in Market Structure, Liquidity, and Order Flow. With a razor-sharp focus on precision trading, I navigate the markets with strategy and discipline—turning probabilities into profitability!
Publications connexes
Clause de non-responsabilité
Les informations et publications ne sont pas destinées à être, et ne constituent pas, des conseils ou recommandations financiers, d'investissement, de trading ou autres fournis ou approuvés par TradingView. Pour en savoir plus, consultez les Conditions d'utilisation.
I am an SMC & ICT Master, specializing in Market Structure, Liquidity, and Order Flow. With a razor-sharp focus on precision trading, I navigate the markets with strategy and discipline—turning probabilities into profitability!
Publications connexes
Clause de non-responsabilité
Les informations et publications ne sont pas destinées à être, et ne constituent pas, des conseils ou recommandations financiers, d'investissement, de trading ou autres fournis ou approuvés par TradingView. Pour en savoir plus, consultez les Conditions d'utilisation.