
For investors with a long-term horizon, Toshiba may be an interesting stock to keep on the watchlist.
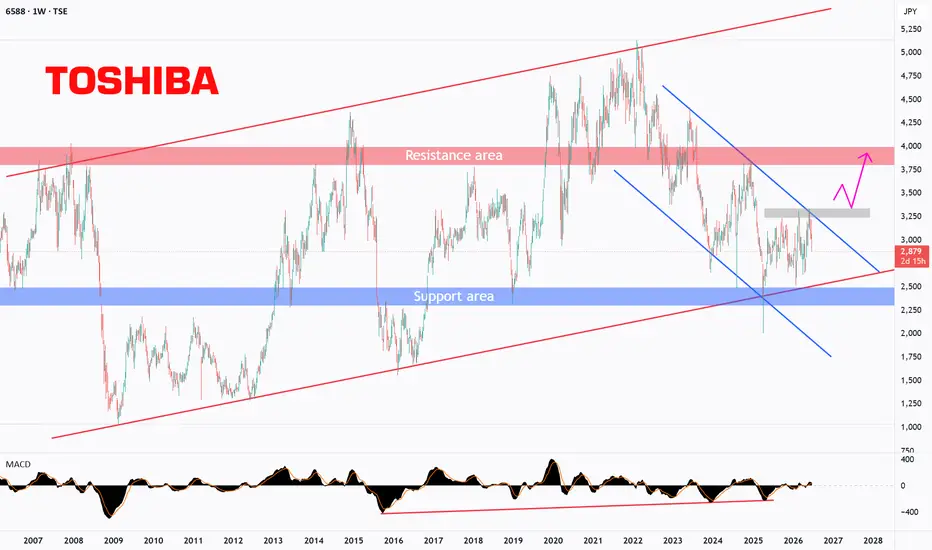
From a broader perspective, price has been respecting a large ascending red channel for many years, reflecting a long-term upward structure despite periods of correction.
At the moment, the stock appears to be moving through a corrective phase, trading inside a shorter-term descending blue channel within the broader bullish structure.
What makes the current location especially interesting is that price is now testing an important blue support area that has been respected multiple times since 2018 without a successful breakdown.
This support also aligns with the lower boundary of the broader ascending channel, creating a strong technical confluence zone.
In addition, we can observe the development of bullish divergence, suggesting that downside momentum may be weakening and that the market could be preparing for a shift in direction.
From here, two scenarios become relevant:
→ Bullish scenario:
If support continues holding and buyers regain momentum, this area may become an attractive region to monitor for the next long-term bullish phase. However, for stronger confirmation, price would ideally need to break above the selected grey area around 3350, as this could signal the beginning of a broader recovery phase.
→ Bearish scenario:
If support eventually fails to hold and the broader channel loses structure, the corrective phase may extend and delay the long-term bullish outlook.
For now, the focus is not on predicting the reversal — but on watching whether price can defend support and reclaim key resistance levels.
This is a scenario-based analysis — not a prediction.
Disclaimer: This analysis is shared for educational purposes only. It reflects personal market observations and does not constitute financial advice or a trading recommendation.
Rayan Nasser
#Toshiba #Stocks #LongTermInvesting #TechnicalAnalysis #PriceAction #Investing #StockMarket #RiskManagement
From a broader perspective, price has been respecting a large ascending red channel for many years, reflecting a long-term upward structure despite periods of correction.
At the moment, the stock appears to be moving through a corrective phase, trading inside a shorter-term descending blue channel within the broader bullish structure.
What makes the current location especially interesting is that price is now testing an important blue support area that has been respected multiple times since 2018 without a successful breakdown.
This support also aligns with the lower boundary of the broader ascending channel, creating a strong technical confluence zone.
In addition, we can observe the development of bullish divergence, suggesting that downside momentum may be weakening and that the market could be preparing for a shift in direction.
From here, two scenarios become relevant:
→ Bullish scenario:
If support continues holding and buyers regain momentum, this area may become an attractive region to monitor for the next long-term bullish phase. However, for stronger confirmation, price would ideally need to break above the selected grey area around 3350, as this could signal the beginning of a broader recovery phase.
→ Bearish scenario:
If support eventually fails to hold and the broader channel loses structure, the corrective phase may extend and delay the long-term bullish outlook.
For now, the focus is not on predicting the reversal — but on watching whether price can defend support and reclaim key resistance levels.
This is a scenario-based analysis — not a prediction.
Disclaimer: This analysis is shared for educational purposes only. It reflects personal market observations and does not constitute financial advice or a trading recommendation.
Rayan Nasser
#Toshiba #Stocks #LongTermInvesting #TechnicalAnalysis #PriceAction #Investing #StockMarket #RiskManagement

Clause de non-responsabilité
Les informations et publications ne sont pas destinées à être, et ne constituent pas, des conseils ou recommandations financiers, d'investissement, de trading ou autres fournis ou approuvés par TradingView. Pour en savoir plus, consultez les Conditions d'utilisation.
Clause de non-responsabilité
Les informations et publications ne sont pas destinées à être, et ne constituent pas, des conseils ou recommandations financiers, d'investissement, de trading ou autres fournis ou approuvés par TradingView. Pour en savoir plus, consultez les Conditions d'utilisation.