
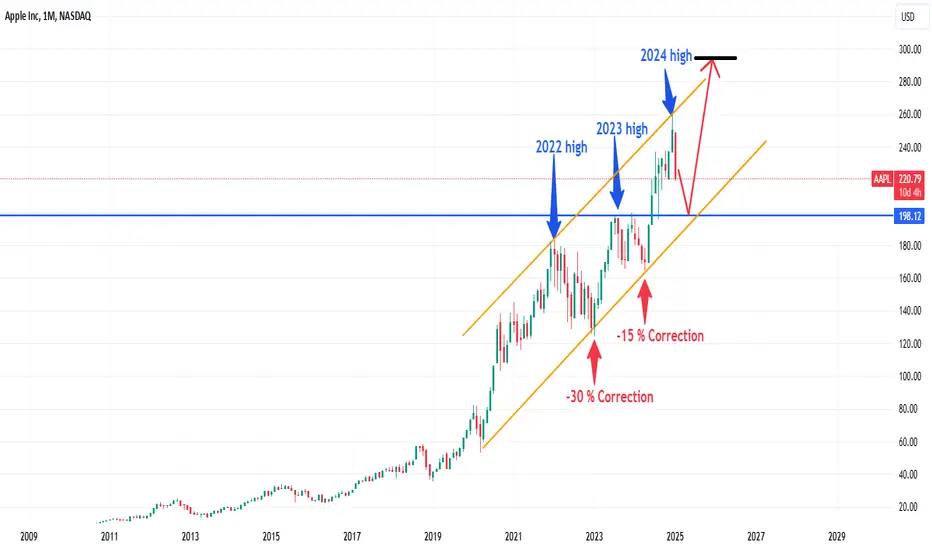
Offcourse the chart is self explanatory.
on daily timeframe where it touches the 200 SMA.
It means that the long term downtrend is gonna start.
Still a big no.... it has to touch the monthly resistance around 200 area.
Dear Traders, Go away and check for another mind.
as investor I already took my position at 240. Will take more position around 200 price.
Let's analyse it again in April-May 2025.
on daily timeframe where it touches the 200 SMA.
It means that the long term downtrend is gonna start.
Still a big no.... it has to touch the monthly resistance around 200 area.
Dear Traders, Go away and check for another mind.
as investor I already took my position at 240. Will take more position around 200 price.
Let's analyse it again in April-May 2025.

Clause de non-responsabilité
Les informations et publications ne sont pas destinées à être, et ne constituent pas, des conseils ou recommandations financiers, d'investissement, de trading ou autres fournis ou approuvés par TradingView. Pour en savoir plus, consultez les Conditions d'utilisation.
Clause de non-responsabilité
Les informations et publications ne sont pas destinées à être, et ne constituent pas, des conseils ou recommandations financiers, d'investissement, de trading ou autres fournis ou approuvés par TradingView. Pour en savoir plus, consultez les Conditions d'utilisation.