Long
Angold Resources (AAU): Potential for big upside
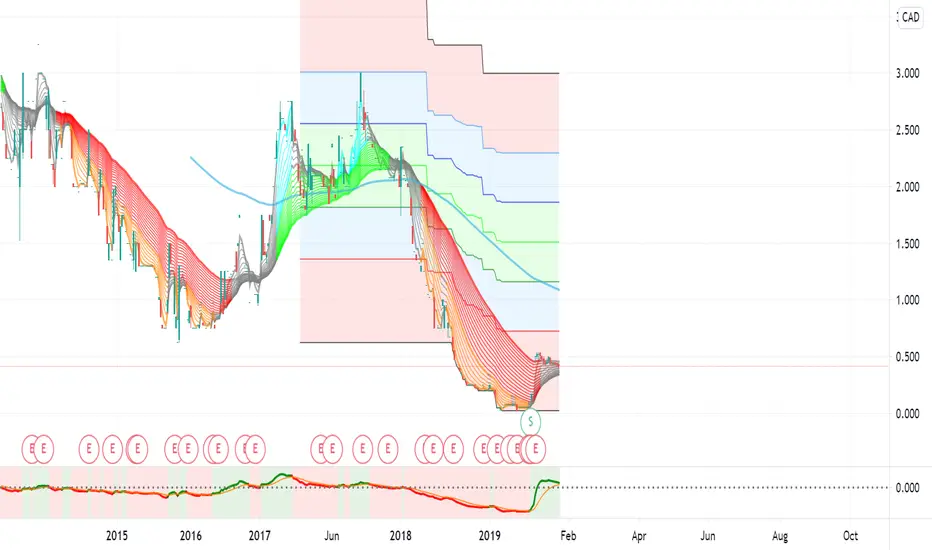
On the 1 day chart for Angold Resources you can see that my super guppy indicator has turned from Red/Orange to grey which indicates incoming volatility and a bounce in price. You can see that the fast EMA's are starting to converge and crossover with the slow EMA's which indicates a bullish reversal may be occurring. When looking at the 1 week chart we can also see a strong signal from our GMMA oscillator. In addition to this we are also starting to see the same convergence and crossover of our fast EMA's and slow EMA's on our 1 week chart that has formed on our 1 day chart. All this indicates a bullish reversal could be underway which would bring some really nice upside.

Clause de non-responsabilité
Les informations et publications ne sont pas destinées à être, et ne constituent pas, des conseils ou recommandations financiers, d'investissement, de trading ou autres fournis ou approuvés par TradingView. Pour en savoir plus, consultez les Conditions d'utilisation.
Clause de non-responsabilité
Les informations et publications ne sont pas destinées à être, et ne constituent pas, des conseils ou recommandations financiers, d'investissement, de trading ou autres fournis ou approuvés par TradingView. Pour en savoir plus, consultez les Conditions d'utilisation.