
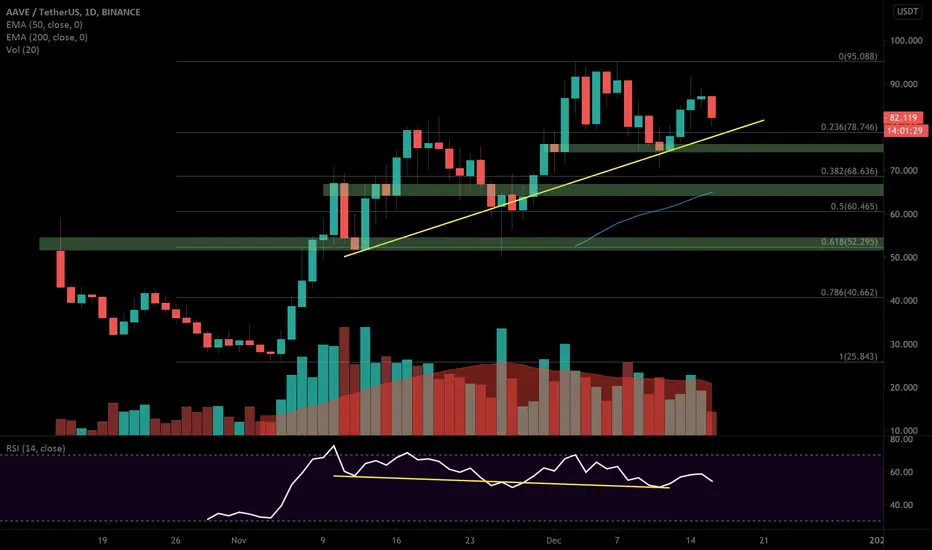
AAVE/USDT looks very weak right now on the daily chart. Strong RSI divergence (yellow lines) shows uptrend has been losing momentum since the peak on November 10 and if today's candle closes in the red it'll be the first lower high on the chart since that explosive rally that started on November 5th.
There are a couple of order block supports (top two green bars) and the 50 EMA (blue) that I think will see some action on the way down. Expecting prices to depress right down to the 0.618 Fibonacci level around $53 though before we see a significant push back from bullish traders.
No timeline for this, just going to wait and see how this unfolds.

Clause de non-responsabilité
Les informations et publications ne sont pas destinées à être, et ne constituent pas, des conseils ou recommandations financiers, d'investissement, de trading ou autres fournis ou approuvés par TradingView. Pour en savoir plus, consultez les Conditions d'utilisation.
Clause de non-responsabilité
Les informations et publications ne sont pas destinées à être, et ne constituent pas, des conseils ou recommandations financiers, d'investissement, de trading ou autres fournis ou approuvés par TradingView. Pour en savoir plus, consultez les Conditions d'utilisation.