
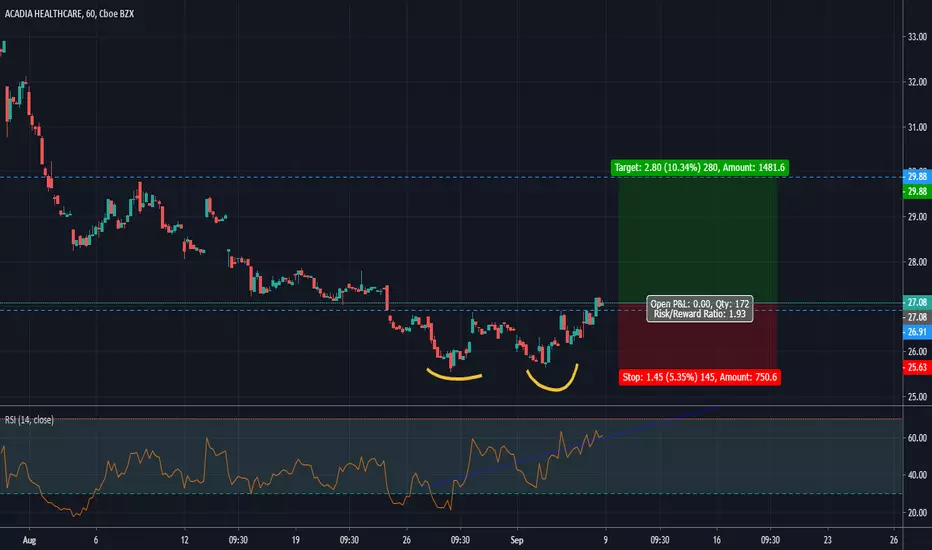
ACHC making a double bottom in the hourly chart and recently crossed above an important fibonacci resistance level
Even RSI has diverged, going long
But not offering that great of a risk to reward, preferred to take a smaller size
Even RSI has diverged, going long
But not offering that great of a risk to reward, preferred to take a smaller size

Clause de non-responsabilité
Les informations et publications ne sont pas destinées à être, et ne constituent pas, des conseils ou recommandations financiers, d'investissement, de trading ou autres fournis ou approuvés par TradingView. Pour en savoir plus, consultez les Conditions d'utilisation.
Clause de non-responsabilité
Les informations et publications ne sont pas destinées à être, et ne constituent pas, des conseils ou recommandations financiers, d'investissement, de trading ou autres fournis ou approuvés par TradingView. Pour en savoir plus, consultez les Conditions d'utilisation.