ADAM20 Bitmex - 4hr Chart
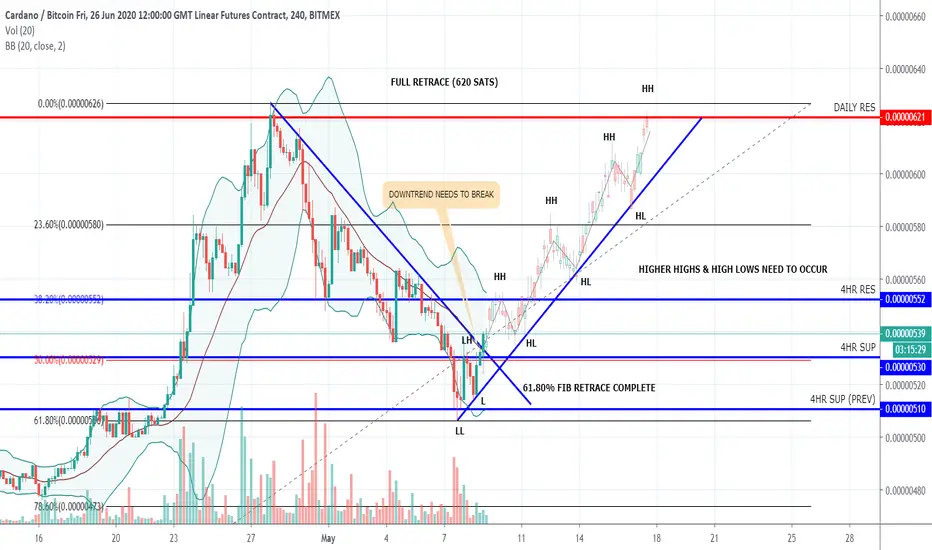
Looking at the 4HR chart for ADAM20 on Bitmex, I've noticed the following;
1) Fib retrace to 61.80% has occurred
2) Higher Low has been made
3) Downtrend line has been broken
4) 4HR Candle close above Mid Boillinger Band
5) Waiting for Higher Higher and Higher Low to be made
6) MacD & RSI looking like buyers are coming in
7) Potential for a nice full retrace to 620 sats if Uptrend continues
First chart published, feedback would be great.

Clause de non-responsabilité
Les informations et publications ne sont pas destinées à être, et ne constituent pas, des conseils ou recommandations financiers, d'investissement, de trading ou autres fournis ou approuvés par TradingView. Pour en savoir plus, consultez les Conditions d'utilisation.
Clause de non-responsabilité
Les informations et publications ne sont pas destinées à être, et ne constituent pas, des conseils ou recommandations financiers, d'investissement, de trading ou autres fournis ou approuvés par TradingView. Pour en savoir plus, consultez les Conditions d'utilisation.