
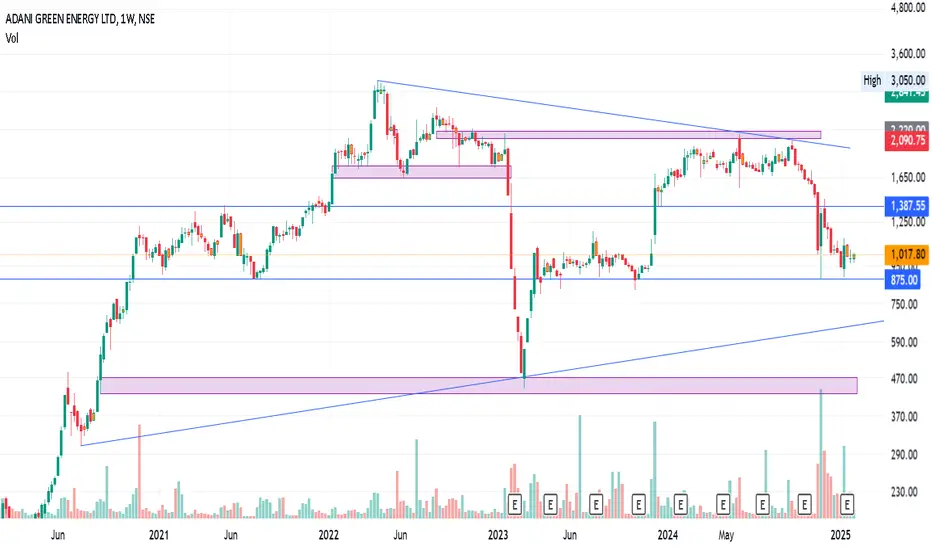
The stock can't be predicted clearly as there are abnormal moves due to various news.
However, it's likely forming an ascending triangle (not clearly).
look for bearishness if it closes below 870 on a weekly TF, and the target would be 600 again. Bullishness is only visible above 2300 or the breakout of the trendline.
For a successful breakout/breakdown, we should ideally see a strong respective timeframe candle on our chart to close —it’s crucial to use that timeframe.
Following the breakout/breakdown, the ideal entry point would be after a consecutive candle that breaks above/below the breakout/breakdown candle
As always, remember to do your own research before making any investment decisions!
However, it's likely forming an ascending triangle (not clearly).
look for bearishness if it closes below 870 on a weekly TF, and the target would be 600 again. Bullishness is only visible above 2300 or the breakout of the trendline.
For a successful breakout/breakdown, we should ideally see a strong respective timeframe candle on our chart to close —it’s crucial to use that timeframe.
Following the breakout/breakdown, the ideal entry point would be after a consecutive candle that breaks above/below the breakout/breakdown candle
As always, remember to do your own research before making any investment decisions!

Clause de non-responsabilité
Les informations et publications ne sont pas destinées à être, et ne constituent pas, des conseils ou recommandations financiers, d'investissement, de trading ou autres fournis ou approuvés par TradingView. Pour en savoir plus, consultez les Conditions d'utilisation.
Clause de non-responsabilité
Les informations et publications ne sont pas destinées à être, et ne constituent pas, des conseils ou recommandations financiers, d'investissement, de trading ou autres fournis ou approuvés par TradingView. Pour en savoir plus, consultez les Conditions d'utilisation.