
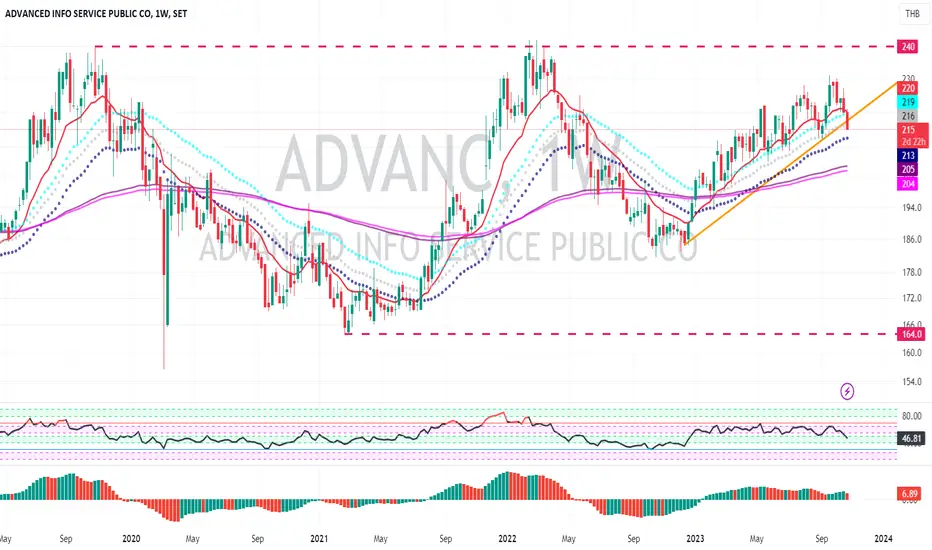
ADVANC , Week Chart , have been sideway in the trading range since 2020
and this week is the first week that price start reverse down and break out the trendline.
RSI and AO show weak momentum signal.
We should monitor how deep that this chart go down by using the daily chart to monitor more detail.
and this week is the first week that price start reverse down and break out the trendline.
RSI and AO show weak momentum signal.
We should monitor how deep that this chart go down by using the daily chart to monitor more detail.

Pragasit Thitaram, CEWA
Clause de non-responsabilité
Les informations et publications ne sont pas destinées à être, et ne constituent pas, des conseils ou recommandations financiers, d'investissement, de trading ou autres fournis ou approuvés par TradingView. Pour en savoir plus, consultez les Conditions d'utilisation.
Pragasit Thitaram, CEWA
Clause de non-responsabilité
Les informations et publications ne sont pas destinées à être, et ne constituent pas, des conseils ou recommandations financiers, d'investissement, de trading ou autres fournis ou approuvés par TradingView. Pour en savoir plus, consultez les Conditions d'utilisation.