Short
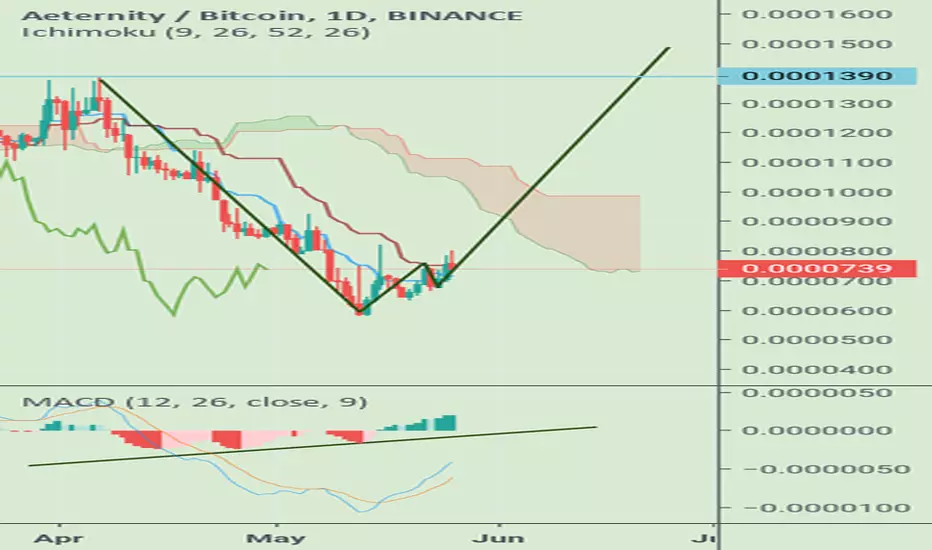
AE/BTC 1D
Hello friends
We are here AE/BTC charts see
1.In the daily chart after 49 days opens candel top of the "Tenkan sen" line on ichimuko indicator ; this means the break resistance short term
2.buliesh divergens in macd indicator
3.nice double bottom pattern in this chart
So i think in short time we see 1500sat but in 1390sat area we have big resistance
I hope this analysis be useful to you. Definitely a financial advice is not

Clause de non-responsabilité
Les informations et publications ne sont pas destinées à être, et ne constituent pas, des conseils ou recommandations financiers, d'investissement, de trading ou autres fournis ou approuvés par TradingView. Pour en savoir plus, consultez les Conditions d'utilisation.
Clause de non-responsabilité
Les informations et publications ne sont pas destinées à être, et ne constituent pas, des conseils ou recommandations financiers, d'investissement, de trading ou autres fournis ou approuvés par TradingView. Pour en savoir plus, consultez les Conditions d'utilisation.