
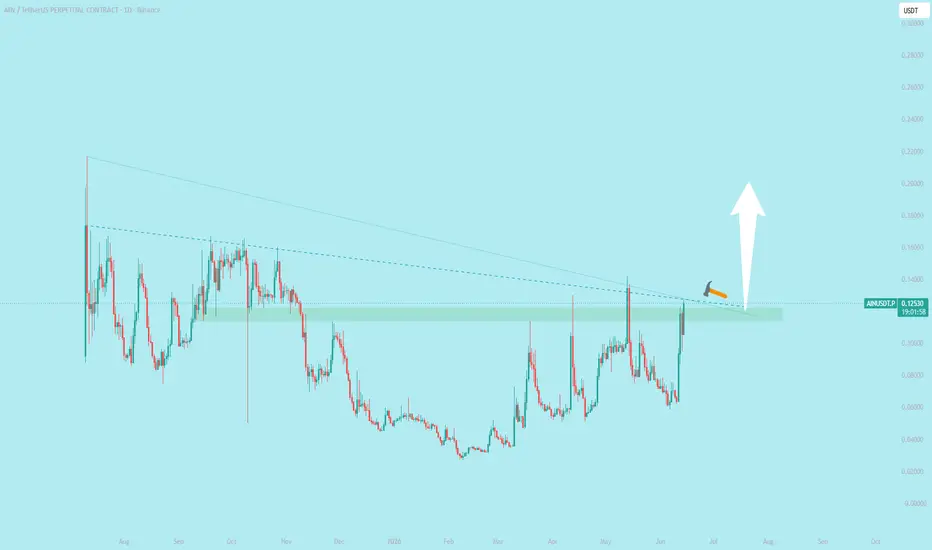
📊 Possible Patterns
- **Falling Wedge (Bullish Reversal)**
- The descending trendline combined with higher lows suggests a wedge formation.
- Price is pressing against the upper boundary, and a breakout above resistance would confirm the wedge pattern.
- Target projection: height of wedge added to breakout point → could push toward **0.14–0.15**.
- **Double Bottom (Reversal)**
- Around the **0.105–0.106** zone, price tested support twice before bouncing.
- This creates a potential double bottom structure, which is bullish if neckline (0.125–0.127) breaks.
- Measured move target: ~0.145.
- **Bullish Hammer Candlestick**
- The recent candle resembles a hammer at the trendline, signaling rejection of lower prices and possible reversal momentum.
---
⚠️ What to Watch
- **Confirmation:** Patterns only matter if confirmed by breakout and volume.
- **Neckline Break:** For the double bottom, a daily close above **0.127** is key.
- **Retest:** Often, price retests the breakout zone before continuing higher.
---
👉 In summary: The chart shows a **falling wedge** and a **double bottom** forming at support. Both are bullish reversal patterns, but confirmation requires a strong breakout above resistance with volume.

Clause de non-responsabilité
Les informations et publications ne sont pas destinées à être, et ne constituent pas, des conseils ou recommandations financiers, d'investissement, de trading ou autres fournis ou approuvés par TradingView. Pour en savoir plus, consultez les Conditions d'utilisation.
Clause de non-responsabilité
Les informations et publications ne sont pas destinées à être, et ne constituent pas, des conseils ou recommandations financiers, d'investissement, de trading ou autres fournis ou approuvés par TradingView. Pour en savoir plus, consultez les Conditions d'utilisation.