
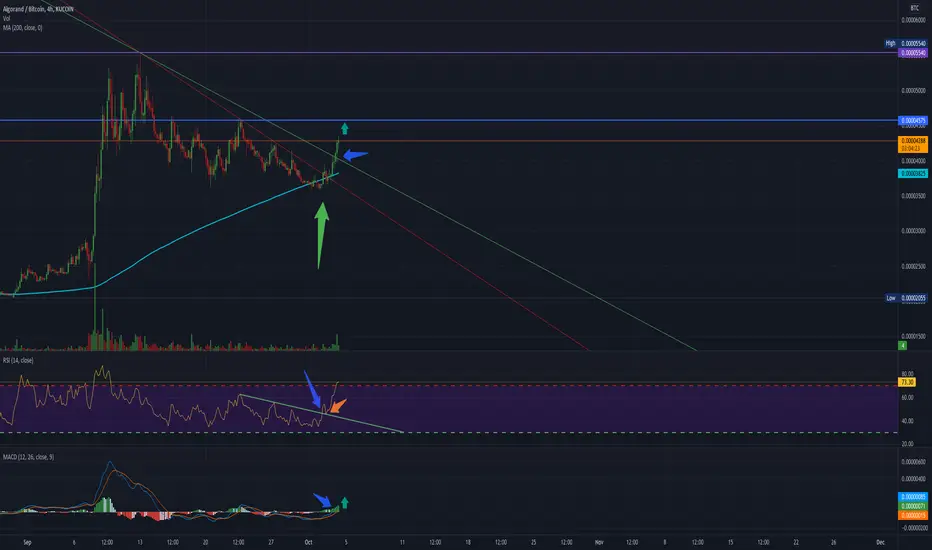
Here is a quick analysis of the ALGO/BTC chart pumping.
Next targets are resistances marked in horizontal ray blue at 4575 sats & purple at 5540 sats per ALGO coin.
Big green arrow shows how the trend tested the 200 MA and bounced off of it making to break the downtrend channel that was created.
RSI indicator shows how once the downtrend was broken (blue small arrow), it backtested before mooning (orange small arrow).
MACD Showing how positive momentum is building up... :)
Note
LOLOLOLOL
Clause de non-responsabilité
Les informations et publications ne sont pas destinées à être, et ne constituent pas, des conseils ou recommandations financiers, d'investissement, de trading ou autres fournis ou approuvés par TradingView. Pour en savoir plus, consultez les Conditions d'utilisation.
Clause de non-responsabilité
Les informations et publications ne sont pas destinées à être, et ne constituent pas, des conseils ou recommandations financiers, d'investissement, de trading ou autres fournis ou approuvés par TradingView. Pour en savoir plus, consultez les Conditions d'utilisation.