Long
Alpha in Wyckoff accumulation pattern
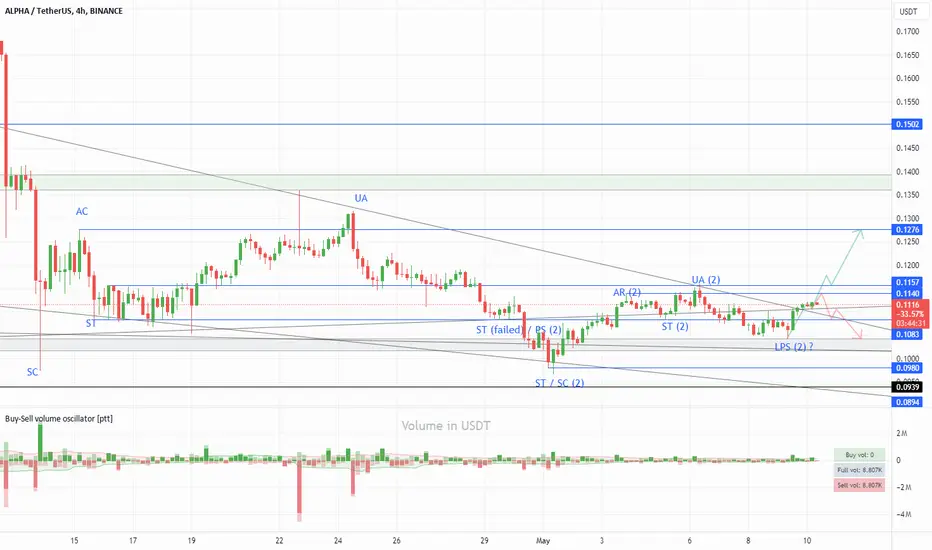
Looking at the 4h chart, it can be clearly seen that it is in an accumulation phase. We are currently after the 2nd ST and will test the UA zone at 0.1276. To do this, we need to look at the chart more closely.

On the 1h chart, we can see that after the 2nd ST, which went all the way below the grey support, a micro Wyckoff accumulation is also happening, which is supposed to create a stronger buying pressure. If the price successfully breaks above UA(2) and retest it, then we go to the aforementioned 4h UA zone. If it fails then we presumably test the grey support again.

On the 1h chart, we can see that after the 2nd ST, which went all the way below the grey support, a micro Wyckoff accumulation is also happening, which is supposed to create a stronger buying pressure. If the price successfully breaks above UA(2) and retest it, then we go to the aforementioned 4h UA zone. If it fails then we presumably test the grey support again.
Note
The idea hasn't changed on my part, although LPS2 may be off, or not yet decided. From here, however, the spring is more likely. Which could even look below 0.098 with a quick dip.
Or if indeed this LPS (or more likely just another test) just drags on, we could be on the green path up.
Note
No change from the previous idea.
Spring was set, LPS (2) in progress, if UA (2) is reached and tested, then we return to the main accumulation phase.
Note
The accumulation phase continues successfully on the 1h chart. The goal is to test the UA on the 4h
Note
Go to 0.135$ and test UA on 4h chart..

Clause de non-responsabilité
Les informations et publications ne sont pas destinées à être, et ne constituent pas, des conseils ou recommandations financiers, d'investissement, de trading ou autres fournis ou approuvés par TradingView. Pour en savoir plus, consultez les Conditions d'utilisation.
Clause de non-responsabilité
Les informations et publications ne sont pas destinées à être, et ne constituent pas, des conseils ou recommandations financiers, d'investissement, de trading ou autres fournis ou approuvés par TradingView. Pour en savoir plus, consultez les Conditions d'utilisation.