
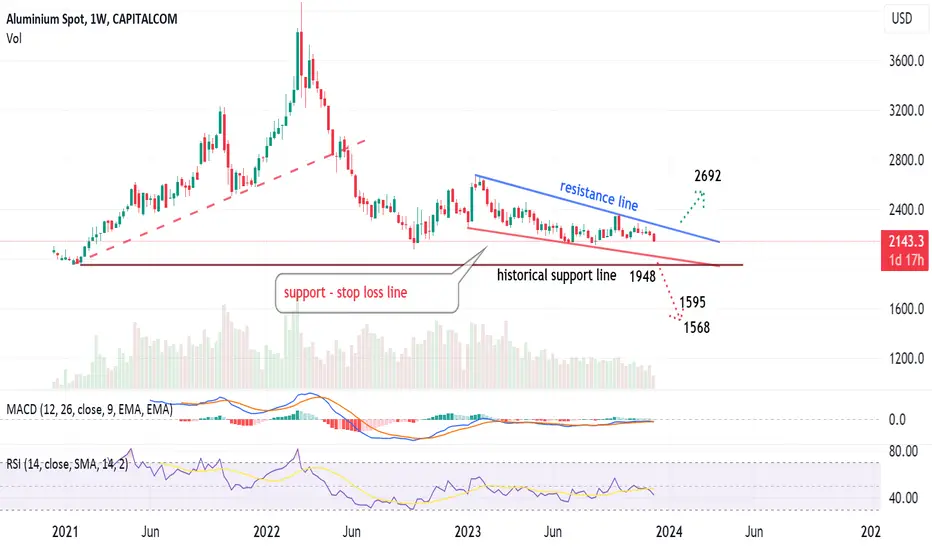
Weekly chart, Aluminum is showing negative indicators RSI and MACD. It seems the price is testing down the support line, then -may be- the historical support line.
Below that level, price can easily go to 1595 and 1568
Above resistance, the target is 2692
Below that level, price can easily go to 1595 and 1568
Above resistance, the target is 2692
Transaction en cours
Aluminium price crossed the resistance line upwards, and activated the target
Clause de non-responsabilité
Les informations et publications ne sont pas destinées à être, et ne constituent pas, des conseils ou recommandations financiers, d'investissement, de trading ou autres fournis ou approuvés par TradingView. Pour en savoir plus, consultez les Conditions d'utilisation.
Clause de non-responsabilité
Les informations et publications ne sont pas destinées à être, et ne constituent pas, des conseils ou recommandations financiers, d'investissement, de trading ou autres fournis ou approuvés par TradingView. Pour en savoir plus, consultez les Conditions d'utilisation.