 AMBER
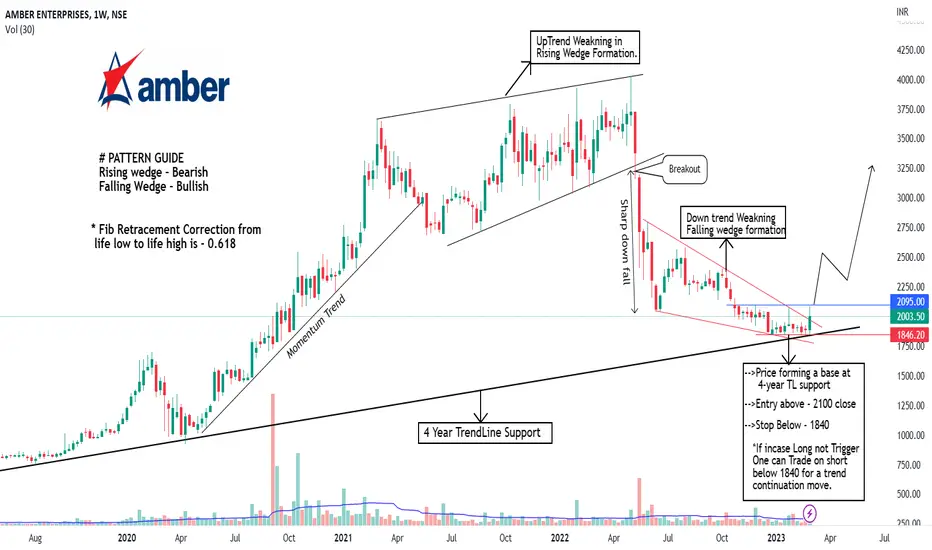
A complete analysis of Amber is explained on the chart.
Entry should be above - 2100 closing on daily Candle.
Stoploss - will be below Box low 1840.
Target are :- 2550/2780+
It shows multiple signals can start an Up-trend are:
1. Price at 4-year long support Trend line (Trend is intact from its life low)
2. Fib Retracement at 0.618 Significant ratio. (Measured up trend from life low to life high)
3. Falling wedge pattern is formed at support and its breakout is also done with good momentum.
4. There is a Rectangle Box Base is Forming. ( The price should break above its horizontal resistance of 2095)
this is only for educational purposes only.
Always trade with stop-loss.
I hope you found this idea helpful.
Please like and comment.
Share with Your Friends.
Keep Learning,
Happy Trading!
Transaction en cours
Took time but moved very well, You can see how a fake breakdown pushes price in the opposite direction 430+ points gains
Publications connexes
Clause de non-responsabilité
Les informations et publications ne sont pas destinées à être, et ne constituent pas, des conseils ou recommandations financiers, d'investissement, de trading ou autres fournis ou approuvés par TradingView. Pour en savoir plus, consultez les Conditions d'utilisation.
Publications connexes
Clause de non-responsabilité
Les informations et publications ne sont pas destinées à être, et ne constituent pas, des conseils ou recommandations financiers, d'investissement, de trading ou autres fournis ou approuvés par TradingView. Pour en savoir plus, consultez les Conditions d'utilisation.