
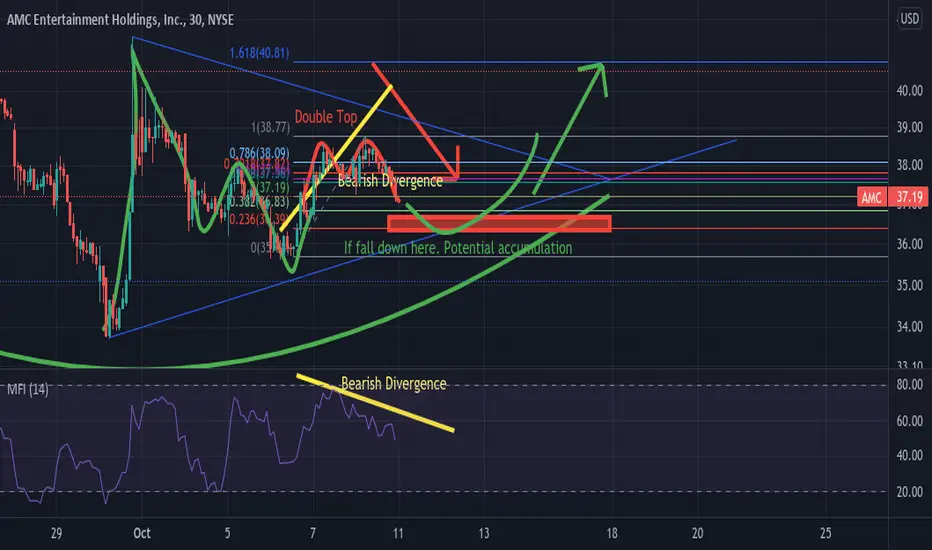
What I thought could be seen a breakout today turns what to bearish double top. What I notice yesterday was a bearish divergence in the 15 min chart today the 30 minute chart confirms it. As the price heads higher the MFI indicators highs drops. The key levels price I will be looking at is $36.30-$36.70. If that key support is hold what I seen is probably an extension of an Inverse Right Shoulder. Meaning that there is still potential of the upside next week. And if its it true there's a potential bear trap at the $36 range. If it drops lower $36. I will readjust.

Clause de non-responsabilité
Les informations et publications ne sont pas destinées à être, et ne constituent pas, des conseils ou recommandations financiers, d'investissement, de trading ou autres fournis ou approuvés par TradingView. Pour en savoir plus, consultez les Conditions d'utilisation.
Clause de non-responsabilité
Les informations et publications ne sont pas destinées à être, et ne constituent pas, des conseils ou recommandations financiers, d'investissement, de trading ou autres fournis ou approuvés par TradingView. Pour en savoir plus, consultez les Conditions d'utilisation.