
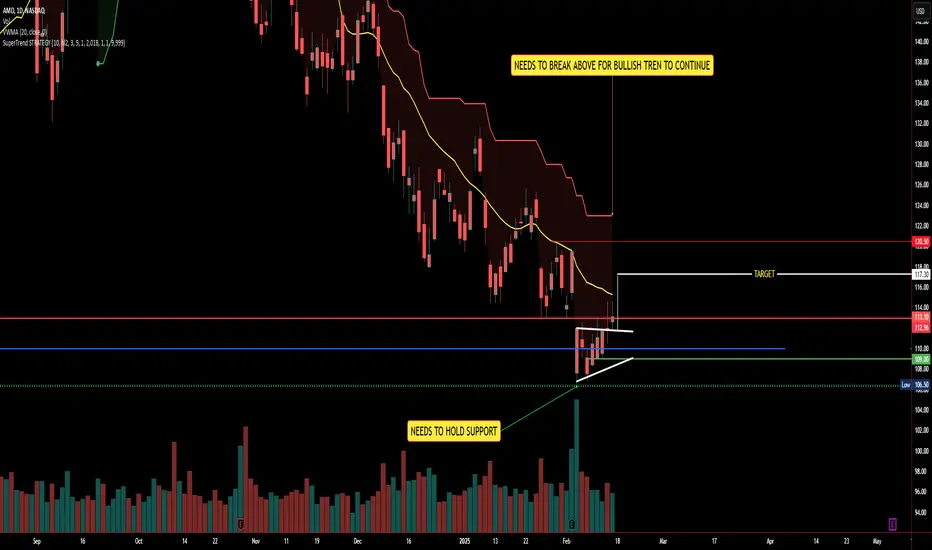
AMD is forming a potential ascending triangle pattern on the daily chart, signaling a possible breakout if momentum continues.
🔍 Key Levels to Watch:
✅ Support Zone: The stock needs to hold above the $108-$109 range for the bullish setup to remain intact.
✅ Breakout Level: A push above $114 could confirm upside continuation.
✅ Target Levels: If AMD breaks out, we could see a move toward $117-$120.50 in the near term.
The yellow 20-day WMA and SuperTrend resistance are key hurdles. A strong close above them would confirm a shift in momentum.
💬 What’s your outlook on AMD? Do you think it can break out, or will it face resistance? Drop your thoughts below! 👇
🔍 Key Levels to Watch:
✅ Support Zone: The stock needs to hold above the $108-$109 range for the bullish setup to remain intact.
✅ Breakout Level: A push above $114 could confirm upside continuation.
✅ Target Levels: If AMD breaks out, we could see a move toward $117-$120.50 in the near term.
The yellow 20-day WMA and SuperTrend resistance are key hurdles. A strong close above them would confirm a shift in momentum.
💬 What’s your outlook on AMD? Do you think it can break out, or will it face resistance? Drop your thoughts below! 👇

Publications connexes
Clause de non-responsabilité
Les informations et publications ne sont pas destinées à être, et ne constituent pas, des conseils ou recommandations financiers, d'investissement, de trading ou autres fournis ou approuvés par TradingView. Pour en savoir plus, consultez les Conditions d'utilisation.
Publications connexes
Clause de non-responsabilité
Les informations et publications ne sont pas destinées à être, et ne constituent pas, des conseils ou recommandations financiers, d'investissement, de trading ou autres fournis ou approuvés par TradingView. Pour en savoir plus, consultez les Conditions d'utilisation.