
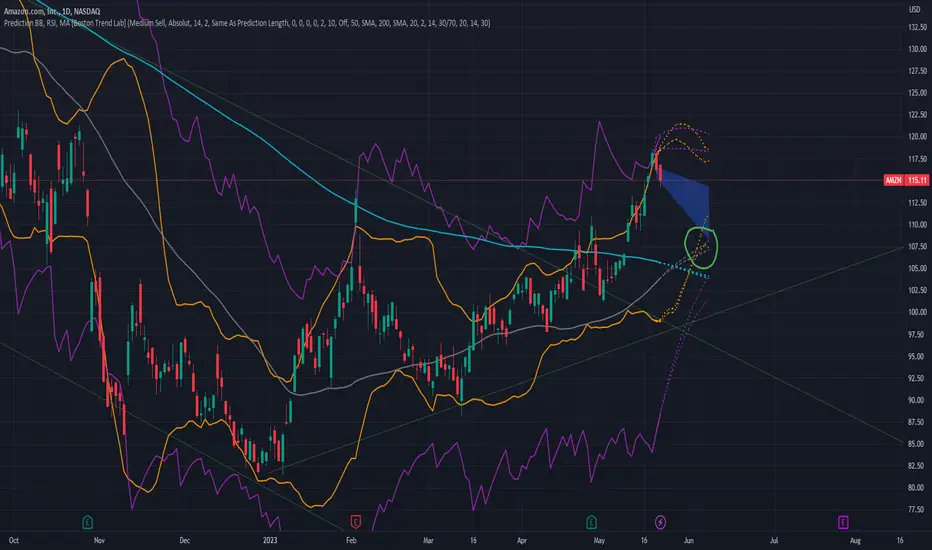
In recent times, the stock price has been increasing exponentially, but it appears that the RSI level of 70 (purple line) has halted the upward momentum. If the uncertain market sentiment continues, the stock may weaken towards the lower Bollinger Band (orange line) and the 50-day moving average (gray line), reaching approximately 107-108 (green circle).
It is important to note that during this period, the 200-day moving average around 104 (turquoise line) and later the lower RSI level, in the case of a steady decline, at approximately 100, could provide support for the stock price.
However, everything can be overridden by the debt ceiling agreement and the FOMC meeting, of course.
It is important to note that during this period, the 200-day moving average around 104 (turquoise line) and later the lower RSI level, in the case of a steady decline, at approximately 100, could provide support for the stock price.
However, everything can be overridden by the debt ceiling agreement and the FOMC meeting, of course.

Clause de non-responsabilité
Les informations et publications ne sont pas destinées à être, et ne constituent pas, des conseils ou recommandations financiers, d'investissement, de trading ou autres fournis ou approuvés par TradingView. Pour en savoir plus, consultez les Conditions d'utilisation.
Clause de non-responsabilité
Les informations et publications ne sont pas destinées à être, et ne constituent pas, des conseils ou recommandations financiers, d'investissement, de trading ou autres fournis ou approuvés par TradingView. Pour en savoir plus, consultez les Conditions d'utilisation.