
Welcome to the second part of our Indicator Stacks series, where we explore how combining carefully selected indicators can bring greater clarity and conviction to our trading decisions.
In Part 1, we looked at building a trend stack. This time, we're applying the same less-is-more philosophy to reversal trading, using just two indicators to assess price extension and momentum.
The aim isn't to predict turning points or generate automatic trading signals. It's to recognise when conditions may be changing, while avoiding the temptation to step in front of strong momentum.
A minimalist reversal stack for daily swing trading
For this example, we're combining Bollinger Bands and the Relative Strength Index (RSI). Both are widely used, but each has a different role in assessing potential reversals.
1. Bollinger Bands (20, 2): The upper and lower bands sit two standard deviations above and below a 20-period moving average. They help us assess how extended price is relative to recent volatility, while the central moving average provides a useful reference for short-term direction.
2. Relative Strength Index (RSI 14): Measures the strength of recent upward and downward price changes. As you probably already know, readings above 70 are commonly considered “overbought”, while readings below 30 are considered “oversold”. However, the direction of RSI and how it behaves around these extremes can tell us much more than just the readings themselves.
Together, these indicators help us answer two questions: Is price becoming stretched, and is momentum beginning to change?
Crucially, neither indicator tells us that a reversal must occur. That's where our understanding of price structure and candle behaviour becomes essential.
One stack, three different examples
We've applied the same combination to three US stocks using daily candle charts. The highlighted areas show where price extension and momentum became particularly relevant.
AMC: When reversals become pullbacks
AMC provides several examples of price reaching or exceeding the upper Bollinger Band while RSI moves towards or above 70. Some of these extremes were followed by sharp pullbacks, but the broader upward trend repeatedly resumed.
This highlights an important distinction. Not every short-term reversal leads to a change in the broader trend. In established trends, periods of price extension can be followed by mean reversion towards the central moving average, before the original direction resumes.
AMC Daily Candle Chart

Past performance is not a reliable indicator of future results
Amazon: When location adds meaning
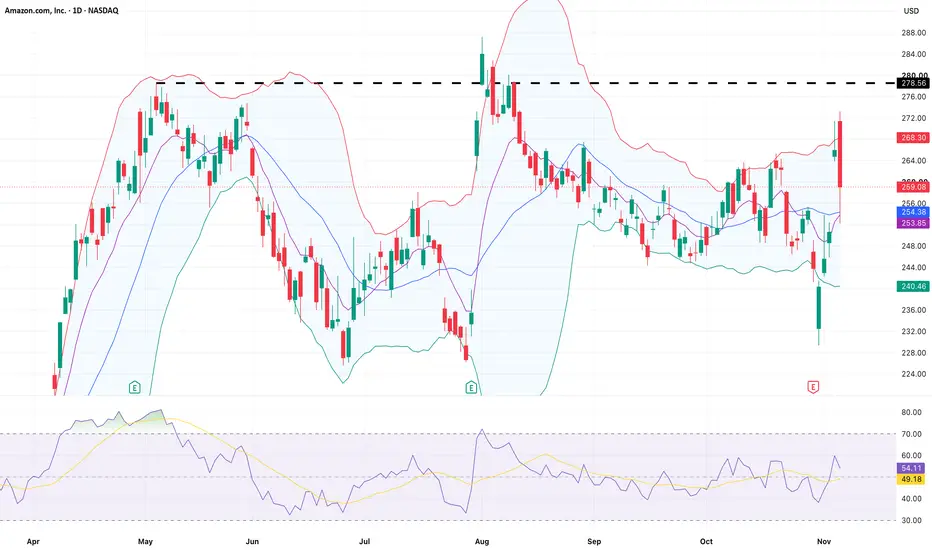
Amazon demonstrates why indicator readings become more useful when combined with price structure. In early August, price pushed above its previous May high around $278.71, extending beyond the upper Bollinger Band as RSI moved into overbought territory.
However, the more meaningful development came afterwards. Price failed to sustain the breakout, RSI turned lower and the market began retreating towards its central moving average. The initial readings highlighted an extended rally, but the subsequent rejection provided stronger evidence of a developing reversal.
Amazon Daily Candle Chart

Past performance is not a reliable indicator of future results
Tesla: From oversold conditions to recovery
Tesla shows the same principles working in the opposite direction. During the sharp July decline, price pushed beneath the lower Bollinger Band while RSI fell below 30, reflecting pronounced downside momentum.
But the oversold reading alone wasn't evidence that the decline had finished. As price began recovering from its lows, RSI turned higher and the market subsequently reclaimed the central Bollinger Band moving average. These developments provided additional evidence that the market's behaviour was beginning to change.
Tesla Daily Candle Chart

Past performance is not a reliable indicator of future results
The difference between an extreme and a reversal
The three examples highlight why patience matters when combining indicators to assess potential turning points.
An overbought RSI doesn't mean buyers are exhausted, just as an oversold reading doesn't mean sellers have finished. Strong momentum can keep price outside the Bollinger Bands and RSI at extreme readings for longer than expected.
Rather than anticipating a reversal simply because both indicators appear stretched, we can look for changes in behaviour. Is RSI beginning to turn away from its extreme? Is price struggling to sustain movement beyond the outer band? Are candles showing rejection around an important structural level?
Even then, a reversal isn't guaranteed. An RSI retreat or a move back inside the bands can simply represent a temporary pause before the original trend resumes.
Turning the stack into better trading decisions
A practical way to approach this combination is to assess price extension first, momentum second and price behaviour third.
Bollinger Bands help us identify when a move is extended relative to recent volatility. RSI helps us assess whether momentum is still supporting that move or beginning to weaken. Price structure and candle behaviour then help us judge whether there's meaningful evidence of a change in direction.
Always prioritise risk management during volatile market conditions, as increased fluctuations can amplify both potential gains and losses
This distinction can make a real difference to our decision-making. Rather than trying to catch the exact high or low, we can be patient and allow the evidence to develop, even if that means missing the initial part of a reversal.
And that brings us back to the central philosophy of this series: every indicator needs to earn its place.
We've deliberately kept this stack minimalist because Bollinger Bands and RSI answer different questions without unnecessarily complicating the chart.
Ultimately, the purpose of an indicator stack isn't to make decisions for us. It's to provide the context and clarity that help us make those decisions more consistently.
Disclaimer: This is for information and learning purposes only. The information provided does not constitute investment advice nor take into account the individual financial circumstances or objectives of any investor. Any information that may be provided relating to past performance is not a reliable indicator of future results or performance. Social media channels are not relevant for UK residents.
Spread bets and CFDs are complex instruments and come with a high risk of losing money rapidly due to leverage. 89% of retail investor accounts lose money when trading spread bets and CFDs with this provider. You should consider whether you understand how spread bets and CFDs work and whether you can afford to take the high risk of losing your money.
In Part 1, we looked at building a trend stack. This time, we're applying the same less-is-more philosophy to reversal trading, using just two indicators to assess price extension and momentum.
The aim isn't to predict turning points or generate automatic trading signals. It's to recognise when conditions may be changing, while avoiding the temptation to step in front of strong momentum.
A minimalist reversal stack for daily swing trading
For this example, we're combining Bollinger Bands and the Relative Strength Index (RSI). Both are widely used, but each has a different role in assessing potential reversals.
1. Bollinger Bands (20, 2): The upper and lower bands sit two standard deviations above and below a 20-period moving average. They help us assess how extended price is relative to recent volatility, while the central moving average provides a useful reference for short-term direction.
2. Relative Strength Index (RSI 14): Measures the strength of recent upward and downward price changes. As you probably already know, readings above 70 are commonly considered “overbought”, while readings below 30 are considered “oversold”. However, the direction of RSI and how it behaves around these extremes can tell us much more than just the readings themselves.
Together, these indicators help us answer two questions: Is price becoming stretched, and is momentum beginning to change?
Crucially, neither indicator tells us that a reversal must occur. That's where our understanding of price structure and candle behaviour becomes essential.
One stack, three different examples
We've applied the same combination to three US stocks using daily candle charts. The highlighted areas show where price extension and momentum became particularly relevant.
AMC: When reversals become pullbacks
AMC provides several examples of price reaching or exceeding the upper Bollinger Band while RSI moves towards or above 70. Some of these extremes were followed by sharp pullbacks, but the broader upward trend repeatedly resumed.
This highlights an important distinction. Not every short-term reversal leads to a change in the broader trend. In established trends, periods of price extension can be followed by mean reversion towards the central moving average, before the original direction resumes.
AMC Daily Candle Chart
Past performance is not a reliable indicator of future results
Amazon: When location adds meaning
Amazon demonstrates why indicator readings become more useful when combined with price structure. In early August, price pushed above its previous May high around $278.71, extending beyond the upper Bollinger Band as RSI moved into overbought territory.
However, the more meaningful development came afterwards. Price failed to sustain the breakout, RSI turned lower and the market began retreating towards its central moving average. The initial readings highlighted an extended rally, but the subsequent rejection provided stronger evidence of a developing reversal.
Amazon Daily Candle Chart
Past performance is not a reliable indicator of future results
Tesla: From oversold conditions to recovery
Tesla shows the same principles working in the opposite direction. During the sharp July decline, price pushed beneath the lower Bollinger Band while RSI fell below 30, reflecting pronounced downside momentum.
But the oversold reading alone wasn't evidence that the decline had finished. As price began recovering from its lows, RSI turned higher and the market subsequently reclaimed the central Bollinger Band moving average. These developments provided additional evidence that the market's behaviour was beginning to change.
Tesla Daily Candle Chart
Past performance is not a reliable indicator of future results
The difference between an extreme and a reversal
The three examples highlight why patience matters when combining indicators to assess potential turning points.
An overbought RSI doesn't mean buyers are exhausted, just as an oversold reading doesn't mean sellers have finished. Strong momentum can keep price outside the Bollinger Bands and RSI at extreme readings for longer than expected.
Rather than anticipating a reversal simply because both indicators appear stretched, we can look for changes in behaviour. Is RSI beginning to turn away from its extreme? Is price struggling to sustain movement beyond the outer band? Are candles showing rejection around an important structural level?
Even then, a reversal isn't guaranteed. An RSI retreat or a move back inside the bands can simply represent a temporary pause before the original trend resumes.
Turning the stack into better trading decisions
A practical way to approach this combination is to assess price extension first, momentum second and price behaviour third.
Bollinger Bands help us identify when a move is extended relative to recent volatility. RSI helps us assess whether momentum is still supporting that move or beginning to weaken. Price structure and candle behaviour then help us judge whether there's meaningful evidence of a change in direction.
Always prioritise risk management during volatile market conditions, as increased fluctuations can amplify both potential gains and losses
This distinction can make a real difference to our decision-making. Rather than trying to catch the exact high or low, we can be patient and allow the evidence to develop, even if that means missing the initial part of a reversal.
And that brings us back to the central philosophy of this series: every indicator needs to earn its place.
We've deliberately kept this stack minimalist because Bollinger Bands and RSI answer different questions without unnecessarily complicating the chart.
Ultimately, the purpose of an indicator stack isn't to make decisions for us. It's to provide the context and clarity that help us make those decisions more consistently.
Disclaimer: This is for information and learning purposes only. The information provided does not constitute investment advice nor take into account the individual financial circumstances or objectives of any investor. Any information that may be provided relating to past performance is not a reliable indicator of future results or performance. Social media channels are not relevant for UK residents.
Spread bets and CFDs are complex instruments and come with a high risk of losing money rapidly due to leverage. 89% of retail investor accounts lose money when trading spread bets and CFDs with this provider. You should consider whether you understand how spread bets and CFDs work and whether you can afford to take the high risk of losing your money.

Clause de non-responsabilité
Les informations et publications ne sont pas destinées à être, et ne constituent pas, des conseils ou recommandations financiers, d'investissement, de trading ou autres fournis ou approuvés par TradingView. Pour en savoir plus, consultez les Conditions d'utilisation.
Clause de non-responsabilité
Les informations et publications ne sont pas destinées à être, et ne constituent pas, des conseils ou recommandations financiers, d'investissement, de trading ou autres fournis ou approuvés par TradingView. Pour en savoir plus, consultez les Conditions d'utilisation.