
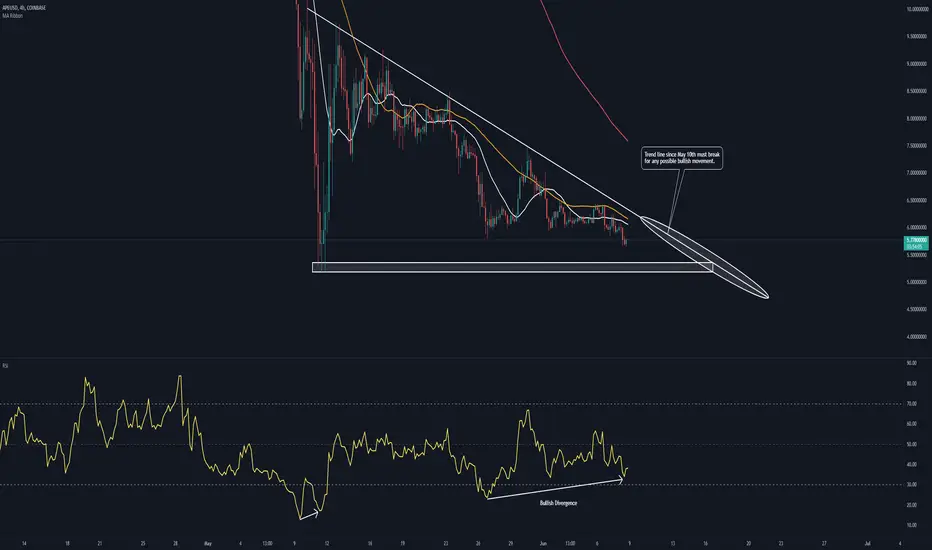
On the 4H chart (and other timeframes), we can see bullish divergence forming where the price action is heading lower and the RSI is making higher lows. This could be a sign of a small reversal coming soon.
Currently, the 4H 50MA (orange line) is acting as resistance, so if we get above that, that would be a good start for a move up.
Support is at $5.20. A break below would invalidate this idea.
Currently, the 4H 50MA (orange line) is acting as resistance, so if we get above that, that would be a good start for a move up.
Support is at $5.20. A break below would invalidate this idea.

Clause de non-responsabilité
Les informations et publications ne sont pas destinées à être, et ne constituent pas, des conseils ou recommandations financiers, d'investissement, de trading ou autres fournis ou approuvés par TradingView. Pour en savoir plus, consultez les Conditions d'utilisation.
Clause de non-responsabilité
Les informations et publications ne sont pas destinées à être, et ne constituent pas, des conseils ou recommandations financiers, d'investissement, de trading ou autres fournis ou approuvés par TradingView. Pour en savoir plus, consultez les Conditions d'utilisation.