
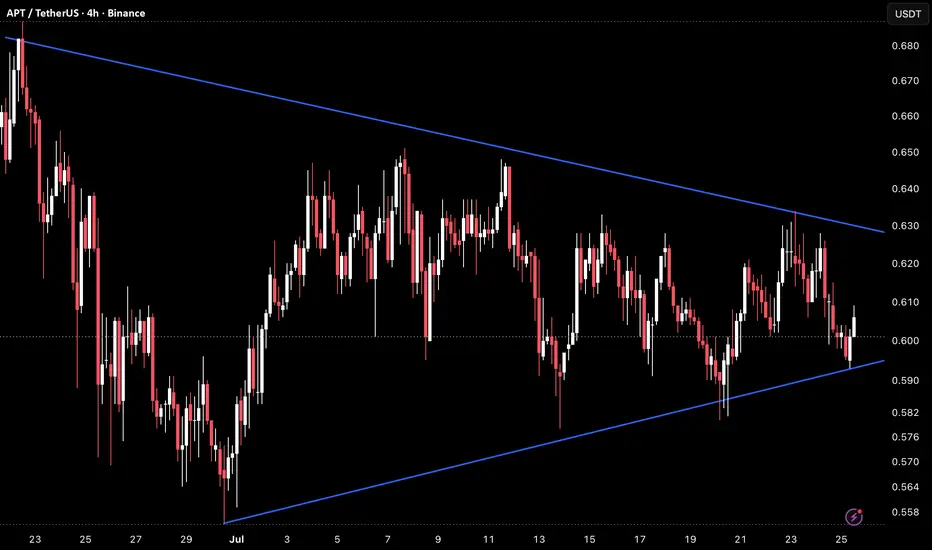
APT on the 4H timeframe is currently trading around 0.661 after oscillating inside a symmetrical triangle since late June, with the descending upper trendline and rising lower trendline now converging tightly as the structure approaches its apex and the 0.600–0.607 horizontal pivot continues to define the lower boundary of the recent price action.
The chart shows a symmetrical triangle formed by a descending upper trendline originating from the late June high near 0.680, connecting through the July 6 high near 0.650, the July 11 high near 0.648, and the July 23 high near 0.632, while the rising lower trendline connects the July 1 low near 0.558 through the July 21 low near 0.582 and the July 24 low near 0.590, now climbing into the 0.593–0.598 area. Price has oscillated between both boundaries consistently, with the descending trendline capping every recovery and the rising trendline catching every significant low. Two horizontal reference levels define the internal structure — one near 0.605–0.607 and a second near 0.600–0.602 — both of which have acted as the lower pivot zone throughout the compression and are currently being tested as price sits just above them. The descending upper trendline is now declining into 0.628–0.632 while the lower trendline rises toward 0.593–0.598, leaving a band of roughly 30–35 points before a resolution is forced.
The compression has been building for nearly four weeks on the 4H timeframe and the trendlines are now meeting almost directly at current price, meaning a directional break is imminent.
Key Levels To Watch
→ 0.675–0.680 – June high, major resistance above
→ 0.648–0.652 – Prior recovery high, resistance
→ 0.628–0.632 – Descending upper trendline, current overhead resistance (dynamic)
→ 0.618–0.622 – Minor resistance zone inside triangle
→ 0.605–0.607 – Horizontal pivot, lower internal reference
→ 0.593–0.598 – Rising lower trendline, dynamic support (climbing)
→ Below 0.558 – Triangle breakdown, extended downside
A confirmed break above the descending upper trendline near 0.628–0.632 and follow-through above 0.648–0.652 would signal a bullish resolution, opening a move toward 0.675–0.680 and potentially above the June high on continuation.
A confirmed break below the rising lower trendline near 0.593–0.598 and a loss of the 0.600–0.607 horizontal would signal a bearish resolution, removing the upward structure from the July low and opening downside toward 0.558 and below with no clear support in between.
Four weeks of compression now at apex, breakout imminent in either direction. Break above 0.628–0.632 → bullish resolution, eyes on 0.648–0.680. Break below 0.593–0.598 → bearish resolution, downside toward 0.558 and below. Bias neutral at apex. Direction confirmed only on a decisive close outside either trendline.
The chart shows a symmetrical triangle formed by a descending upper trendline originating from the late June high near 0.680, connecting through the July 6 high near 0.650, the July 11 high near 0.648, and the July 23 high near 0.632, while the rising lower trendline connects the July 1 low near 0.558 through the July 21 low near 0.582 and the July 24 low near 0.590, now climbing into the 0.593–0.598 area. Price has oscillated between both boundaries consistently, with the descending trendline capping every recovery and the rising trendline catching every significant low. Two horizontal reference levels define the internal structure — one near 0.605–0.607 and a second near 0.600–0.602 — both of which have acted as the lower pivot zone throughout the compression and are currently being tested as price sits just above them. The descending upper trendline is now declining into 0.628–0.632 while the lower trendline rises toward 0.593–0.598, leaving a band of roughly 30–35 points before a resolution is forced.
The compression has been building for nearly four weeks on the 4H timeframe and the trendlines are now meeting almost directly at current price, meaning a directional break is imminent.
Key Levels To Watch
→ 0.675–0.680 – June high, major resistance above
→ 0.648–0.652 – Prior recovery high, resistance
→ 0.628–0.632 – Descending upper trendline, current overhead resistance (dynamic)
→ 0.618–0.622 – Minor resistance zone inside triangle
→ 0.605–0.607 – Horizontal pivot, lower internal reference
→ 0.593–0.598 – Rising lower trendline, dynamic support (climbing)
→ Below 0.558 – Triangle breakdown, extended downside
A confirmed break above the descending upper trendline near 0.628–0.632 and follow-through above 0.648–0.652 would signal a bullish resolution, opening a move toward 0.675–0.680 and potentially above the June high on continuation.
A confirmed break below the rising lower trendline near 0.593–0.598 and a loss of the 0.600–0.607 horizontal would signal a bearish resolution, removing the upward structure from the July low and opening downside toward 0.558 and below with no clear support in between.
Four weeks of compression now at apex, breakout imminent in either direction. Break above 0.628–0.632 → bullish resolution, eyes on 0.648–0.680. Break below 0.593–0.598 → bearish resolution, downside toward 0.558 and below. Bias neutral at apex. Direction confirmed only on a decisive close outside either trendline.

Clause de non-responsabilité
Les informations et publications ne sont pas destinées à être, et ne constituent pas, des conseils ou recommandations financiers, d'investissement, de trading ou autres fournis ou approuvés par TradingView. Pour en savoir plus, consultez les Conditions d'utilisation.
Clause de non-responsabilité
Les informations et publications ne sont pas destinées à être, et ne constituent pas, des conseils ou recommandations financiers, d'investissement, de trading ou autres fournis ou approuvés par TradingView. Pour en savoir plus, consultez les Conditions d'utilisation.