
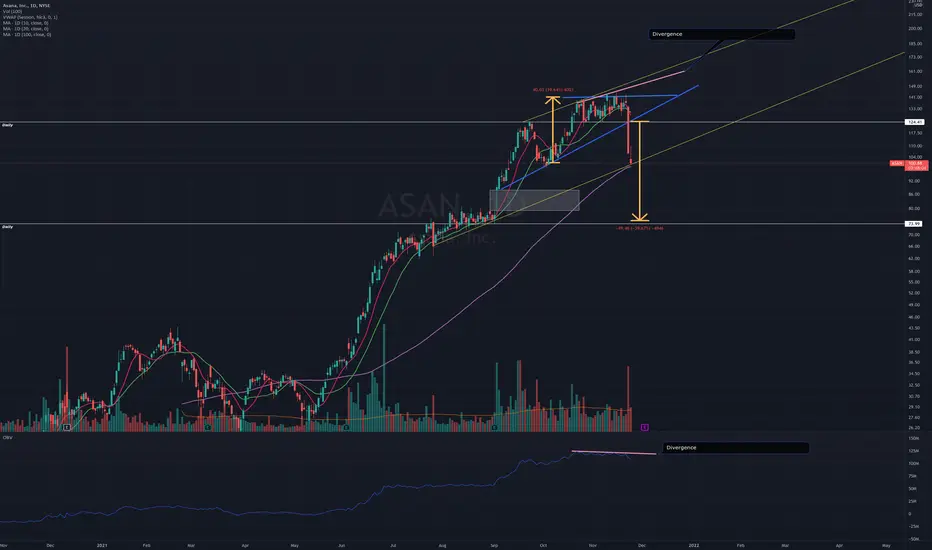
Bearish setup on daily chart. Let me know what you all see.
ASAN Short - Bearish setup
* MA 20/10 crossover
* Ascending triangle breakdown on high volume
* Bearish Divergence on OBV indicator
- Potential area to analyze
Break of trendline support which would also be a confluence area for MA100
Entry - Im thinking the closed below Trendline $98-99
Profit area - Test of gap or gap fill ($ 87 - 79) or implied move of pattern $74.
ASAN Short - Bearish setup
* MA 20/10 crossover
* Ascending triangle breakdown on high volume
* Bearish Divergence on OBV indicator
- Potential area to analyze
Break of trendline support which would also be a confluence area for MA100
Entry - Im thinking the closed below Trendline $98-99
Profit area - Test of gap or gap fill ($ 87 - 79) or implied move of pattern $74.

Clause de non-responsabilité
Les informations et publications ne sont pas destinées à être, et ne constituent pas, des conseils ou recommandations financiers, d'investissement, de trading ou autres fournis ou approuvés par TradingView. Pour en savoir plus, consultez les Conditions d'utilisation.
Clause de non-responsabilité
Les informations et publications ne sont pas destinées à être, et ne constituent pas, des conseils ou recommandations financiers, d'investissement, de trading ou autres fournis ou approuvés par TradingView. Pour en savoir plus, consultez les Conditions d'utilisation.