
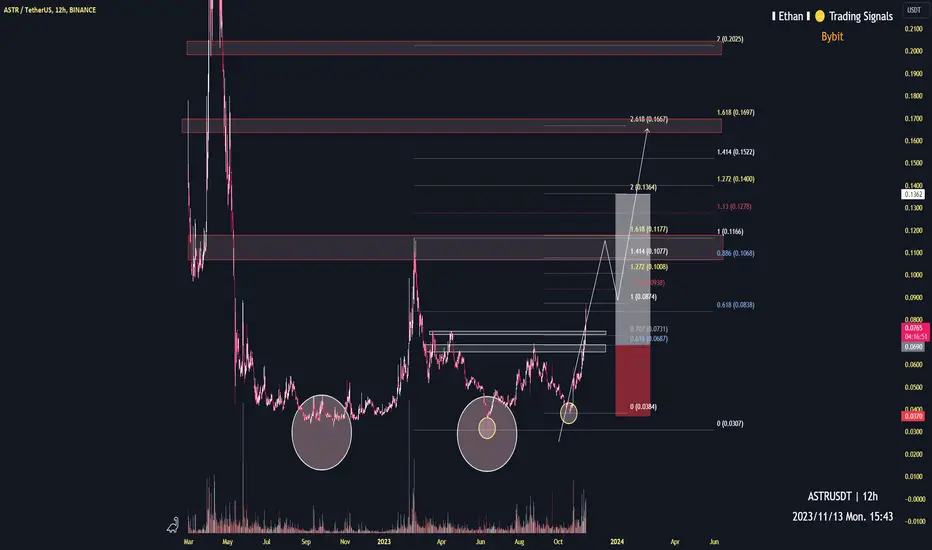
12h time frame
-
ASTR is creating two double bottoms, white and yellow circles which are marked on chart. This is a strong sign of bottom structure. Combining Fibonacci Projection with Structural resistance, we can have three targets as below. However, considering the potential dump of market, ASTR might reach 0.1~0.12 only then pull back with whole market, but we can still expect higher target when bull coming in 2024.
TP: 0.1~0.12 / 0.166 / 0.2
SL: 0.037

Clause de non-responsabilité
Les informations et publications ne sont pas destinées à être, et ne constituent pas, des conseils ou recommandations financiers, d'investissement, de trading ou autres fournis ou approuvés par TradingView. Pour en savoir plus, consultez les Conditions d'utilisation.
Clause de non-responsabilité
Les informations et publications ne sont pas destinées à être, et ne constituent pas, des conseils ou recommandations financiers, d'investissement, de trading ou autres fournis ou approuvés par TradingView. Pour en savoir plus, consultez les Conditions d'utilisation.