
 ATOM :
Pretty interesting chart to get worked on.
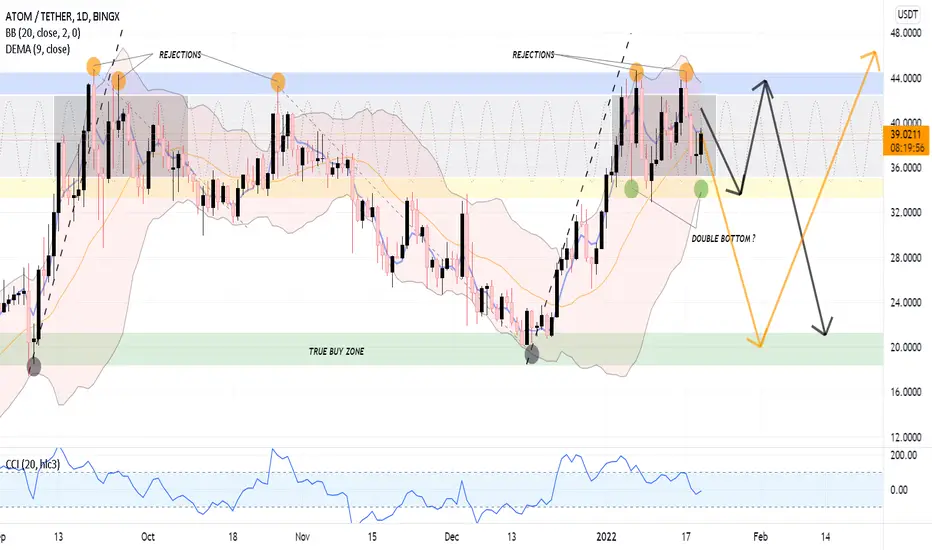
Blue Zone = Major Resistance since September 2021
Dark Grey Zone = Accum./Dist. (exactly confirmed by Sine Wave)
Yellow Zone = Buy Zone 01
Green Zone = Buy Zone 02
Three Possible scenes IMO
1.It might Further follow Sine Pattern and oscillates in the Light grey Zone
2. It might form a Double Bottom (indicated in Green Dots) to get rejected at Blue Zone {it could break blue zone., if and only if VMA crosses > Previous ATH}., also shown as Black Arrows.
3. It might further drop down to Green dot., to further gain heavy Volume so as to break the major resistance (Blue Zone)., as it had done previously.
The above scenes hold true if
 BTC breaks it Previous weeks highs (Weekly close).
Happy Trading

Clause de non-responsabilité
Les informations et publications ne sont pas destinées à être, et ne constituent pas, des conseils ou recommandations financiers, d'investissement, de trading ou autres fournis ou approuvés par TradingView. Pour en savoir plus, consultez les Conditions d'utilisation.
Clause de non-responsabilité
Les informations et publications ne sont pas destinées à être, et ne constituent pas, des conseils ou recommandations financiers, d'investissement, de trading ou autres fournis ou approuvés par TradingView. Pour en savoir plus, consultez les Conditions d'utilisation.