

1. The Macro Context (The "Why") 🌍
Hi traders! Before looking at the candles, let's look at the money.
My fundamental scoring table is giving us a clear signal: we have a +4 differential, pointing toward a Moderate Bullish bias that we simply can't ignore. 🏦
Key Factor Analysis:
🏦 Current Rates: Explanation: AUD is favored with a higher yield of 3.6% compared to CAD's 2.25%, making the Aussie more attractive for carry. Score AUD: +1 | Score CAD: 0
🌍 Economic Regime: Explanation: AUD is facing stagflationary pressures with weak PMI and exploding inflation, while CAD is in a reflationary phase with rising inflation and BOC at neutral. Score AUD: -1 | Score CAD: +1
📊 Rate Expectations: Explanation: RBA is in an active tightening cycle (Hawkish stance with +25bp in February), while the BOC has been holding for 2 meetings. Score AUD: +1 | Score CAD: 0
⚖️ Risk Sentiment: Explanation: Current Risk-off regime penalizes both commodity currencies, but the fundamental spread still favors the AUD. Score AUD: -1 | Score CAD: -1
🏛️ COT Score: Explanation: Speculators are very bullish on AUD with strong buying acceleration. CAD speculators are long but starting to sell with negative momentum. Score AUD: +2 | Score CAD: 0
Currency Score Summary: Total Score AUD: +4 (Bullish) Total Score CAD: 0 (Neutral)
Synthesis:
💡 AUD (Strong, Score +4): Driven by a hawkish RBA, sustainable growth (2.3%), and very bullish COT positioning.
💡 CAD (Neutral, Score 0): Neutral stance from the BOC with moderate growth (1.6%), though currently penalized by risk-off sentiment.
Conclusion: Given this fundamental backdrop, we are strictly looking for Long setups. Going against this bias would be statistical suicide. 🚫
2. The Technical Setup (The "Where") 📉
Timeframe: 4h | Pair: AUD/CAD
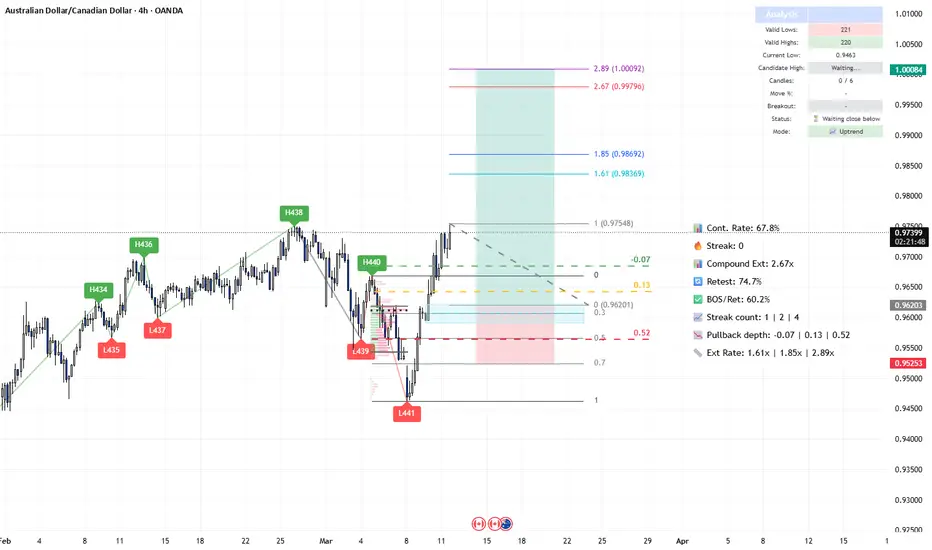
The SMC Market Structure + Price Zones [MaB] indicator has confirmed our statistical edge.
Here’s the probabilistic data from the dashboard:
🚀 Continuation Rate (67.8%): We are currently above the 60% threshold.
This confirms a healthy directional trend where continuation has a much higher probability than a reversal.
🔥 Streak Analysis (0): We are currently on impulse number 1 (resetting from the recent low).
Expected Streak: 1 | 2 | 4
Remaining Moves: High potential for extension. This indicates a Young trend. The statistical range suggests we are at the start of a potential new cycle.
🔄 Retest & Reaction:
Retest Prob (74.7%): High probability of the price returning to test the demand zone.
BOS/Ret Rate (60.2%): Once inside the zone, there is a strong probability of a positive reaction leading to a new BOS.
🎯 Extension & Projection:
Extension Range: The expected extension targets are between 1.61x and 2.89x.
Compound Ext (2.67x): This is the total projected move based on the remaining expected impulses.
By multiplying the current zone height by this factor, we find our ultimate target.
3. Execution Plan on Chart 🎯
Moving over to the charts, we are using these statistics to define our operational levels:
📍 Entry and Stop Loss: We are placing a limit entry within the Demand Zone 4h (Blue Band).
The stop loss is tucked a few pips outside the zone to protect against structural invalidation.
🏁 Statistical Take Profit: Instead of an arbitrary target, we are leveraging the Compound Extension.
We project the target at 2.67x relative to the pullback zone height, aligning with the major 1.00084 level.
This allows us to capture the full extension projected by the algorithm. 🏆
Trade Parameters:
💰 Entry Price: 0.96203
🛡️ Stop Loss: 0.95253
🏆 Take Profit: 1.00084
⚠️ Disclaimer: This analysis is based on a proprietary algorithm and is shared exclusively for educational and didactic purposes.
It does not constitute financial advice or investment solicitation in any way. Trading involves significant risk.
Hi traders! Before looking at the candles, let's look at the money.
My fundamental scoring table is giving us a clear signal: we have a +4 differential, pointing toward a Moderate Bullish bias that we simply can't ignore. 🏦
Key Factor Analysis:
🏦 Current Rates: Explanation: AUD is favored with a higher yield of 3.6% compared to CAD's 2.25%, making the Aussie more attractive for carry. Score AUD: +1 | Score CAD: 0
🌍 Economic Regime: Explanation: AUD is facing stagflationary pressures with weak PMI and exploding inflation, while CAD is in a reflationary phase with rising inflation and BOC at neutral. Score AUD: -1 | Score CAD: +1
📊 Rate Expectations: Explanation: RBA is in an active tightening cycle (Hawkish stance with +25bp in February), while the BOC has been holding for 2 meetings. Score AUD: +1 | Score CAD: 0
⚖️ Risk Sentiment: Explanation: Current Risk-off regime penalizes both commodity currencies, but the fundamental spread still favors the AUD. Score AUD: -1 | Score CAD: -1
🏛️ COT Score: Explanation: Speculators are very bullish on AUD with strong buying acceleration. CAD speculators are long but starting to sell with negative momentum. Score AUD: +2 | Score CAD: 0
Currency Score Summary: Total Score AUD: +4 (Bullish) Total Score CAD: 0 (Neutral)
Synthesis:
💡 AUD (Strong, Score +4): Driven by a hawkish RBA, sustainable growth (2.3%), and very bullish COT positioning.
💡 CAD (Neutral, Score 0): Neutral stance from the BOC with moderate growth (1.6%), though currently penalized by risk-off sentiment.
Conclusion: Given this fundamental backdrop, we are strictly looking for Long setups. Going against this bias would be statistical suicide. 🚫
2. The Technical Setup (The "Where") 📉
Timeframe: 4h | Pair: AUD/CAD
The SMC Market Structure + Price Zones [MaB] indicator has confirmed our statistical edge.
Here’s the probabilistic data from the dashboard:
🚀 Continuation Rate (67.8%): We are currently above the 60% threshold.
This confirms a healthy directional trend where continuation has a much higher probability than a reversal.
🔥 Streak Analysis (0): We are currently on impulse number 1 (resetting from the recent low).
Expected Streak: 1 | 2 | 4
Remaining Moves: High potential for extension. This indicates a Young trend. The statistical range suggests we are at the start of a potential new cycle.
🔄 Retest & Reaction:
Retest Prob (74.7%): High probability of the price returning to test the demand zone.
BOS/Ret Rate (60.2%): Once inside the zone, there is a strong probability of a positive reaction leading to a new BOS.
🎯 Extension & Projection:
Extension Range: The expected extension targets are between 1.61x and 2.89x.
Compound Ext (2.67x): This is the total projected move based on the remaining expected impulses.
By multiplying the current zone height by this factor, we find our ultimate target.
3. Execution Plan on Chart 🎯
Moving over to the charts, we are using these statistics to define our operational levels:
📍 Entry and Stop Loss: We are placing a limit entry within the Demand Zone 4h (Blue Band).
The stop loss is tucked a few pips outside the zone to protect against structural invalidation.
🏁 Statistical Take Profit: Instead of an arbitrary target, we are leveraging the Compound Extension.
We project the target at 2.67x relative to the pullback zone height, aligning with the major 1.00084 level.
This allows us to capture the full extension projected by the algorithm. 🏆
Trade Parameters:
💰 Entry Price: 0.96203
🛡️ Stop Loss: 0.95253
🏆 Take Profit: 1.00084
⚠️ Disclaimer: This analysis is based on a proprietary algorithm and is shared exclusively for educational and didactic purposes.
It does not constitute financial advice or investment solicitation in any way. Trading involves significant risk.

Trading indicators development focused on Smart Money Concepts (SMC), market structure analysis, and liquidity zones.
WEBSITE: mab-arreca.com/
WHOP: whop.com/mab-9cb1/
YOUTUBE: youtube.com/@MaB.arreca
WEBSITE: mab-arreca.com/
WHOP: whop.com/mab-9cb1/
YOUTUBE: youtube.com/@MaB.arreca
Publications connexes
Clause de non-responsabilité
Les informations et publications ne sont pas destinées à être, et ne constituent pas, des conseils ou recommandations financiers, d'investissement, de trading ou autres fournis ou approuvés par TradingView. Pour en savoir plus, consultez les Conditions d'utilisation.
Trading indicators development focused on Smart Money Concepts (SMC), market structure analysis, and liquidity zones.
WEBSITE: mab-arreca.com/
WHOP: whop.com/mab-9cb1/
YOUTUBE: youtube.com/@MaB.arreca
WEBSITE: mab-arreca.com/
WHOP: whop.com/mab-9cb1/
YOUTUBE: youtube.com/@MaB.arreca
Publications connexes
Clause de non-responsabilité
Les informations et publications ne sont pas destinées à être, et ne constituent pas, des conseils ou recommandations financiers, d'investissement, de trading ou autres fournis ou approuvés par TradingView. Pour en savoir plus, consultez les Conditions d'utilisation.