

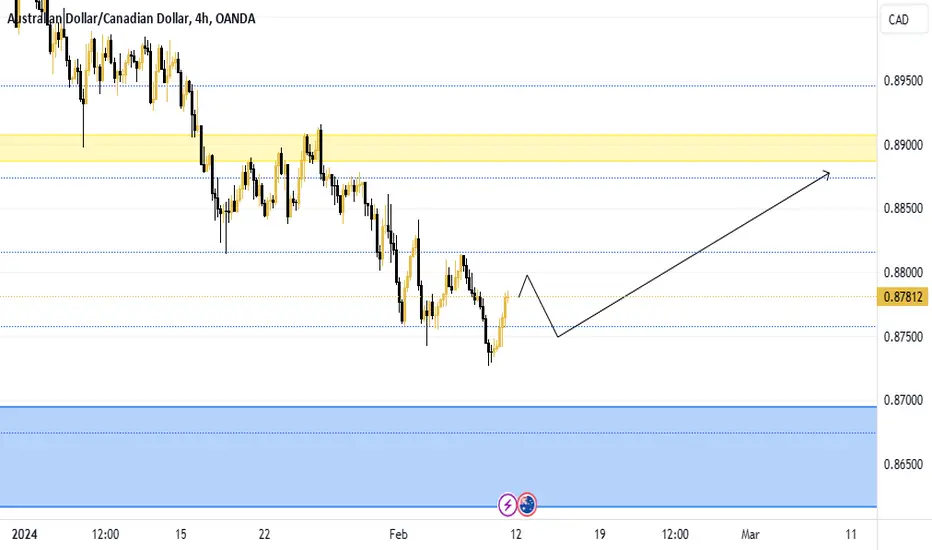
Monthly Time Frame

Weekly Time Frame

4Hour Time Frame

- Price made a bearish push until it closed as a doji candlestick found support at the weekly demand zone then made a bullish push
- After the bullish push price met resistance at a weekly supply zone ultimately forming a high. Price then began to sell off (retrace).
Weekly Time Frame
- Price met resistance, formed a double top, and closed as a doji followed by a bearish engulfing signaling a selloff.
- During the sell-off (retracement) price found support at the 61.8 fib level and closed as doji candle stick signaling a potential reversal.
4Hour Time Frame
- I am anticipating price forming a double bottom as a candlestick reversal pattern.
- I am expecting a bullish push to 0.895
Note
Price is beginning to make its bullish push as anticapted.
Clause de non-responsabilité
Les informations et publications ne sont pas destinées à être, et ne constituent pas, des conseils ou recommandations financiers, d'investissement, de trading ou autres fournis ou approuvés par TradingView. Pour en savoir plus, consultez les Conditions d'utilisation.
Clause de non-responsabilité
Les informations et publications ne sont pas destinées à être, et ne constituent pas, des conseils ou recommandations financiers, d'investissement, de trading ou autres fournis ou approuvés par TradingView. Pour en savoir plus, consultez les Conditions d'utilisation.