

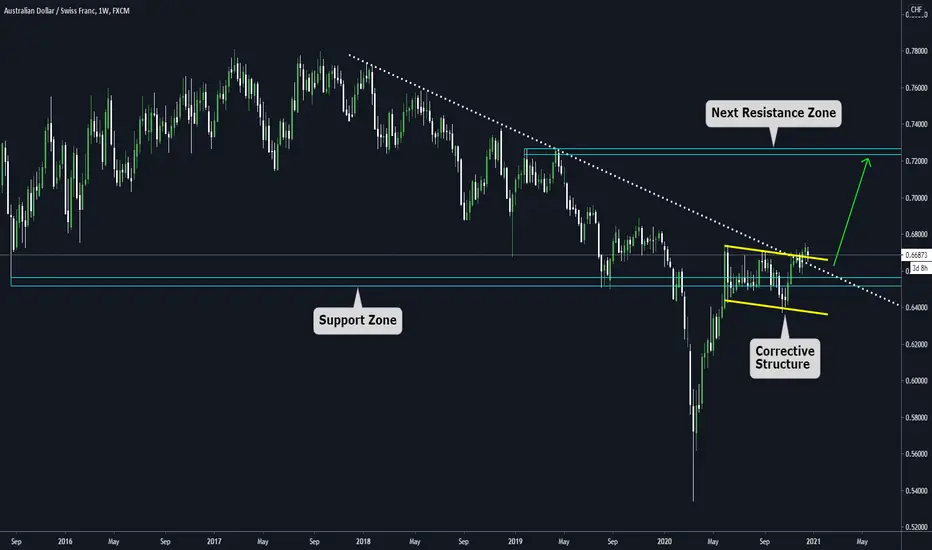
Let's take a look at the weekly chart on AUDCHF.
We have 3 relevant items to pay attention to
a) Broken descending trendline.
b) The price above a Huge support zone.
c) A massive Flag pattern on the edge of the broken descending trendline.
From a technical perspective, a Flag pattern is considered a continuation structure, which means that we have a sideways movement during a period of time, only for the price to keep going in the previous direction after the breakout.
We have 3 relevant items to pay attention to
a) Broken descending trendline.
b) The price above a Huge support zone.
c) A massive Flag pattern on the edge of the broken descending trendline.
From a technical perspective, a Flag pattern is considered a continuation structure, which means that we have a sideways movement during a period of time, only for the price to keep going in the previous direction after the breakout.

Clause de non-responsabilité
Les informations et publications ne sont pas destinées à être, et ne constituent pas, des conseils ou recommandations financiers, d'investissement, de trading ou autres fournis ou approuvés par TradingView. Pour en savoir plus, consultez les Conditions d'utilisation.
Clause de non-responsabilité
Les informations et publications ne sont pas destinées à être, et ne constituent pas, des conseils ou recommandations financiers, d'investissement, de trading ou autres fournis ou approuvés par TradingView. Pour en savoir plus, consultez les Conditions d'utilisation.