
Avalanche (AVAX) technical analysis:
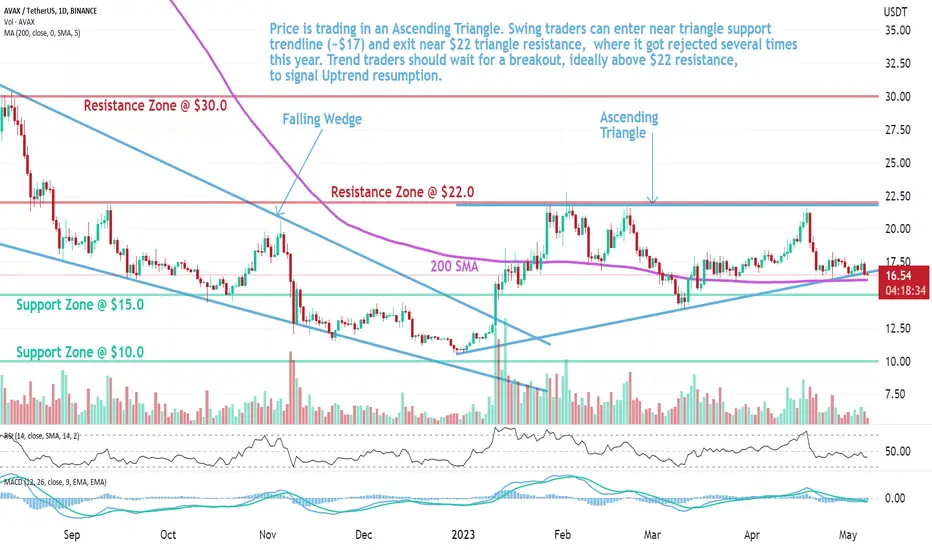
Trade setup: Price is trading in an Ascending Triangle. Swing traders can enter near triangle support trendline (~$17) and exit near $22 triangle resistance, where it got rejected several times this year. Trend traders should wait for a breakout, ideally above $22 resistance, to signal Uptrend resumption.
Trend: Downtrend on Short- and Medium-Term basis and Uptrend on Long-Term basis.
Momentum is Bearish but inflecting. MACD Line is below MACD Signal Line and RSI is below 45 but momentum may have bottomed since MACD Histogram bars are rising, which suggests that momentum could be nearing another upswing.
Support and Resistance: Nearest Support Zone is $15, (previous resistance), then $10. The nearest Resistance Zone is $22, then $30.
Trade setup: Price is trading in an Ascending Triangle. Swing traders can enter near triangle support trendline (~$17) and exit near $22 triangle resistance, where it got rejected several times this year. Trend traders should wait for a breakout, ideally above $22 resistance, to signal Uptrend resumption.
Trend: Downtrend on Short- and Medium-Term basis and Uptrend on Long-Term basis.
Momentum is Bearish but inflecting. MACD Line is below MACD Signal Line and RSI is below 45 but momentum may have bottomed since MACD Histogram bars are rising, which suggests that momentum could be nearing another upswing.
Support and Resistance: Nearest Support Zone is $15, (previous resistance), then $10. The nearest Resistance Zone is $22, then $30.

Clause de non-responsabilité
Les informations et publications ne sont pas destinées à être, et ne constituent pas, des conseils ou recommandations financiers, d'investissement, de trading ou autres fournis ou approuvés par TradingView. Pour en savoir plus, consultez les Conditions d'utilisation.
Clause de non-responsabilité
Les informations et publications ne sont pas destinées à être, et ne constituent pas, des conseils ou recommandations financiers, d'investissement, de trading ou autres fournis ou approuvés par TradingView. Pour en savoir plus, consultez les Conditions d'utilisation.