
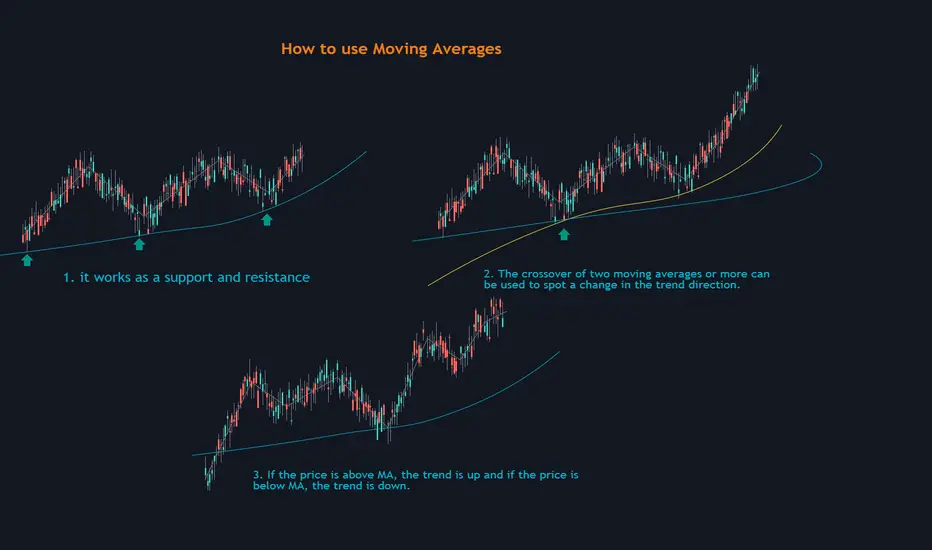
A moving average can act as support or resistance. In an uptrend, a 50-day, 100-day or 200-day moving average may act as a support level, as shown in the figure.
In an uptrend, a moving average may act as support; like a floor, the price hits the level and then starts to rise again. (1)
In a downtrend, a moving average may act as resistance; like a ceiling, the price hits the level and then starts to drop again.
Crossovers are one of the main moving average strategies.
Another strategy is to apply two moving averages to a chart: one longer and one shorter. When the shorter-term MA crosses above the longer-term MA, it's a buy signal, as it indicates that the trend is shifting up. This is known as a "golden cross." (2)
on the other side if the shorter-term MA crosses below the longer-term MA, it's a sell signal, as it indicates that the trend is shifting down. This is known as a "death cross."
The second type is a price crossover (3) which is when the price crosses above or below a moving average to signal a potential change in trend.
In an uptrend, a moving average may act as support; like a floor, the price hits the level and then starts to rise again. (1)
In a downtrend, a moving average may act as resistance; like a ceiling, the price hits the level and then starts to drop again.
Crossovers are one of the main moving average strategies.
Another strategy is to apply two moving averages to a chart: one longer and one shorter. When the shorter-term MA crosses above the longer-term MA, it's a buy signal, as it indicates that the trend is shifting up. This is known as a "golden cross." (2)
on the other side if the shorter-term MA crosses below the longer-term MA, it's a sell signal, as it indicates that the trend is shifting down. This is known as a "death cross."
The second type is a price crossover (3) which is when the price crosses above or below a moving average to signal a potential change in trend.

Signals and analysis derived from artificial intelligence models and experts
ChartDepth.com?utm_source=tradingview
play.google.com/store/apps/details?id=com.chartdepth.ai
apps.apple.com/gb/app/chartdepth/id1560762940
ChartDepth.com?utm_source=tradingview
play.google.com/store/apps/details?id=com.chartdepth.ai
apps.apple.com/gb/app/chartdepth/id1560762940
Clause de non-responsabilité
Les informations et publications ne sont pas destinées à être, et ne constituent pas, des conseils ou recommandations financiers, d'investissement, de trading ou autres fournis ou approuvés par TradingView. Pour en savoir plus, consultez les Conditions d'utilisation.
Signals and analysis derived from artificial intelligence models and experts
ChartDepth.com?utm_source=tradingview
play.google.com/store/apps/details?id=com.chartdepth.ai
apps.apple.com/gb/app/chartdepth/id1560762940
ChartDepth.com?utm_source=tradingview
play.google.com/store/apps/details?id=com.chartdepth.ai
apps.apple.com/gb/app/chartdepth/id1560762940
Clause de non-responsabilité
Les informations et publications ne sont pas destinées à être, et ne constituent pas, des conseils ou recommandations financiers, d'investissement, de trading ou autres fournis ou approuvés par TradingView. Pour en savoir plus, consultez les Conditions d'utilisation.